Today we use the real TP-LINK equipment panel as a model to complete the construction of the equipment panel, and the flashing of the indicator lights and the flow of graphics elements.
Let's witness the final realization effect first: http://www.hightopo.com/demo/blog_tplink_20170511/index.html
1. TP-LINK panel
We start with the device panel of TP-LINK. The schematic diagram of the device panel is as follows:
Obviously, the device panel can basically be composed of basic graphics (rect, circle, oval, etc.) of HT for Web ( http://www.hightopo.com/guide/guide/core/beginners/ht-beginners-guide.html ) , and the interface in the middle needs to be solved with custom graphics. Let's implement it step by step. The preparations are as follows:
Import our HT (http://www.hightopo.com/):
<script src="ht.js"></script>
Create a data model container and add it to the DOM:
dataModel = new ht.DataModel();//Create a data model container
graphView = new ht.graph.GraphView(dataModel);//Create a topology graph component
graphView.addToDOM();
Maybe someone is confused when they see addToDOM() here? Yes, this is the new API of HT ! Before we created a graphical interface, we not only needed to define the top and left of mian in the CSS style, but also needed to monitor the resize event of the window object, etc., so we added addToDOM() to help you do this series of things. , you can look at the implementation in the source code:
    p.addToDOM = function(){
        var self = this,
            view = self.getView(),
            style = view.style;
        document.body.appendChild(view);
        style.left = '0';
        style.right = '0';
        style.top = '0';
        style.bottom = '0';
        window.addEventListener('resize', function () { self.iv(); }, false);
        self.iv ();
    },
After the preparation is completed, you can start the drawing of the panel. For basic graphics, you only need to set the corresponding style, such as the button part with stereo effect:
{
      type: "circle",
      shadow: true,
      background: "rgb(0,0,0)",
      borderWidth: 1,
      borderColor: "rgb(0,0,0)",
      border3d: true,
      gradient: "spread.horizontal",
      gradientColor: "rgb(79,77,77)",
      dashColor: "rgb(0,0,0)",
      rotation: 3.141592653589793,
      rect: [
        677, 157,
        43, 34
      ]
}
For custom shapes, it has also been introduced before, see the HT for Web Shapes Manual ( http://www.hightopo.com/guide/guide/core/shape/ht-shape-guide.html ) for details. The vector type needs to be specified as shape, and its shape is mainly described by the two attributes points and segments:
points is the vertex information of the ht.List type array, and the vertex is an object in the format of {x: 100, y: 200};
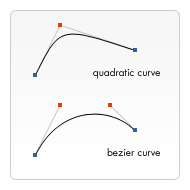
segments is the line segment array information of type ht.List. Line segments are integers from 1 to 5, which represent different vertex connection methods. Segments are mainly used to draw curves or jump breakpoints. The value of 1 to 5 means as follows:
1: moveTo, occupying information of a point, representing the starting point of a new path;
2: lineTo, occupying a point information, representing the connection from the last point to this point;
3: quadraticCurveTo, occupying three point information, the first point is used as the curve control point, and the second point is used as the curve end point;
4: bezierCurveTo, occupying three point information, the first and second points are used as curve control points, and the third point is used as the end point of the curve;
5: closePath, which does not occupy point information, represents the end of this path drawing and closes to the starting point of the path.
An example is as follows:
    ht.Default.setImage('tplink', {
        width: 97,
        height: 106,
        comps: [
            {
          type: "shape",
          background: "rgb(20,60,140)",
          borderWidth: 8,
          borderColor: "gray",
          borderCap: "round",
          points: [
            269, 140,
            359, 140,
            359, 180,
            329, 180,
            329, 190,
            299, 190,
            299, 180,
            269, 180,
            269, 140
          ]}
        ]
    });
After integrating all the graphic data, the data of our TPLINK panel is formed. The integration method is as follows:
    ht.Default.setImage('tplink', {
        width: 97,
        height: 106,
        comps: [
            {
          type: "shape",
          background: "rgb(20,60,140)",
          borderWidth: 8,
          borderColor: "gray",
          borderCap: "round",
          points: [
            269, 140,
            359, 140,
            359, 180,
            329, 180,
            329, 190,
            299, 190,
            299, 180,
            269, 180,
            269, 140
          ]},
           {
          type: "circle",
          shadow: true,
          background: "rgb(0,0,0)",
          borderWidth: 1,
          borderColor: "rgb(0,0,0)",
          border3d: true,
          gradient: "spread.horizontal",
          gradientColor: "rgb(79,77,77)",
          dashColor: "rgb(0,0,0)",
          rotation: 3,
          rect: [
            677, 157,
            43, 34
          ]},
          //...
          //...
          //...
          //Multiple graphics components
      ]
    });
This is just one of the ways to register images, we can also register directly through the url (see the HT for Web Getting Started Manual for details ):
ht.Default.setImage('tplink', 'symbols/TPLink.json');
Set the registered vector image name to the model:
    var node = new ht.Node(),
    node.setImage ('tplink');
    dataModel.add(node);
Even in the latest version of HT , the method of directly calling setImage() and passing in URL parameters without registration is already supported (this method is used in my Demo). This method is more concise, but if many scenarios are applied to the same image, it is recommended that users pass the registered image to avoid modifying the URL multiple times:
node.setImage('symbols/TPLink.json');
Ok, now preview your HTML document in the browser, is there a TPLINK panel?
Finally, how do we make our indicator light flash? For products developed with HT , it is very simple to achieve the flickering effect, because HT is pre-determined that the graphics component has been bound to the Data data in the DataModel by default, and the binding format is also very simple, just use the previous parameter value with a func The object of the attribute can be replaced, see the HT for Web data binding manual ( http://www.hightopo.com/guide/guide/core/databinding/ht-databinding-guide.html ) for details. The blinking of the indicator here is actually the result of the change in the value of the visible property, so we only need to bind the visible property data, as shown below:
    {
          "type": "oval",
          "visible": {
            "func": "attr@visibility1"
          },
          "shadow": true,
          "shadowColor": "rgba(208,240,2,0.35)",
          "background": "rgb(178,184,141)",
          "gradient": "radial.center",
          "gradientColor": "rgb(247,255,0)",
          "rect": [
            79, 53,
            31, 32
          ]
     },
setInterval(function(){
                    node.a('visibility1', !t_node.a('visibility1'));
}, 400);
At this point, you have successfully completed the production of a TPLINK panel (~ . ~), of course, there is still the production of the server, which will not be repeated here. The complex TPLINK panel has been completed. Is the server still far away?
2. Connection
You have also noticed that there are two connections in our Demo. How should the connections be made?
HT provides straight and multi-point connections by default, but more connection types are required for applications such as drawing flowcharts, organizational charts, and mind maps. For details, please click the HT for Web Connection Type Manual ( http:// www.hightopo.com/guide/guide/plugin/edgetype/ht-edgetype-guide.html ).
In our Demo, the two curves connecting the server and TP-LINK use a new custom connection type.
The ht.Default.setEdgeType(type, func, mutual) function can be used to customize the connection type:
in:
type: the connection type of string type, corresponding to the edge.type property of style;
fuc: function type, returns the direction information of the trace according to the incoming parameters (edge, gap, graphView, sameSourceWithFirstEdge);
edge: the current connection object;
gap: When multiple connections are bundled, the distance between the stupid connection object corresponding to the center connection;
graphView: the current corresponding topology component object;
sameSourceWithFirstEdge: boolean type, whether the connection has the same origin with the same connection in the same group;
The return value is {points: new ht.List(...), segments: new ht.List(...)} structure of the connection direction information, the value of segments is the same as above;
mutual: This parameter determines whether the connection affects all connections on the start or end node. The default value of false means that only connections in the EdgeGroup with the same source and target are affected.
When implementing it, we need to re-introduce:
<script src='ht-edgetype.js'></script>
Then call the ht.Default.setEdgeType(type, func, mutual) function, the code is as follows:
    ht.Default.setEdgeType('line', function(edge){
                        var sourcePoint = edge.getSourceAgent().getPosition(),
                            targetPoint = edge.getTargetAgent().getPosition(),
                            points = new ht.List();
                            points.add(sourcePoint);
                            points.add({
                                x: (sourcePoint.x + targetPoint.x)/2,
                                y: (sourcePoint.y + targetPoint.y)/2 + 300
                            });
                            points.add(targetPoint);

                        return {
                            points: points,
                            segments: new ht.List([1, 3])
                        };
    });
When creating a new connection, note that the connection type edge.type is our custom connection type 'line':
    var edge = new ht.Edge();
    edge.setSource (startNode);
    edge.setTarget(endNode);
    edge.setLayer ('edgeLayer');
    edge.s({
           'edge.type': 'line',
           'edge.color': '#0A3791',
           'edge.width': 8,
           'edge.center': true
           });
    dataModel.add(edge);
At this point, the connection has been basically completed. Another point is that you may not be very familiar with the setLayer() method. In fact, this method is used to set the level of the connection and primitives, because the default level is that the edge is under the node, so After you need to set the layers, call the graphView's setLayers method to change the relationship between the layers:
graphView.setLayers (['nodeLayer', 'edgeLayer']);
If you still have questions about the custom connection type, you can click on the example ( http://www.hightopo.com/guide/guide/plugin/edgetype/examples/example_custom.html ) to learn more.
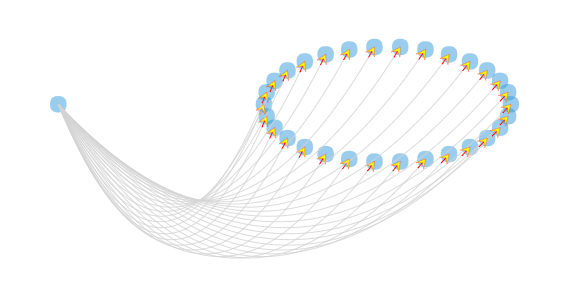
3. Flow
Let's take a look at the cool effect of flow in HT products (poke the address ( http://www.hightopo.com/guide/guide/plugin/flow/examples/example_demo1.html ) for details):
In my demo, the two connections apply different ways of flow, but both ways require the ht.flow plugin. This plugin extends the style control flow effect on the ht.Shape and ht.Edge types. Users can manipulate these styles through ht.Shape.setStyle() and ht.Edge.setStyle(). The following briefly introduces several styles:
1. The flow value is true and false, which controls whether the ht.Shape and ht.Edge can flow, the default is false;
2. flow.count, controls the number of flow groups, the default is 1;
3. flow.step, control the step of flow, the default is 3;
4. flow.element.image, string type, specifies the image of the flow group element. The image must be registered in advance through ht.Default.setImage();
....
Wait, there are many styles for you to play, please stamp the address for details ( http://www.hightopo.com/guide/guide/plugin/flow/ht-flow-guide.html );
The flow effect plug-in must be introduced here:
<script src="js/ht-flow.js"></script>
Here, we first register the flowing pictures in advance:
ht.Default.setImage('arrow', 'symbols/arrow.json');
In the first method, set the flow-related properties directly on the edge of the connection (don't forget to call the API that starts the flow after you are done), and set the flow here by setting the flow.element.image property value to 'arrow' picture of:
    edge.setStyle({
        'edge.type': 'line',
        'edge.color': '#0A3791',
        'edge.width': 8,
        'edge.center': true,
        'flow': true,
        'flow.element.image': 'arrow',
        'flow.element.count': 1,
        'flow.element.max': 30,
        'flow.element.autorotate': true
    });
    raphView.enableFlow(40);//Start the flow;
Refresh the page, the arrow flows on the edge! Some people may still ask "what if my flow group element is not a picture, but a primitive?", yes, this is the second way!
The second way is for the case where the flow element group is a primitive:
    var flowNode = new ht.Node();
    flowNode.setImage('arrow');
Because the flow is actually that the position of the primitive changes over time, we can change the position of the primitive to control its flow, and calculate the length of the flow line by calling the ready-made API of the flow plugin - -calculateLength, Then change the current step percentage currentPercentage, the specific implementation is as follows:
    graphView.validate();//Refresh;
    var length = graphView.calculateLength(edge),//Length of flow line;
        step = 4, //Step unit pixel;
        stepPercentage = step / length * 100, // step percentage;
        currentPercentage = 0; //Current step percentage;

    setInterval(function(){
        var pos = graphView.getPercentPosition(edge, currentPercentage);//The second parameter is the percentage, ranging from 0 to 100;
        flowNode.setPosition(pos.x, pos.y);//Change the position of the flow node;
        currentPercentage += stepPercentage;
        if (currentPercentage > 100) currentPercentage = 0;
    }, 400);
After doing this, refresh the page, why is there still no flow effect?
In fact, there is a pit here, that is, graphView.validate() must be called before calculating the length. Why? In order to improve efficiency, graphView is not refreshed in real time, but is refreshed uniformly after multiple primitives are changed, so the function of graphView.validate() here is to refresh graphView.
Finally, the source code of Demo is attached ( http://www.hightopo.com/demo/blog_tplink_20170511/index.html ), I hope you can give me some advice.