The top command is often used to monitor the system status of Linux, such as the use of cpu and memory. Programmers basically know this command, but it is strange that very few people can use it well. For example, the meaning of the memory value in the top monitoring view There are many misinterpretations.
This article describes the meaning of various data in the top view through a top monitoring screenshot of a running WEB server, and also includes the sorting of the fields of each process (task) in the view.
top enter view

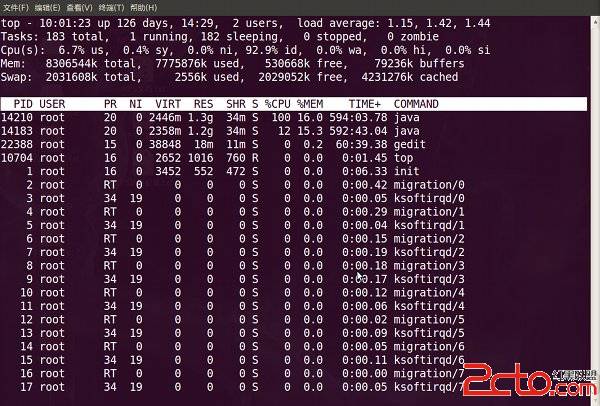
top view 01
[top view 01] is the basic view that just entered the top. Let's combine this view to explain the meaning of each data.
The first line:
10:01:23 The current system time is
126 days, 14:29 The system has been running for 126 days, 14 hours and 29 minutes (without restarting during this period)
2 users There are currently 2 users logged in to the system
load average: 1.15, The three numbers behind the 1.42, 1.44 load average are the load conditions of 1 minute, 5 minutes, and 15 minutes, respectively.
The load average data is to check the number of active processes every 5 seconds, and then calculate the value according to a specific algorithm. If this number is divided by the number of logical CPUs, a result above 5 indicates that the system is overloaded.
The second line:
Tasks task (process), the system now has a total of 183 processes, of which 1 is running, 182 are sleeping (sleep), 0 are in the stopped state, and 0 are in the zombie state (zombie). .
The third line: cpu status
6.7% us The percentage of CPU occupied by user space.
0.4% sy The percentage of CPU used by the kernel space.
0.0% ni Percentage of CPU occupied by processes that have changed priority
92.9% id Percentage of idle CPU
0.0% wa Percentage of CPU occupied by IO waiting
0.0% hi Percentage of CPU occupied by hardware IRQs
0.0% si Soft interrupts (Software Interrupts) percentage of CPU
The CPU usage ratio here is different from the windows concept. If you don't understand user space and kernel space, you need to charge.
The fourth line: memory status
8306544k total physical memory (8GB)
7775876k used memory in use (7.7GB)
530668k free total free memory (530M)
79236k buffers cache memory (79M)
The fifth line: swap swap partition
2031608k total total swap area (2GB)
2556k used total used swap area (2.5M)
2029052k free total free swap area (2GB)
4231276k cached buffered total swap area (4GB)
What I want to explain here is that these data cannot be understood with the concept of windows memory. If the server is in danger in the way of windows: the total amount of memory of 8G is only 530M of available memory. The memory management of Linux has its particularity, and the complexity needs a book to explain, here is just a brief point of difference from our traditional concept ( windows ).
The total amount of memory in use (used) in the fourth line refers to the amount of memory currently controlled by the system kernel, and the total amount of free memory (free) is the amount that the kernel has not yet brought under its control. The memory managed by the kernel is not necessarily in use, and it also includes the memory that has been used in the past and can now be reused. The kernel does not return these reusable memory to free, so free memory on linux will be Less and less, but don't worry about it.
If you calculate the amount of available memory out of habit, here is an approximate calculation formula: free in the fourth line + buffers in the fourth line + cached in the fifth line, according to this formula, the available memory of this server: 530668+79236+4231276 = 4.7GB.
For memory monitoring, in the top, we need to monitor the used of the swap partition of the fifth row at all times. If this value is constantly changing, it means that the kernel is constantly exchanging data between memory and swap, which is the real memory is not enough.
The sixth line is blank
Below the seventh line: status monitoring of each process (task)
PID process id
USER process owner
PR process priority
NI nice value. Negative values indicate high priority, and positive values indicate
the total amount of virtual memory used by low-priority VIRT processes, in kilobytes. VIRT=SWAP+RES
The size of the physical memory used by the RES process but not swapped out, in kb. RES=CODE+DATA
SHR Shared memory size, unit kb
S Process status. D=uninterruptible sleep state R=running S=sleep T=tracking/stopping Z=zombie process
%CPU CPU time percentage from the last update to the present
%MEM percentage of physical memory used by the
process TIME+ total CPU time used by the process, Unit 1/100 seconds
COMMAND process name (command name/command line)
Multi-U multi-core CPU monitoring
In the top basic view, press the number 1 on the keyboard to monitor the status of each logical CPU:

top view 02
Looking at the diagram above, the server has 16 logical CPUs, which are actually 4 physical CPUs.
Process field sorting
When entering the top by default, the processes are sorted according to the CPU usage. In [top view 01], the java process with process ID 14210 is ranked first (CPU occupancy is 100%), and the java process with process ID 14183 is ranked first. In the second (12% cpu usage). You can change the sorting field through keyboard commands. For example, if you want to monitor which process occupies the most MEM, my general usage is as follows:
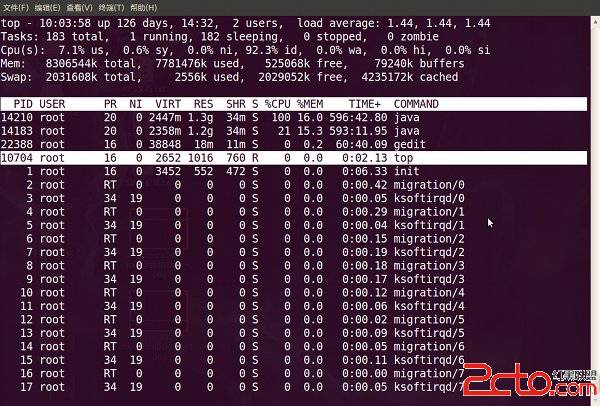
1. Press the keyboard b (to turn on/off the highlighting effect), the top view changes as follows:

top view 03
We found that the top process whose process id is 10704 is highlighted. The top process is the only running process displayed in the second line of the view. You can close or open the highlighting effect of the running process by pressing the y key. .
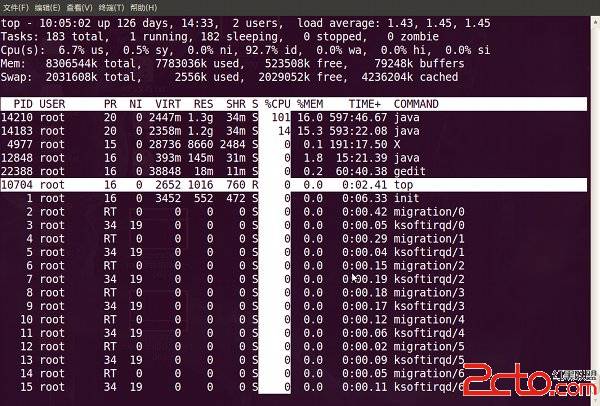
2. Press the keyboard x (to turn on/off the highlighting effect of the sorting column), the top view changes as follows:

top view 04
As you can see, the default sort column for top is %CPU.
3. The sorting sequence can be changed to the right or left by shift + > or shift + <. The following picture is the effect of pressing shift + > once:

top view 05
Views are now sorted by %MEM.
Change the progress display field
1. Hit the f key, top enters another view, where you can arrange the display fields in the basic view:

top view 06
All process fields that can be displayed in the top basic view are listed here. Fields marked with * and uppercase letters are displayable, and fields without * and lowercase letters are not displayed. If you want to display the CODE and DATA fields in the basic view, you can hit the r and s keys:

top view 07
2. Press Enter to return to the basic view, you can see two more fields: CODE and DATA:

top view 08
Supplement to top command
The top command is the preferred command for system monitoring on Linux, but sometimes it fails to meet our requirements. For example, the current server, top monitoring has great limitations. This server runs a websphere cluster and has two node services, namely the eldest and second java processes in [top view 01]. The smallest unit of monitoring of the top command is the process, so I can't see the number of java threads I care about. And the number of customer connections, and these two indicators are very important indicators of java web services, usually I use the ps and netstate commands to supplement the lack of top.
Monitor the number of java threads:
ps -eLf | grep java | wc -l
Monitor network client connections:
netstat -n | grep tcp | grep listening port | wc -l
The above two commands can change the parameters of grep to achieve more detailed monitoring requirements.
Under the guidance of the idea that everything is a file in the Linux system, the running status of all processes can be obtained by using files. In the system root directory /proc, the name of each digital subdirectory is the PID of the running process. Entering any process directory, you can observe various running indicators of the process through the files or directories in it. For example, the task directory is used to Describes the threads in the process, so you can also get the number of threads running in a process by the following method (PID refers to the process ID):
ls /proc/PID/task | wc -l
There is also a command pmap in linux to output the status of the process memory, which can be used to analyze the thread stack:
pmap PID