Article Directory
1. Brief description
topCommand is used to display Linux process.
Syntax format:
top -hv|-bcHiOSs -d secs -n max -u|U user -p pid -o fld -w [cols]
2. Display interface
topBy default, the command 3refreshes the display after a specific interval ( seconds). To refresh manually, the user can enter a carriage return or a space.
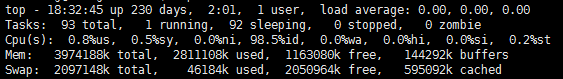
top - 18:32:45 up 230 days,  2:01,  1 user,  load average: 0.00, 0.00, 0.00
Tasks:  93 total,   1 running,  92 sleeping,   0 stopped,   0 zombie
Cpu(s):  0.8%us,  0.5%sy,  0.0%ni, 98.5%id,  0.0%wa,  0.0%hi,  0.0%si,  0.2%st
Mem:   3974188k total,  2811108k used,  1163080k free,   144292k buffers
Swap:  2097148k total,    46184k used,  2050964k free,   595092k cached

  PID USER      PR  NI  VIRT  RES  SHR S %CPU %MEM    TIME+  COMMAND
 4478 root      20   0 3760m 669m 7808 S  1.3 17.2 195:53.36 java
 7488 root      20   0 4799m 1.0g  13m S  1.0 26.0  30:55.04 java
25690 root      20   0 3428m  95m 5104 S  0.7  2.5   2156:22 java
24582 bo.wang   20   0 15024 1304 1004 R  0.3  0.0   0:00.15 top
25741 root      20   0 3432m 109m 3404 S  0.3  2.8   2482:59 java
    1 root      20   0 19232  220   84 S  0.0  0.0   0:01.07 init
    2 root      20   0     0    0    0 S  0.0  0.0   0:00.00 kthreadd
    3 root      RT   0     0    0    0 S  0.0  0.0   1:06.49 migration/0
    4 root      20   0     0    0    0 S  0.0  0.0   6:10.11 ksoftirqd/0
    5 root      RT   0     0    0    0 S  0.0  0.0   0:00.00 stopper/0
    6 root      RT   0     0    0    0 S  0.0  0.0   0:49.52 watchdog/0
    7 root      RT   0     0    0    0 S  0.0  0.0   1:14.84 migration/1
    8 root      RT   0     0    0    0 S  0.0  0.0   0:00.00 stopper/1
    9 root      20   0     0    0    0 S  0.0  0.0   5:03.11 ksoftirqd/1
   10 root      RT   0     0    0    0 S  0.0  0.0   0:43.21 watchdog/1
   11 root      20   0     0    0    0 S  0.0  0.0  25:15.13 events/0
   12 root      20   0     0    0    0 S  0.0  0.0  27:57.65 events/1
   13 root      20   0     0    0    0 S  0.0  0.0   0:00.00 events/0
   14 root      20   0     0    0    0 S  0.0  0.0   0:00.00 events/1
   15 root      20   0     0    0    0 S  0.0  0.0   0:00.00 events_long/0
   16 root      20   0     0    0    0 S  0.0  0.0   0:00.00 events_long/1
   17 root      20   0     0    0    0 S  0.0  0.0   0:00.00 events_power_ef
   18 root      20   0     0    0    0 S  0.0  0.0   0:00.00 events_power_ef
The first five lines show statistical information:
2.1. The first line: task queue information
top - 18:32:45 up 230 days, 2:01, 1 user, load average: 0.00, 0.00, 0.00
The same uptimeas the execution result of the uptimecommand , the command execution result:
[bo.wang@l-zcgtest1 ~]$ uptime
 18:45:02 up 230 days,  2:14,  1 user,  load average: 0.00, 0.00, 0.00
18:45:02:current time.up 230 days, 2:14,: The time of continuous operation of the system.1 user,: The number of currently logged in users.load average: 0.00, 0.00, 0.00: System load, that is, the average length of the task queue. The three values are the average values from 1 minute, 5 minutes, and 15 minutes ago to the current moment.
2.2. The second line: process information data
Tasks: 93 total, 1 running, 92 sleeping, 0 stopped, 0 zombie
total: The total number of processes.running: The number of running processes.sleeping: The number of sleeping processes.stopped: The number of stopped processes.zombie: The number of zombie processes.
2.3. The third line: CPU information data
Cpu(s): 0.8%us, 0.5%sy, 0.0%ni, 98.5%id, 0.0%wa, 0.0%hi, 0.0%si, 0.2%st
0.8%us: The percentage of CPU occupied by user processes.0.5%sy: Percentage of CPU occupied by kernel (system) processes.0.0%ni: The percentage of CPU occupied by processes whose priority has been changed in the user process space.98.5%id: The percentage of free CPU.0.0%wa: Percentage of CPU time waiting for input and output.0.0%hi:Hardware CPU interrupt occupancy percentage.0.0%si: Percentage occupied by soft interrupts.0.2%st: Percentage occupied by the virtual machine.
2.4. The fourth line: memory information data
Mem: 3974188k total, 2811108k used, 1163080k free, 144292k buffers
total: The total amount of physical memory.used: The total amount of physical memory used.free: The total amount of free memory.buffers: The amount of memory used as the kernel cache.
2.5. The fifth line: exchange area information data
Swap: 2097148k total, 46184k used, 2050964k free, 595092k cached
total: Total exchange area.used: The total amount of exchange area used.free: Total amount of free exchange area.cached: The total amount of buffered exchange area.
2.6. Below the sixth line is the statistical information area
There are the following columns:
PID USER PR NI VIRT RES SHR S %CPU %MEM TIME+ COMMAND
The meaning of each column is as follows:
| Serial number | Column name | meaning |
|---|---|---|
| a | PID |
Process id |
| b | PPID | Parent process id |
| c | RUSER | User's real name |
| d | UID | The user id of the process owner |
| e | USER |
The user name of the process owner |
| f | GROUP | The group name of the process owner |
| g | TTY | The name of the terminal that started the process. Processes that are not started from the terminal are displayed as? |
| h | PR |
priority |
| i | NI |
nicevalue. Negative value indicates high priority, positive value indicates low priority |
| j | P | The last CPU used is only meaningful in a multi-CPU environment |
| k | %CPU |
Percentage of CPU time from the last update to the present |
| l | TIME | The total CPU time used by the process, in seconds |
| m | TIME+ |
The total CPU time used by the process, in 1/100seconds |
| n | %MEM |
Percentage of physical memory used by the process |
| O | VIRT |
Virtual Memory. The total amount of virtual memory used by the process, unit kb, VIRT=SWAP+RES |
| p | SWAP | The size of the virtual memory used by the process to be swapped out, in unitskb |
| q | RES |
Permanent memory. The size of physical memory used by the process and not swapped out, unit kb, RES=CODE+DATA |
| r | CODE | Physical memory size occupied by executable code, unitkb |
| s | DATA | The size of physical memory occupied by parts other than executable code (data segment + stack), unitkb |
| t | SHR |
Shared memory, unitkb |
| u | nFLT | Page faults |
| v | nDRT | The number of pages that have been modified since the last write |
| w | S |
Process state (D=uninterruptible sleep state, R=run, S=sleep, T=track/stop, Z=zombie process) |
| x | COMMAND |
Command name/command line |
| and | WCHAN | If the process is sleeping, display the name of the system function in sleep |
| from | Flags | Task logo, refer to sched.h |
Note: By default, only the important PID, USER, PR, NI, VIRT, RES, SHR, S, %CPU, %MEM, TIME+, COMMAND columns are displayed. You can use the shortcut keys below to change the display content.
3. How to use
topThere are two ways to use the tool:
- Command line plus options. The syntax format:
top[option] topUse of built-in commands or interactive commands of the tool.
3.1. Command line options
| Options | meaning |
|---|---|
| -d n | Specify the time interval between every two screen information refreshes. n is the specific number of seconds. |
| -p pid | By specifying the monitoring process ID to monitor only the status of a certain process. pid is the specific process ID. If there are multiple processes, as long as $ top -p pid1,pid2,pid3 |
| -q | This option will make top refresh without any delay. If the calling program has super user privileges, then top will run with the highest possible priority. |
| -S | Specify accumulation mode |
| -s | Make the top command run in safe mode. This will remove the potential dangers caused by interactive commands |
| -i | Make the top interface not display any idle or dead processes. Show only running threads |
| -c | The COMMAND option displays the entire command line instead of just the command name |
| -b | top 显示的时候,将每一次显示的结果都打印出来,不会将上一次的结果给冲掉 |
| -u username | 显示某个用户的进程信息,username 为具体用户名,比如 root |
| -H | 显示线程的信息,不显示进程信息 |
3.2. 交互式命令
| 命令 | 含义 |
|---|---|
| A | 根据单窗口切换成多窗口,可以看到四个不同的窗口,可以通过 a 或者 w 来切换多个窗口。四个窗口的名字分别为:Def,Job,Mem,Usr |
| f | 进入一个动态配置 top 的界面中,按 a-z 即可显示或隐藏指定的列,按 Esc 或 Enter 都可保存并退回到 top 信息 |
| o | 进入一个动态配置 top 的界面中, 可以改变列的显示顺序,按小写的 a-z 可以将相应的列向右移动,而大写的 A-Z 可以将相应的列向左移动。按 Esc 或 Enter 都可保存并退回到 top 信息 |
| R | top 界面第一列数据进行倒序排列 |
| k | 终止一个进程。系统将提示用户输入需要终止的进程 PID,以及需要发送给该进程什么样的信号。一般的终止进程可以使用 15 信号;如果不能正常结束那就使用信号 9 强制结束该进程。默认值是信号15。在安全模式中此命令被屏蔽 |
| i | 隐藏闲置和僵死进程。这是一个开关式命令 |
q |
退出 top 程序,Ctrl + C 也可以退出 |
| S | 切换到累计模式 |
| s | 改变两次刷新之间的延迟时间。系统将提示用户输入新的时间,单位为 s。如果有小数,就换算成 ms。输入 0 值则系统将不断刷新,默认值是 5 s。需要注意的是如果设置太小的时间,很可能会引起不断刷新,从而根本来不及看清显示的情况,而且系统负载也会大大增加 |
| r | 重新安排一个进程的优先级别。系统提示用户输入需要改变的进程 PID 以及需要设置的进程优先级值。输入一个正值将使优先级降低,反之则可以使该进程拥有更高的优先权。默认值是 10 |
| l | 切换显示平均负载和启动时间信息。即显示隐藏第一行 |
| m | 切换显示内存信息。即显示隐藏内存行 |
| t | 切换显示进程和 CPU 状态信息。即显示隐藏 CPU 行 |
c |
切换显示命令名称和完整命令行。 显示完整的命令。 这个功能很有用 |
M |
Sort from largest to smallest according to the resident memory size RES |
P |
Sort from high to bottom according to the percentage of CPU usage %CPU |
T |
Sort from most to least according to time/accumulated time TIME+ |
| W | Write the current settings into the ~/.toprc file. This is the recommended way to write top configuration files |
| h or? | Display the help screen, give some brief command summary instructions, press Esc or Enter to return to the top information |
1 |
Display multi-core CPU information on the third line |