This article is prohibited from being reproduced by anyone!
Introduction to sviewgui
sviewgui is a PyQt based GUI for data visualization of csv files or Pandas DataFrames. This GUI is based on matplotlib and you can visualize your csv files in several ways. main feature:
- Ⅰ Scatter, line, density, histogram and boxplot types;
- Ⅱ Marker size, line width, number of bins in histogram, setting of color map (from cmocean);
- Ⅲ Save the diagram as an editable PDF;
- IV the code for drawing graphics is available so that it can be reused and modified outside of sviewgui;
This package is super easy to use, it has only one method: buildGUI(). This method can be passed zero or one parameter. You can use the file path of the csv file as an argument, or a pandas DataFrame object as an argument. Similar code is written as follows:
# 第一种形式
import sviewgui.sview as sv
sv.buildGUI()

# 第二种形式
import sviewgui.sview as sv
FILE_PATH = "User/Documents/yourdata.csv"
sv.buildGUI(FILE_PATH)

# 第三种形式
import sviewgui.sview as sv
import pandas as pd

FILE_PATH = "User/Documents/yourdata.csv"
df = pd.read_csv(FILE_PATH)
sv.buildGUI(df)
The above code is just used to help us open this GUI visualization interface.
Finally, it is emphasized that since this library is based on matplotlib visualization, the seaborn style also applies here, because seaborn is also based on matplotlib visualization.
sviewgui install
This library has quite a lot of dependent libraries, so you can directly use the following line of code to install the sviewgui library.
pip install sviewgui -i https://pypi.tuna.tsinghua.edu.cn/simple/ --ignore-installed
The latter --ignore-installed, I didn't add it at first, but reported an error, the general error is as follows:
ERROR: Cannot uninstall 'certifi'. It is a distutils installed project and thus we cannot
accurately determine which files belong to it which would lead to only a partial uninstall.
You can just add this, don't worry about why, because I don't know either!
sviewgui use
Above, I have introduced 3 kinds of codes for opening GUI graphical interface windows. Only the following method is introduced here:
import sviewgui.sview as sv
sv.buildGUI()
The screenshot is as follows:
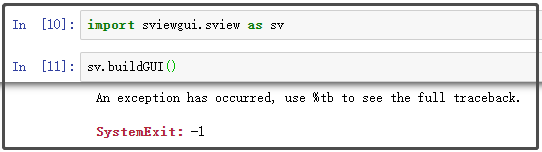
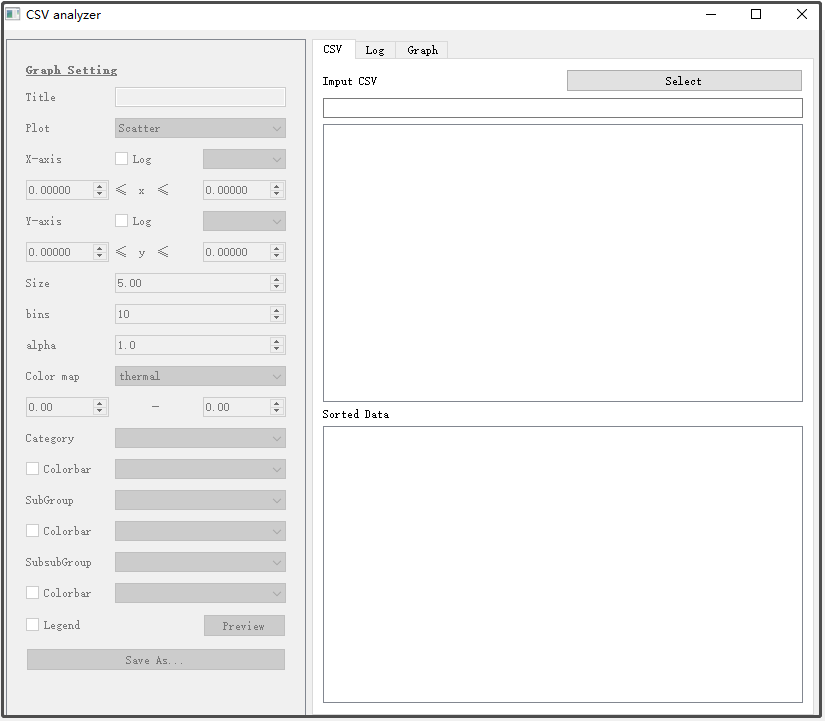
When you enter the above code on the command line, it will drive the background to open the graphical interface window. The initialization state is roughly as follows:
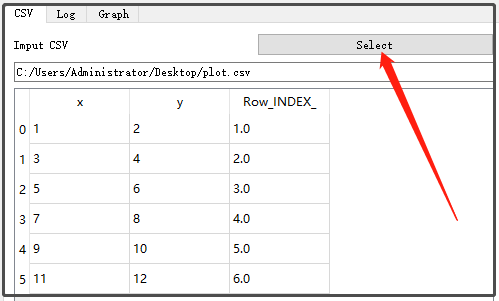
Click the above select to select the data source:
Then we can click on the left 菜单栏to generate the corresponding graph . But there is one thing, it seems that Chinese is not supported! ! !
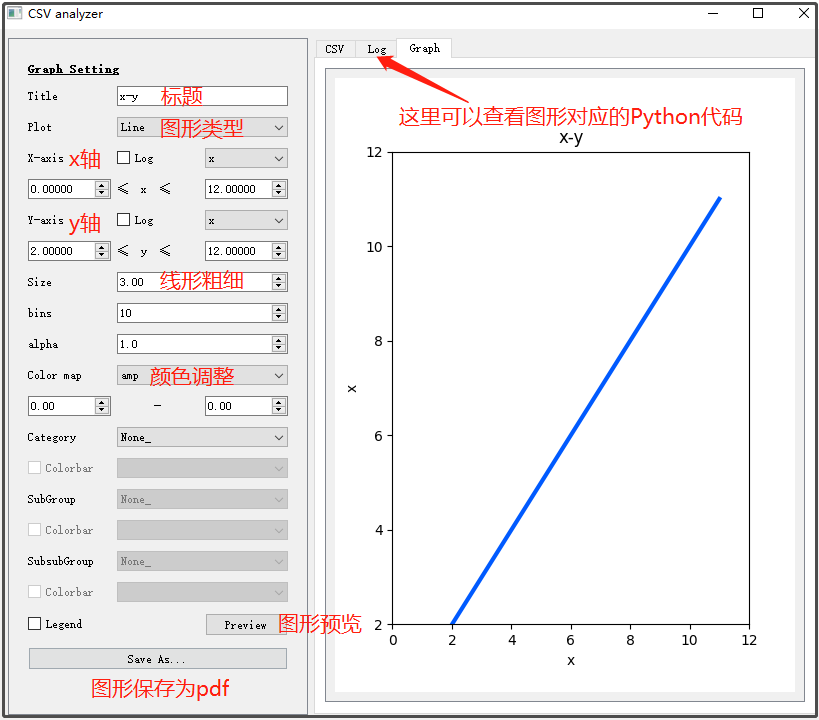
If you feel that the parameters here are not enough to perfect the graph you want, you can copy the Python code corresponding to the graph and simply modify it.
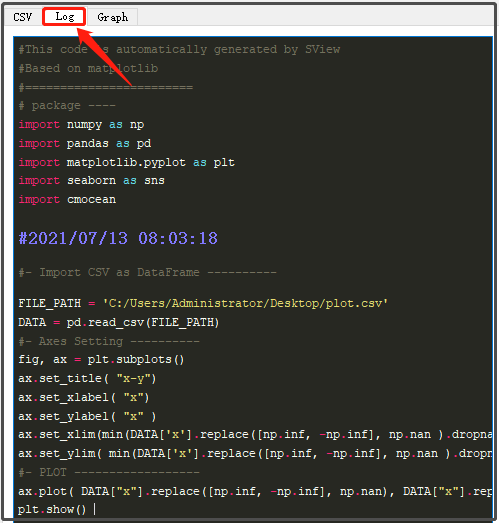
Then, you can take the following code and simply modify it to generate beautiful Matplotlib graphics.
import numpy as np
import pandas as pd
import matplotlib.pyplot as plt
import seaborn as sns
import cmocean

#2021/07/13 08:03:18
#- Import CSV as DataFrame ----------
FILE_PATH = 'C:/Users/Administrator/Desktop/plot.csv'
DATA = pd.read_csv(FILE_PATH)
#- Axes Setting ----------
fig, ax = plt.subplots()
ax.set_title( "x-y")
ax.set_xlabel( "x")
ax.set_ylabel( "x" )
ax.set_xlim(min(DATA['x'].replace([np.inf, -np.inf], np.nan ).dropna() ) - abs( min(DATA['x'].replace([np.inf, -np.inf], np.nan ).dropna() )/10), max(DATA['x'].replace([np.inf, -np.inf], np.nan).dropna()) + abs(max(DATA['x'].replace([np.inf, -np.inf], np.nan).dropna())/10)  )
ax.set_ylim( min(DATA['x'].replace([np.inf, -np.inf], np.nan ).dropna() ) - abs( min(DATA['x'].replace([np.inf, -np.inf], np.nan ).dropna() )/10), max(DATA['x'].replace([np.inf, -np.inf], np.nan).dropna()) + abs(max(DATA['x'].replace([np.inf, -np.inf], np.nan).dropna())/10)  )
#- PLOT ------------------
ax.plot( DATA["x"].replace([np.inf, -np.inf], np.nan), DATA["x"].replace([np.inf, -np.inf], np.nan), linewidth = 3.0, alpha =1.0, color = "#005AFF" )
plt.show()