table of Contents
1. Introduction to nGrinder
nGrinderr (version: 3.4.1) is an open source performance testing tool of NAVER (the search engine website of NHN, the largest Internet company in South Korea). It is directly deployed as a web service and supports multi-user use. It has good scalability and customizable plugins.
nGrinder is an application that executes Groovy or Jython test scripts on a series of machines. The internal engine is based on Grinder. nGrinder uses controller and agent to package Grinder's console and agent respectively, and expands a variety of functions to support concurrent testing.
2. Download
Several related teachings are provided, which will not be discussed here.
- nGrinder study notes-introduction and environment setup-https://www.jianshu.com/p/341040363330
- Performance testing tool-Ngrinder installation-https://www.cnblogs.com/dengshihuang/p/8718789.html
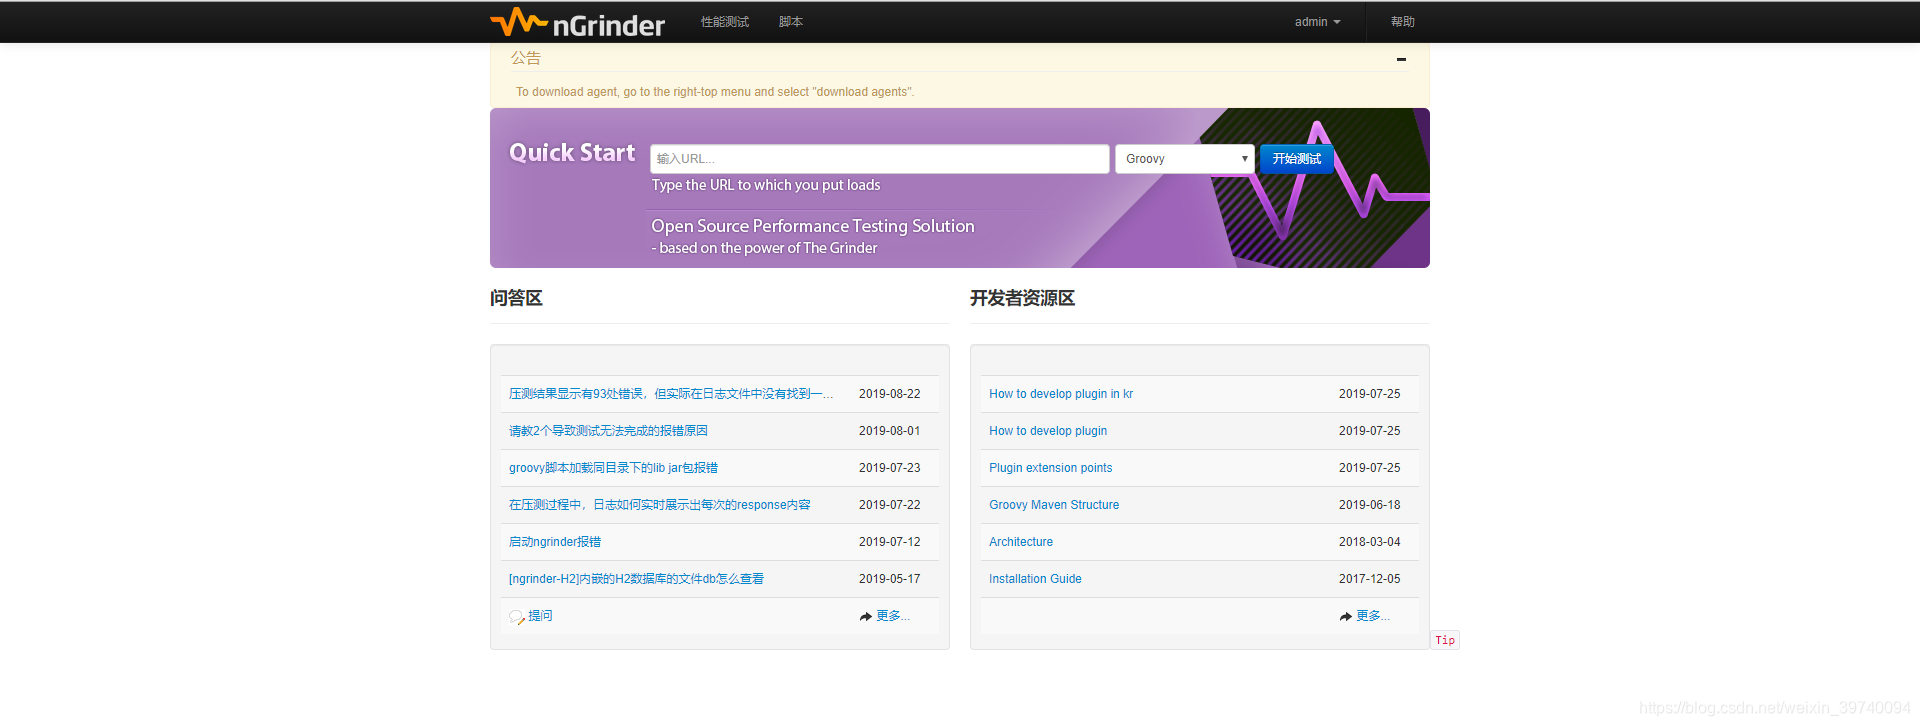
After the download and installation are complete, we can see the main interface of nGrinder as shown below
Three, use
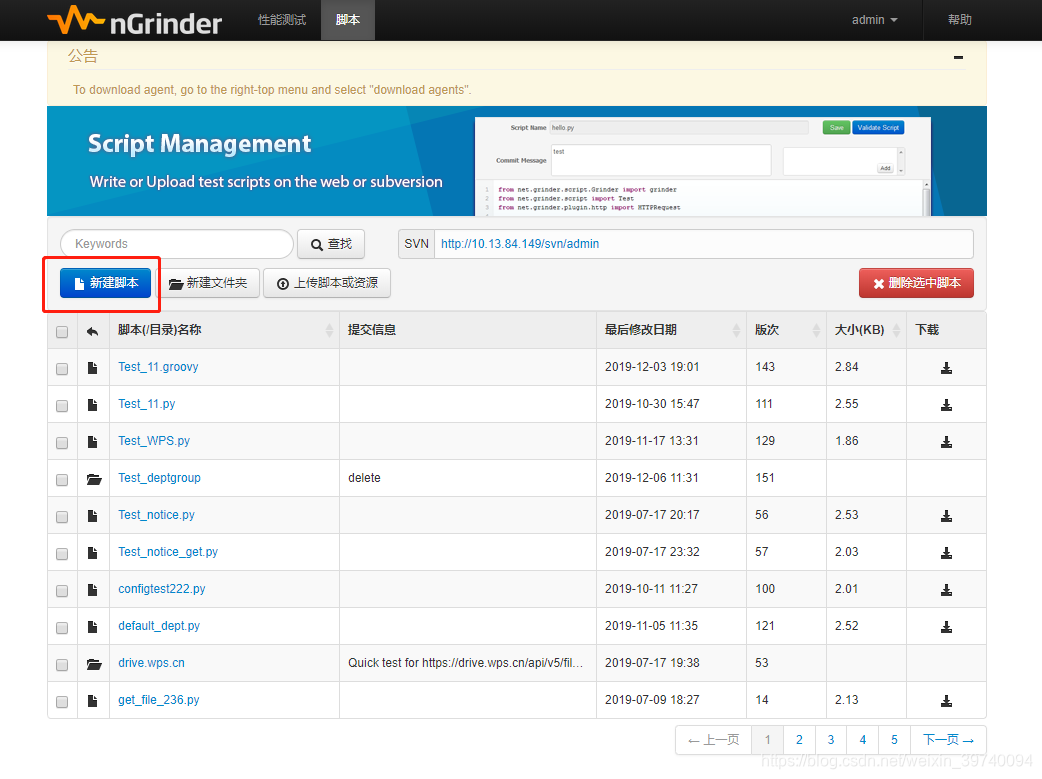
(1) Generate script
1. Click on the script in the menu bar to create a new script
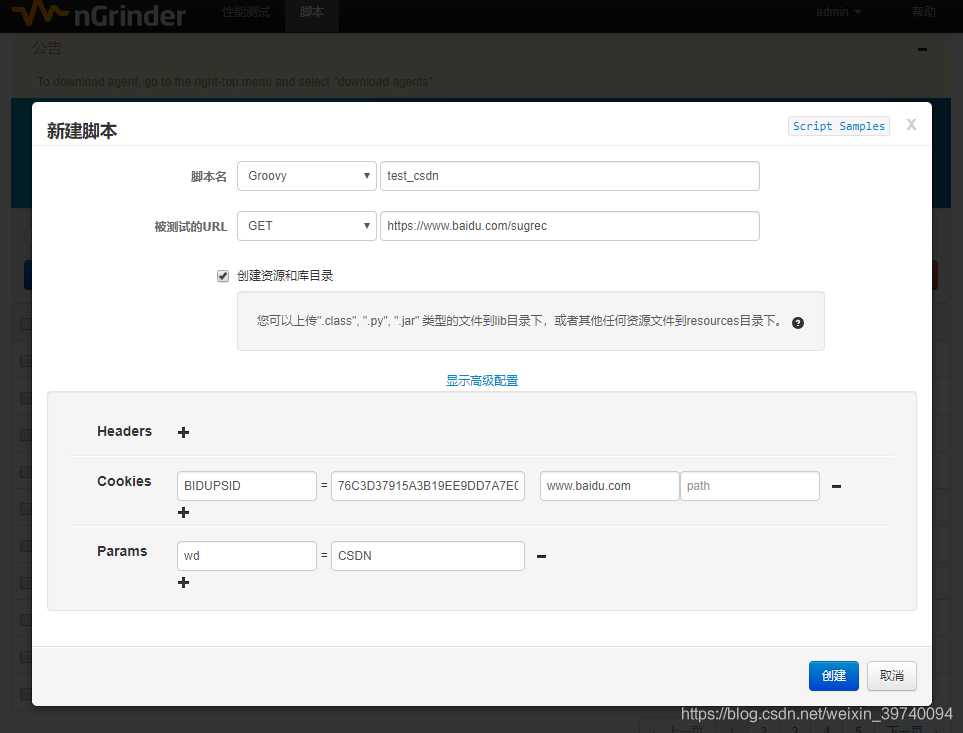
2. Fill in according to the url content
(1) Script name: set a script name that is easy to identify its content
(2) url: set the request type and its url
(3) Headers: fill in the required
header values (4) Cookies: view the cookies of the interface and make it Fill in
(5) Params: Fill in the necessary parameters for the request
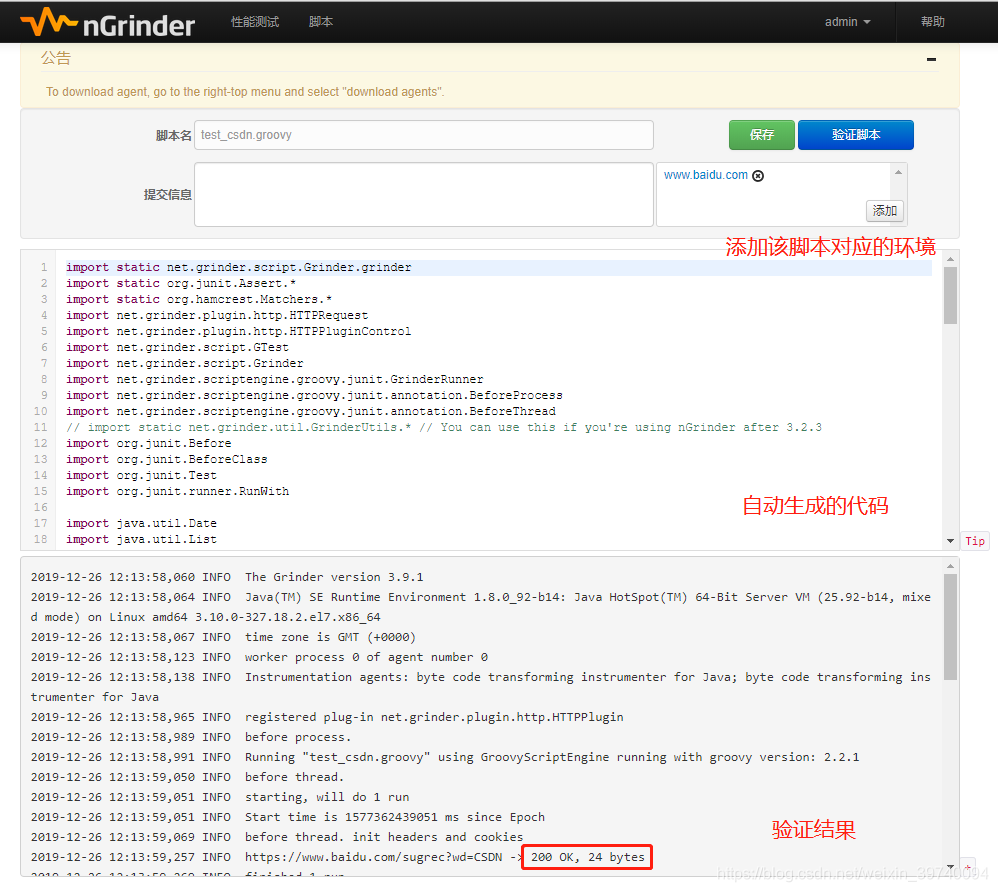
3. Create and verify the script, save it after verification
(2) Execute the script for pressure test
1. Select the script for parameter configuration
(1) Test name: input the name of the stress test
(2) Agent: the maximum value is 1
(3) Number of virtual users/agent: number of processes * number of threads
(4) Number of processes: input the number of processes that you want to perform stress test
(5) Thread number: input the number of threads that you want to perform stress test
(6) Test time: input the time you want to perform stress test
(7) Test times: input the number of stress tests you want to perform
PS: Test time and test times can only be selected as an indicator of the end of the stress test
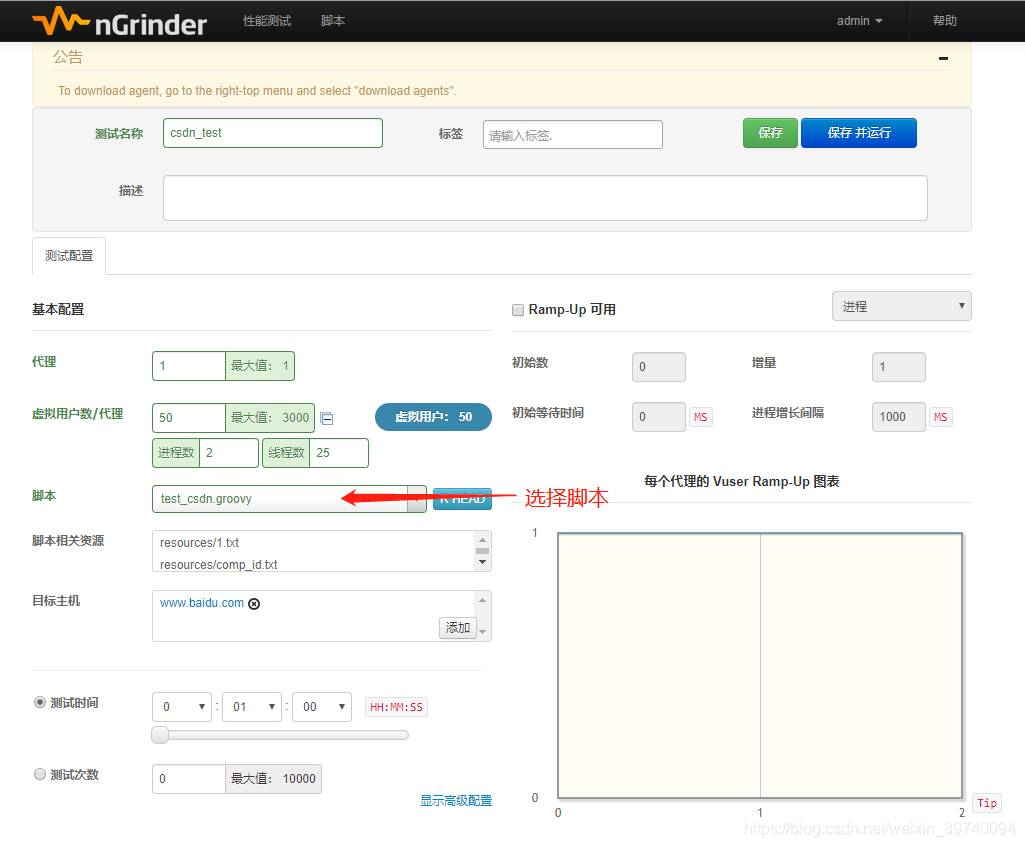
2. After setting the above parameters, click save and run
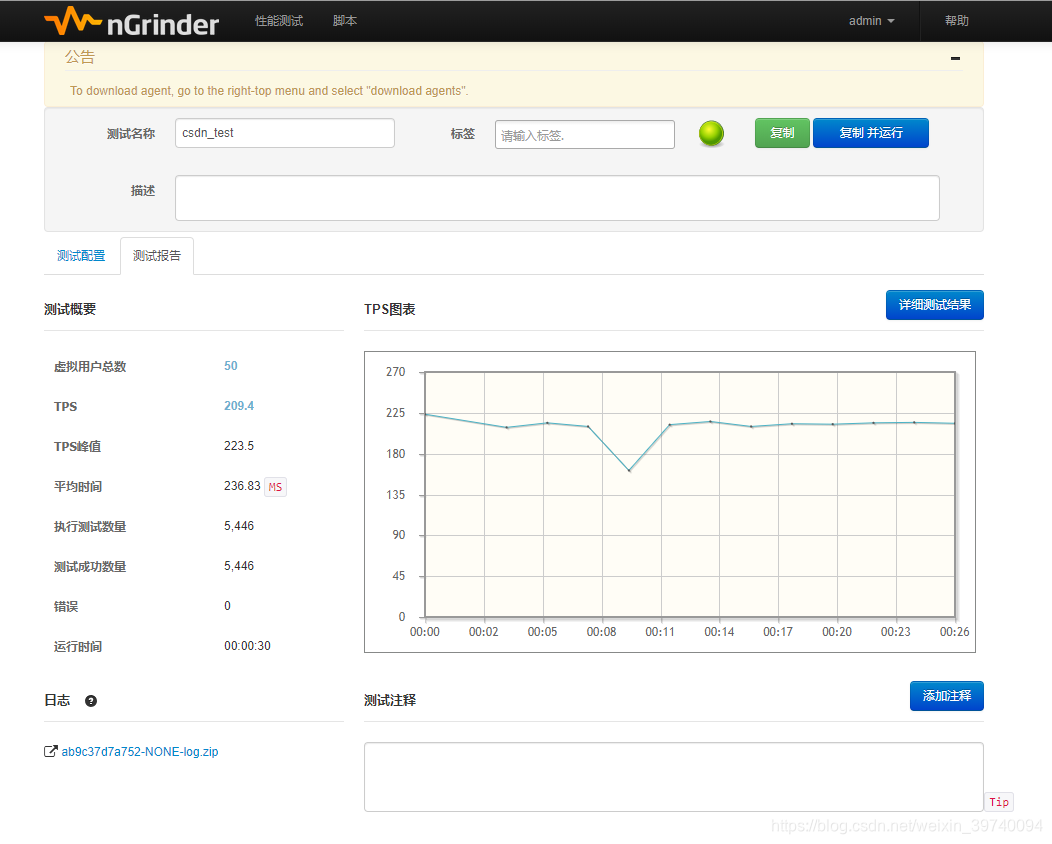
3. Wait for the completion of the pressure test, check the test report and its indicators
(1) Total number of virtual users
(2) TPS
(3) TPS peak
(4) Average time
(5) Number of executed tests & number of successful tests
(6) Error
Four, analysis
(1) TPS: Transaction Per Second (TransactionPerSecond)
A performance indicator that expresses the processing capacity of the system, the number of messages processed per second
- Through the curve of the TPS chart, we can observe the stability of TPS
- Through the test summary, we can get the average value of TPS 209.4 and the peak value of 223.5
- Compare the obtained TPS value with the expected value to see if it meets its performance requirements, if not, it needs to be further optimized
(2) Number of errors
- Determine whether the request of the interface is stable during the stress test process by the presence or absence of the number of errors
(3) Average response time
The time required to process a firm. The smaller the average response time, the faster the processing speed, and the better the efficiency of the software