Website performance stress testing is an indispensable part of the server website performance tuning process. Only when the server is under high pressure can the problems exposed by improper settings such as software and hardware be truly reflected.
The most common performance testing tools are as follows: ab, http_load, webbench, and siege. Today we are going to introduce ab.
ab is a stress test tool that comes with apache. ab is very practical, it can not only perform stress testing on apache servers, but also on other types of servers. Such as nginx, tomcat, IIS, etc.
Let's start to introduce the use of the ab command:
1. The principle of ab
2, the installation of ab
3, ab parameter description
4, ab performance indicators
5. The actual use of ab
6. Test nginx performance
First, the principle of ab
ab is short for apachebench command.
Principle of ab: The ab command will create multiple concurrent access threads to simulate multiple visitors accessing a URL address at the same time. Its test target is based on URL, so it can not only test the load pressure of apache, but also test the pressure of other web servers such as nginx, lighthttp, tomcat, IIS, etc.
The ab command has very low requirements on the computer issuing the load, it is neither very CPU-intensive nor memory-intensive. But it will cause a huge load to the target server, and its principle is similar to CC attack. You also need to pay attention when testing and using it yourself, otherwise it will put too much load at one time. It may cause the target server to run out of resources, and even cause a crash in severe cases.
Second, the installation of ab
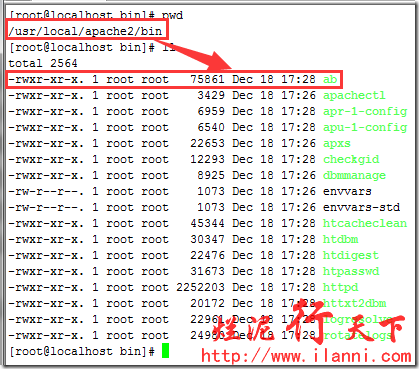
The installation of ab is very simple. If you install apache from source, it will be even simpler. After apache is installed, the ab command is stored in the bin directory of the apache installation directory. as follows:
/usr/local/apache2/bin
If apache is installed through yum's RPM package, the ab command is stored in the /usr/bin directory by default. as follows:
which ab
Note: If you don't want to install apache but want to use the ab command, we can directly install the apache toolkit httpd-tools. as follows:
yum -y install httpd-tools
To check whether ab is installed successfully, you can switch to the above directory and use the ab -V command to check. as follows:
ab -V
If ab is installed successfully, the compatible version of ab will be displayed through the ab -V command, as shown above.
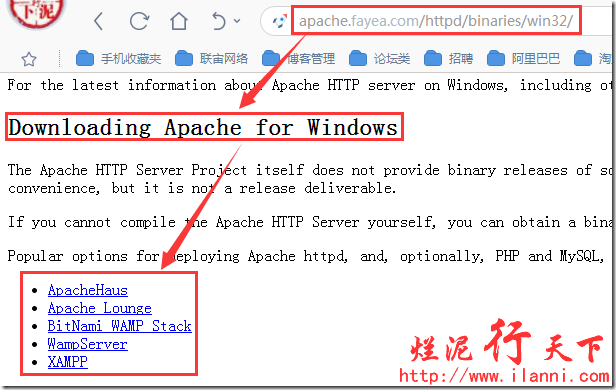
Note that the above is installed on the linux platform. If it is on the windows platform, we can also download the corresponding apache version for installation.
At present, the latest version of apache is 2.4.10, and the apache official website has no version downloaded for windows. But we can download the integration package provided by the apache official website, as follows:
Three, ab parameter description
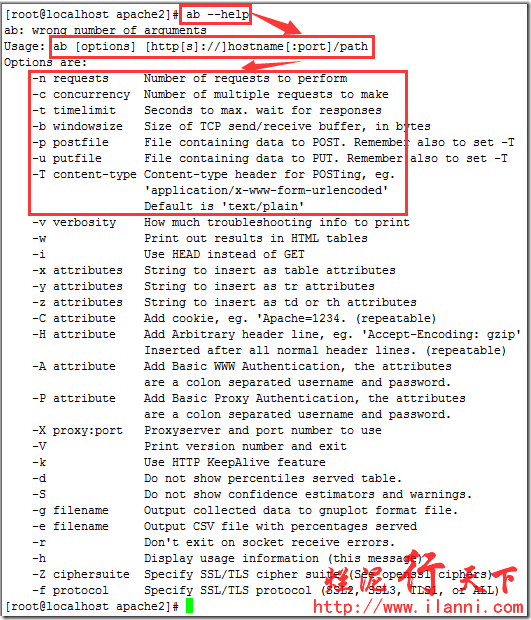
For the use of the ab command, we can view it through the help command. as follows:
ab --help
Below we describe these parameters. as follows:
-n The number of requests to perform in the test session. By default, only one request is performed.
-c The number of requests generated at one time. The default is one at a time.
-t The maximum number of seconds the test will take. Its internal implicit value is -n 50000, which limits testing of the server to a fixed total time. By default, there is no time limit.
-p file containing the data to be POSTed.
-P provides BASIC authentication trust to a relay agent. Username and password are separated by a : and sent in base64 encoded form. This string is sent whether or not the server requires it (i.e., a 401 Authentication Required code was sent).
-T Content-type header information used for POST data.
-v sets the verbosity of the displayed information - a value of 4 or more will display header information, a value of 3 or more will display response codes (404, 200, etc.), and a value of 2 or more will display warnings and other information.
-V displays the version number and exits.
-w outputs results in HTML table format. By default, it is a table with a width of two columns on a white background.
-i does a HEAD request, not a GET.
-x Set the string of the <table> attribute.
-X Use a proxy server for requests.
-y String to set the <tr> attribute.
-z Set the string of the <td> attribute.
-C Append a Cookie: line to the request. Its typical form is a parameter pair name=value, which can be repeated.
-H Append extra headers to the request. The typical form of this parameter is a valid header line containing colon-separated field and value pairs (eg, "Accept-Encoding:zip/zop;8bit").
-A provides BASIC authentication trust to the server. Username and password are separated by a : and sent in base64 encoded form. This string is sent whether or not the server requires it (i.e., a 401 Authentication Required code was sent).
-h shows how to use it.
-d Do not display the "percentage served within XX [ms] table" message (supports previous versions).
-e produces a comma-separated (CSV) file containing the corresponding percentage (in microseconds) of time it took (from 1% to 100%) to process each corresponding percentage of requests. Since this format has been "binarized", it is more useful than the 'gnuplot' format.
-g Write all test results to a 'gnuplot' or TSV (Tab delimited) file. This file can be easily imported into Gnuplot, IDL, Mathematica, Igor and even Excel. The first line of these is the title.
-i does a HEAD request, not a GET.
-k enables the HTTP KeepAlive feature, that is, executing multiple requests in one HTTP session. By default, KeepAlive is not enabled.
-q If the number of requests processed is greater than 150, ab will output a progress count to stderr every time about 10% or 100 requests are processed. This -q flag suppresses these messages.
Fourth, ab performance indicators
In the process of performance testing, several indicators are more important:
1. Throughput (Requests per second)
A quantitative description of the concurrent processing capability of the server, in reqs/s, which refers to the number of requests processed per unit of time under a certain number of concurrent users. The maximum number of requests that can be processed per unit time under a certain number of concurrent users is called the maximum throughput rate.
Remember: Throughput is based on the number of concurrent users. This sentence has two meanings:
a. The throughput rate is related to the number of concurrent users
b. Under different number of concurrent users, the throughput rate is generally different
Calculation formula: the total number of requests / the time it takes to process these requests, i.e.
Request per second=Complete requests/Time taken for tests
It must be noted that this value represents the overall performance of the current machine, and the larger the value, the better.
2. The number of concurrent connections
The number of concurrent connections refers to the number of requests accepted by the server at a certain time. Simply speaking, it is a session.
3. Concurrency Level
Pay attention to the distinction between this concept and the number of concurrent connections. A user may generate multiple sessions at the same time, that is, the number of connections. Under HTTP/1.1, IE7 supports two concurrent connections, IE8 supports 6 concurrent connections, and FireFox3 supports 4 concurrent connections, so accordingly, our number of concurrent users must be divided by this base.
4. User average request waiting time (Time per request)
Calculation formula: time spent processing all requests/(total requests/concurrent users), namely:
Time per request=Time taken for tests/(Complete requests/Concurrency Level)
5. Server average request waiting time (Time per request: across all concurrent requests)
Calculation formula: time spent processing all requests/total requests, namely:
Time taken for/testsComplete requests
As you can see, it is the inverse of throughput.
At the same time, it is also equal to the average request waiting time of users/the number of concurrent users, namely
Time per request/Concurrency Level
Five, ab actual use
There are many command parameters for ab, and we often use the -c and -n parameters.
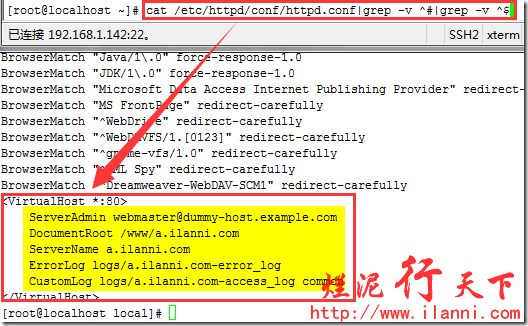
Below we will actually operate, first create a new virtual host a.ilanni.com. as follows:
cat /etc/httpd/conf/httpd.conf|grep -v ^ # | grep -v ^ $
mkdir -p /www/a.ilanni.com
echo '<?php phpinfo();?>'>/www/a.ilanni.com/index.php
cat /www/a.ilanni.com/index.php
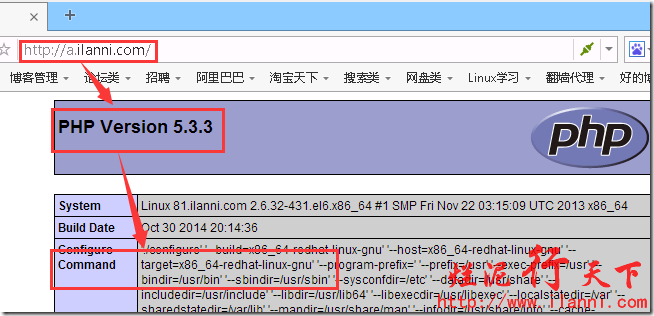
After the virtual host is newly created, let's start apache and visit the virtual host a.ilanni.com. as follows:
wget http://a.ilanni.com
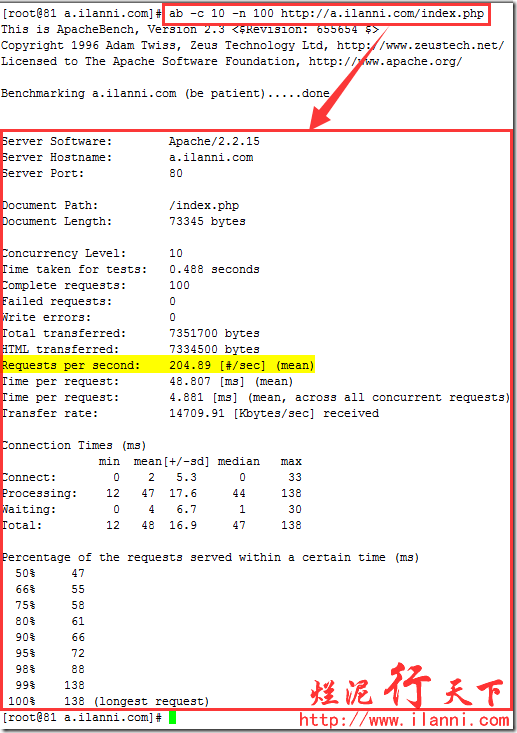
After the virtual host a.ilanni.com is created, we will now test the performance of apache. Use the following command:
ab -c 10 -n 100 http://a.ilanni.com/index.php
-c10 means the number of concurrent users is 10
-n100 means the total number of requests is 100
http://a.ilanni.com/index.php represents the target URL of the request
This line means to process 100 requests at the same time and run the index.php file 10 times.
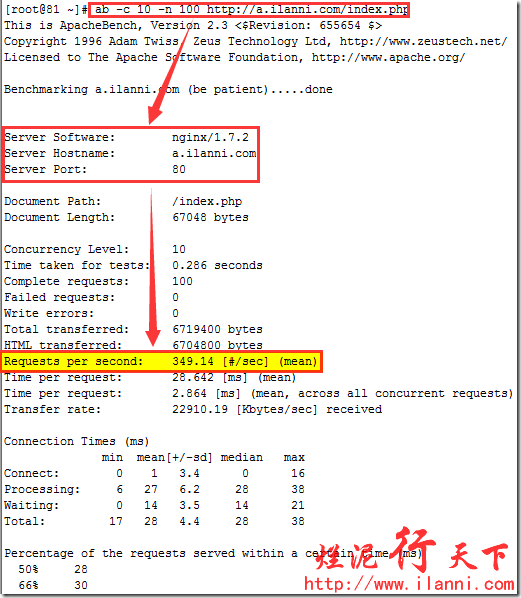
Through the above figure, the test results are also clear at a glance. The throughput rate tested by apache is: Requests per second: 204.89[#/sec](mean).
In addition, there are some other information that need to be explained, as follows:
Server Software indicates the name of the tested Web server software.
Server Hostname indicates the requested URL hostname.
Server Port indicates the listening port of the web server software under test.
Document Path represents the root absolute path in the requested URL. Through the suffix name of the file, we can generally know the type of the request.
Document Length indicates the body length of the HTTP response data.
Concurrency Level represents the number of concurrent users, which is one of the parameters we set.
Time taken for tests represents the total time it took for all these requests to be processed.
Complete requests represents the total number of requests, which is one of the parameters we set.
Failed requests indicates the number of failed requests. The failure here refers to the abnormality of the request in the process of connecting to the server, sending data, etc., and the timeout after no response. If the header information of the received HTTP response data contains a status code other than 2XX, another statistic item named "Non-2xx responses" will be displayed in the test result, which is used to count the number of requests in this part. Does not count towards failed requests.
Total transferred indicates the total length of the response data of all requests, including the length of the header information and body data of each HTTP response data. Note that the length of the HTTP request data is not included here, it is only the total length of the application layer data that the web server flows to the user's PC.
HTML transferred represents the sum of the body data in the response data of all requests, that is, minus the length of the header information in the HTTP response data in Total transferred.
Requests per second throughput rate, calculation formula: Complete requests/Time taken for tests
Time per request The average request waiting time of users, calculated by the formula: Time token for tests/ (Complete requests/Concurrency Level).
Time per requet (across all concurrent request) The average request waiting time of the server. The calculation formula is: Time taken for tests/Complete requests, which is exactly the inverse of the throughput rate. It can also be calculated like this: Time per request/Concurrency Level.
Transfer rate represents the length of data obtained from the server in unit time for these requests. The calculation formula is: Total trnasferred/ Time taken for tests. This statistic is a good indication of the demand for outbound broadband when the server's processing capacity reaches its limit.
Percentage of requests served within a certain time (ms) This part of the data is used to describe the distribution of the processing time of each request. For example, in the above test, 80% of the request processing time does not exceed 6ms. This processing time refers to the previous Time per request, that is, the average processing time of each request for a single user.
Six, test nginx performance
The fifth step tested the performance of apache, now let's test the performance of nginx.
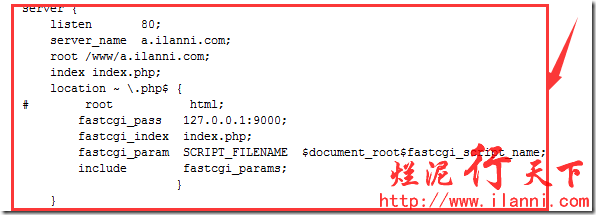
First configure the virtual host of nginx as follows:
cat /usr/local/nginx/conf/nginx.conf|grep -v ^ # | grep -v ^ $
With the virtual host configured, we now access the virtual host. as follows:
wget a.ilanni.com
Note that the virtual host and apache's virtual host are the same, and the request is the same page.
Use the same command as apache to test nginx, as follows:
ab -c 10 -n 100 http://a.ilanni.com/index.php
The result is as follows:
Through the above figure, the test results are also clear at a glance. The throughput rate tested by nginx is: Requests per second: 349.14[#/sec](mean).
Comparing the throughput rate of apache requesting the page, it is found that the throughput rate of nginx is higher than that of apache. According to the performance indicator we mentioned earlier, the higher the Requests per second throughput rate, the better the server performance.
This also proves that the performance of nginx is indeed higher than that of apache.





![clip_image010[1]](http://files.jb51.net/file_images/article/201501/2015010515095923.png)
