Article directory
foreword
Performance testing is one of the skills that a full-stack engineer/architect must have. Only by learning performance testing can we analyze the obtained test report and find the bottleneck of system performance, which is also an important basis for optimizing the architecture design.
This article briefly describes performance testing and the performance testing tool Jemeter. In addition, I will also include other testing related articles in this series.
1. Performance test
1. What is performance testing?
Performance testing is the process of applying pressure to the system under test according to a certain test strategy in a specific way, and obtaining performance indicators such as response time, TPS, throughput, and resource utilization of the system to detect whether the system can meet user requirements after it goes online.
2. The importance of performance testing
Performance testing is an important step to test the performance of our system. Only after passing the performance testing and obtaining the corresponding test report, can we analyze and find out the bottleneck of the system based on the phenomena presented in the report (success rate, response time, TPS, etc.). , to optimize the performance of the system.
3. Performance Indicators - QPS and TPS
①QPS
QPS, full name Queries Per Second, means "query rate per second", is the number of queries a server can respond to per second, and is a measure of how much traffic a specific query server handles within a specified time.
②TPS
TPS is the abbreviation of Transactions Per Second, the number of transactions processed per second. A transaction is a process in which a client sends a request to a server and the server responds.
The client starts timing when sending the request, and ends the timing after receiving the response from the server, so as to calculate the time used and the number of completed transactions, and finally use this information to make an evaluation score.
Qps is basically similar to Tps, but the difference is that one visit to a page forms one Tps; but one page request may generate multiple requests to the server, and the server can count these requests into "Qps". .
Both QPS and TPS are one of the important indicators to measure the performance of a system.
Second, the pressure measurement tool Jemeter
1. What is Jemeter?
ApacheJMeter, is a 100% pure Java open source software designed to load test functional behavior and measure performance. It was originally designed for testing web applications, but has since been extended to other testing capabilities.
Compared with some other performance testing tools in the world, Jemeter is one of the few testing tools that are both easy to use and open source and free.
2. Jemeter main components
1. Test plan: It is the starting point for testing with JMeter, it is a container for other JMeter test components
2. Thread group: representing a certain number of users, it can be used to simulate users sending requests concurrently. The actual request content is defined in Sampler, which is contained by the thread group.
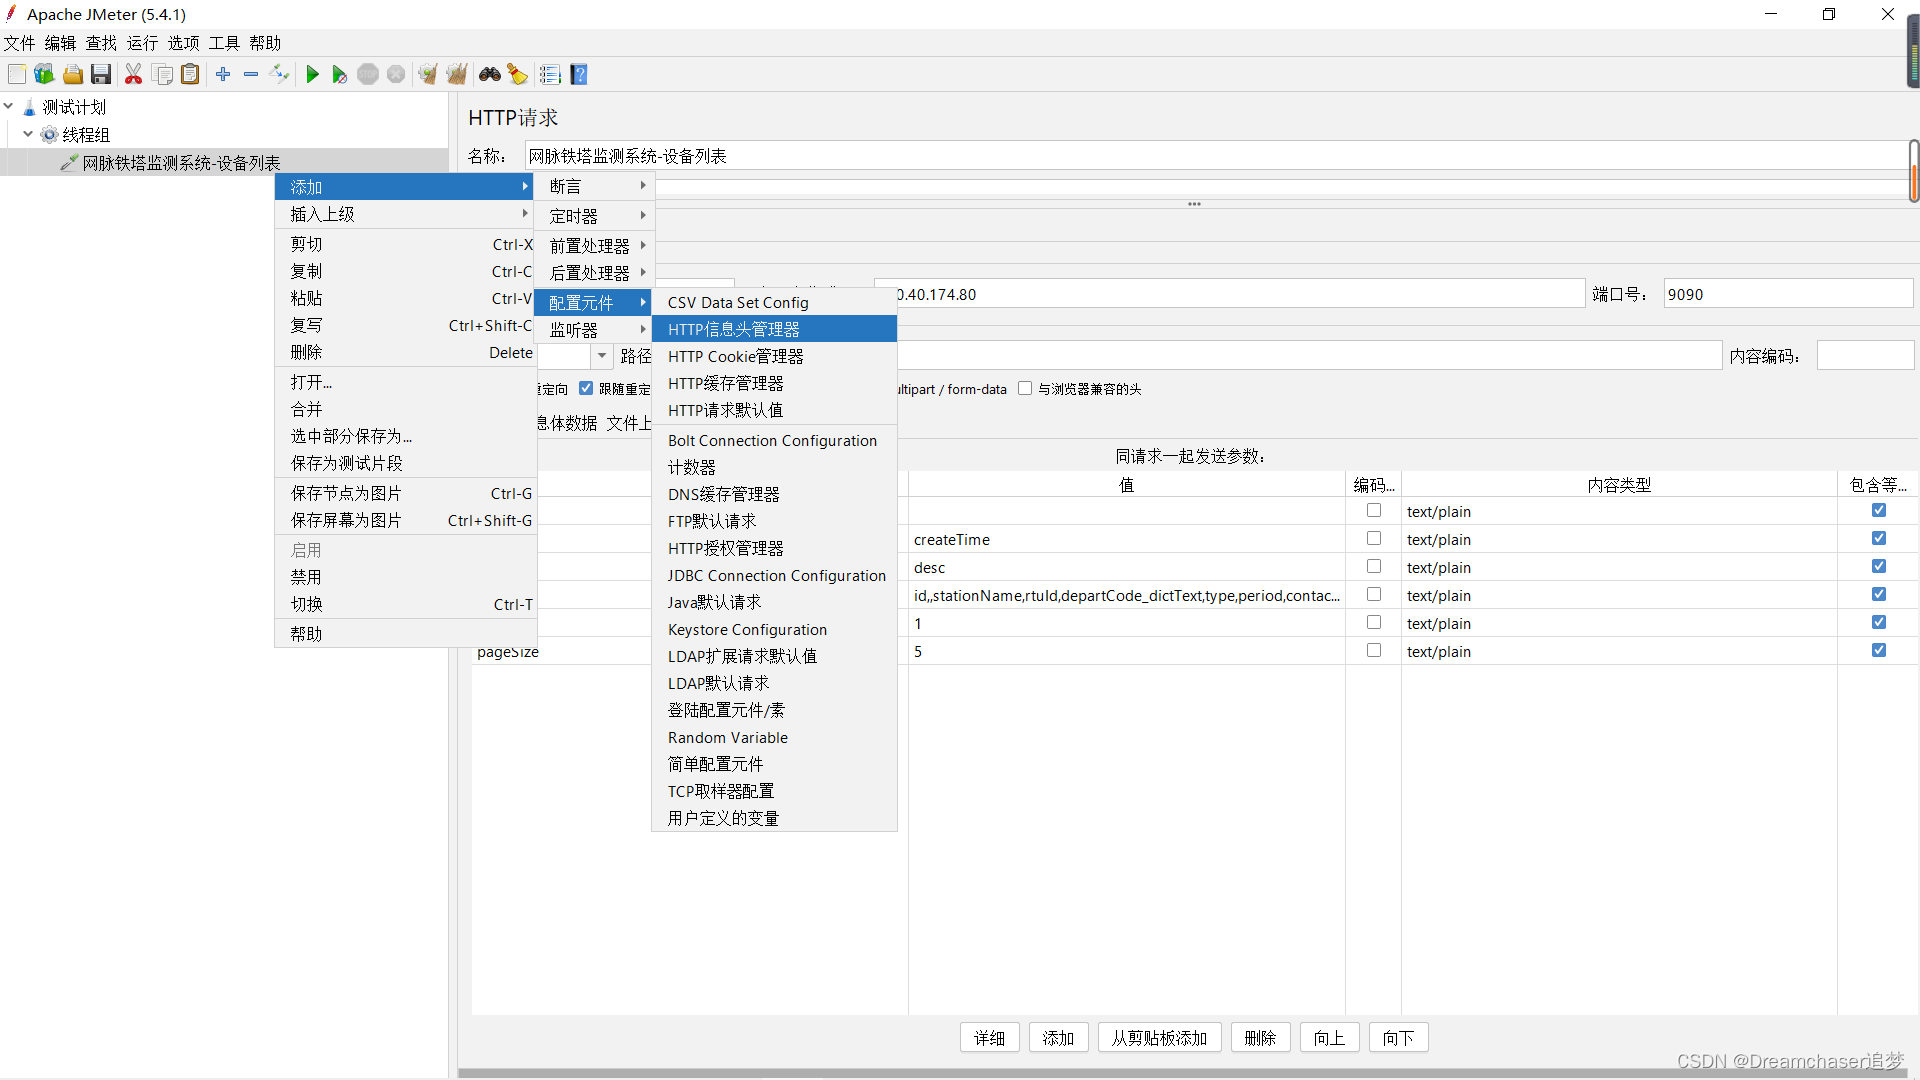
3. Configuration element: maintain the configuration information required by Sampler, and modify the content of the request according to actual needs.
4. Preprocessor: responsible for working before the request, often used to modify the settings of the request
5. Timer: responsible for defining the delay interval between requests.
6. Sampler: It is the smallest unit that sends a request to the server in the performance test and records the response information and response time, such as: HTTP Request Sampler, FTP Request Sample, TCP Request Sample, JDBC Request Sampler, etc., each of which is different Types of sampler can make different types of requests to the server according to the set parameters.
7. Post-processor: responsible for working after the request, commonly used to obtain the returned value.
8. Assertion: used to determine whether the result of the request response is as expected by the user.
9. Listener: Responsible for collecting test results and determining the way the results are displayed.
10. Logic controller: You can customize the behavior logic of JMeter sending requests. It can be used in combination with Sampler to simulate complex request sequences.
3. Download and install
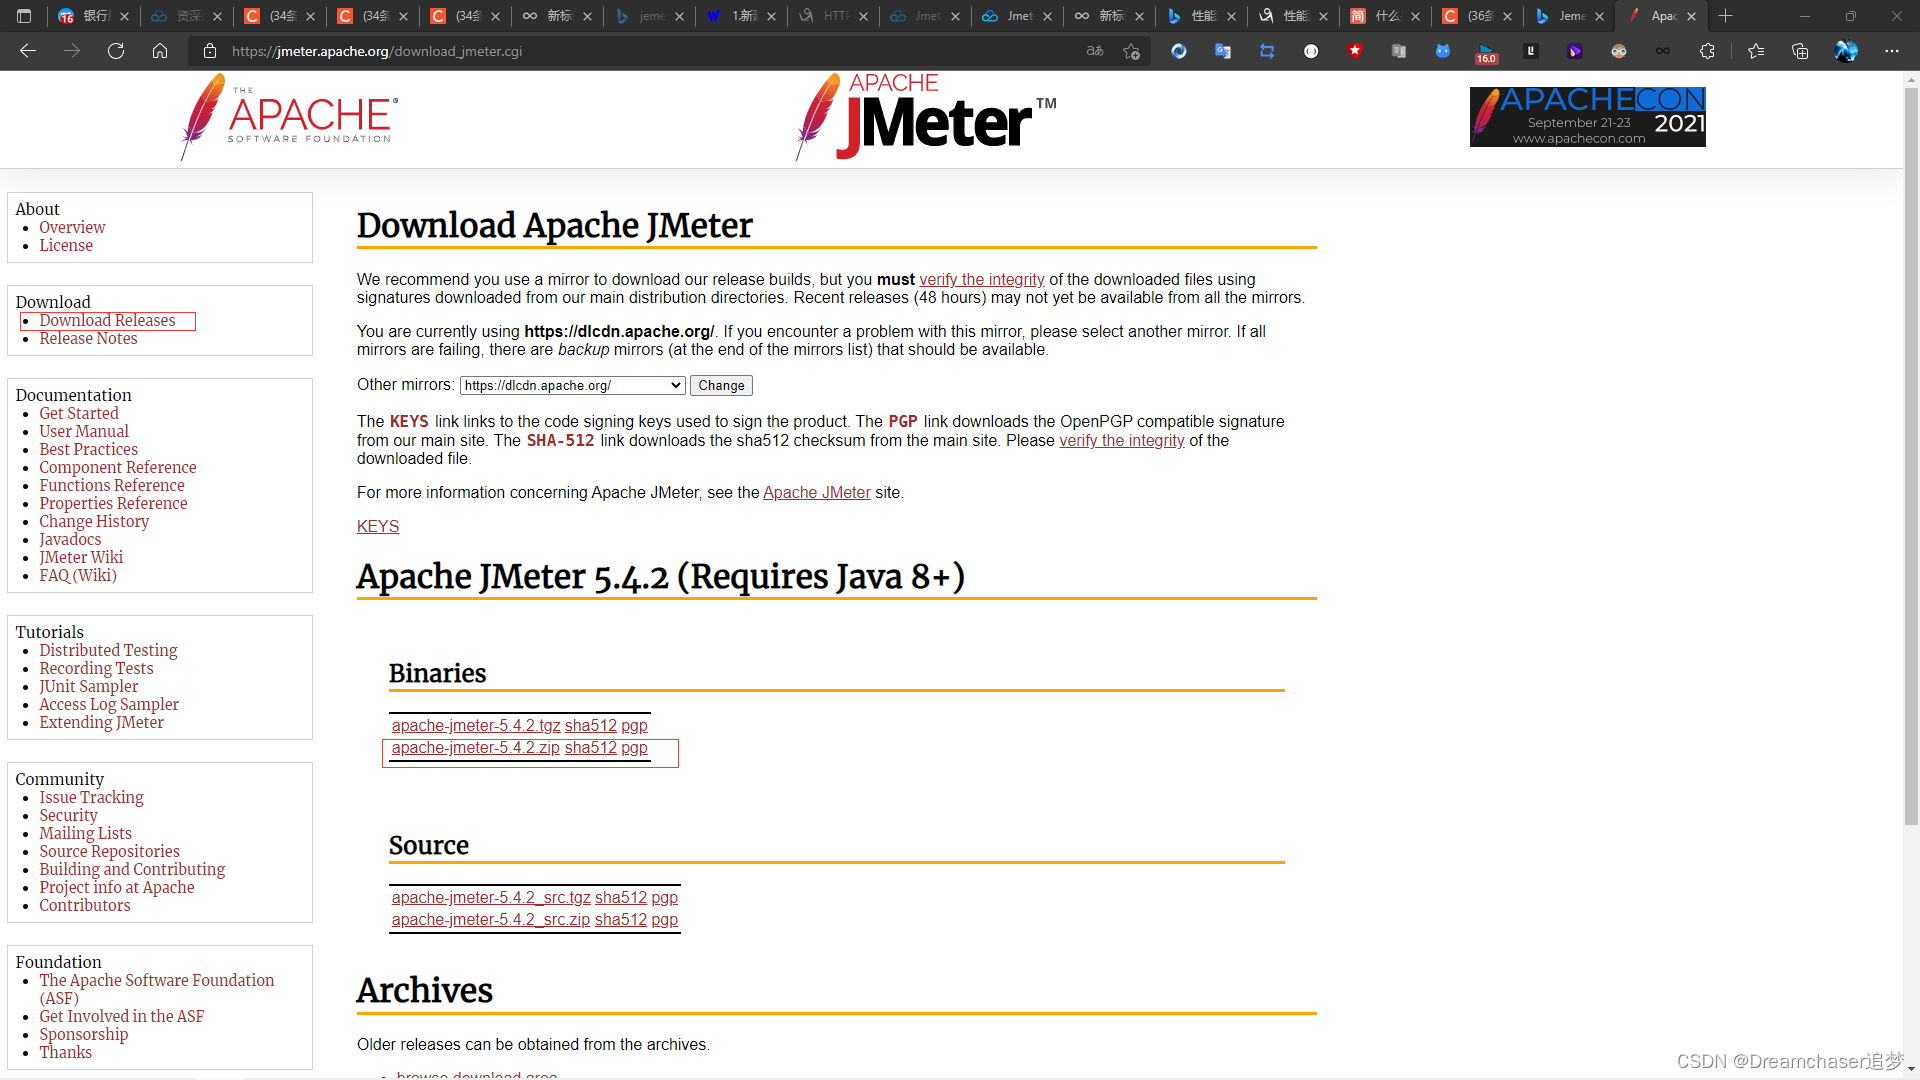
Enter the official website , click Download Releases on the left to select and yes to download.
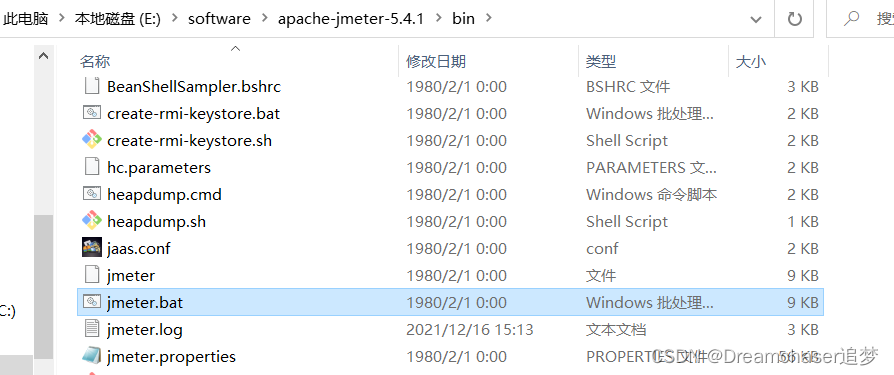
After downloading, it is a compressed package, unzip it to the directory you want (preferably without Chinese). (Of course, it requires a Java runtime environment. If it is not installed, you can go to the next jdk, so I won't go into details here.)
Enter the bin directory, double-click to run jmeter.bat to start jmeter,
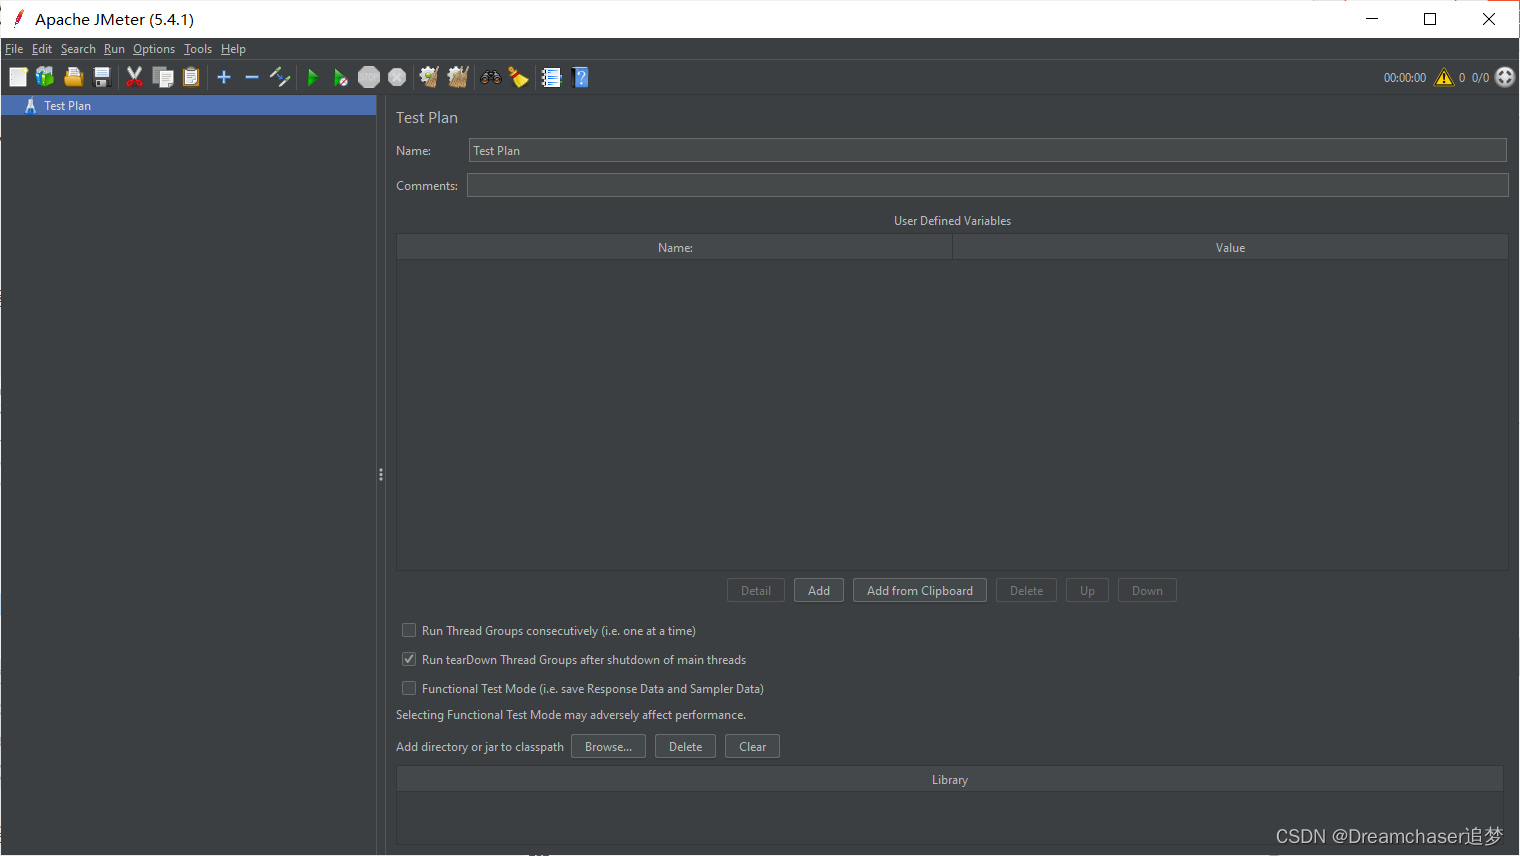
This will open the installed Jemeter.
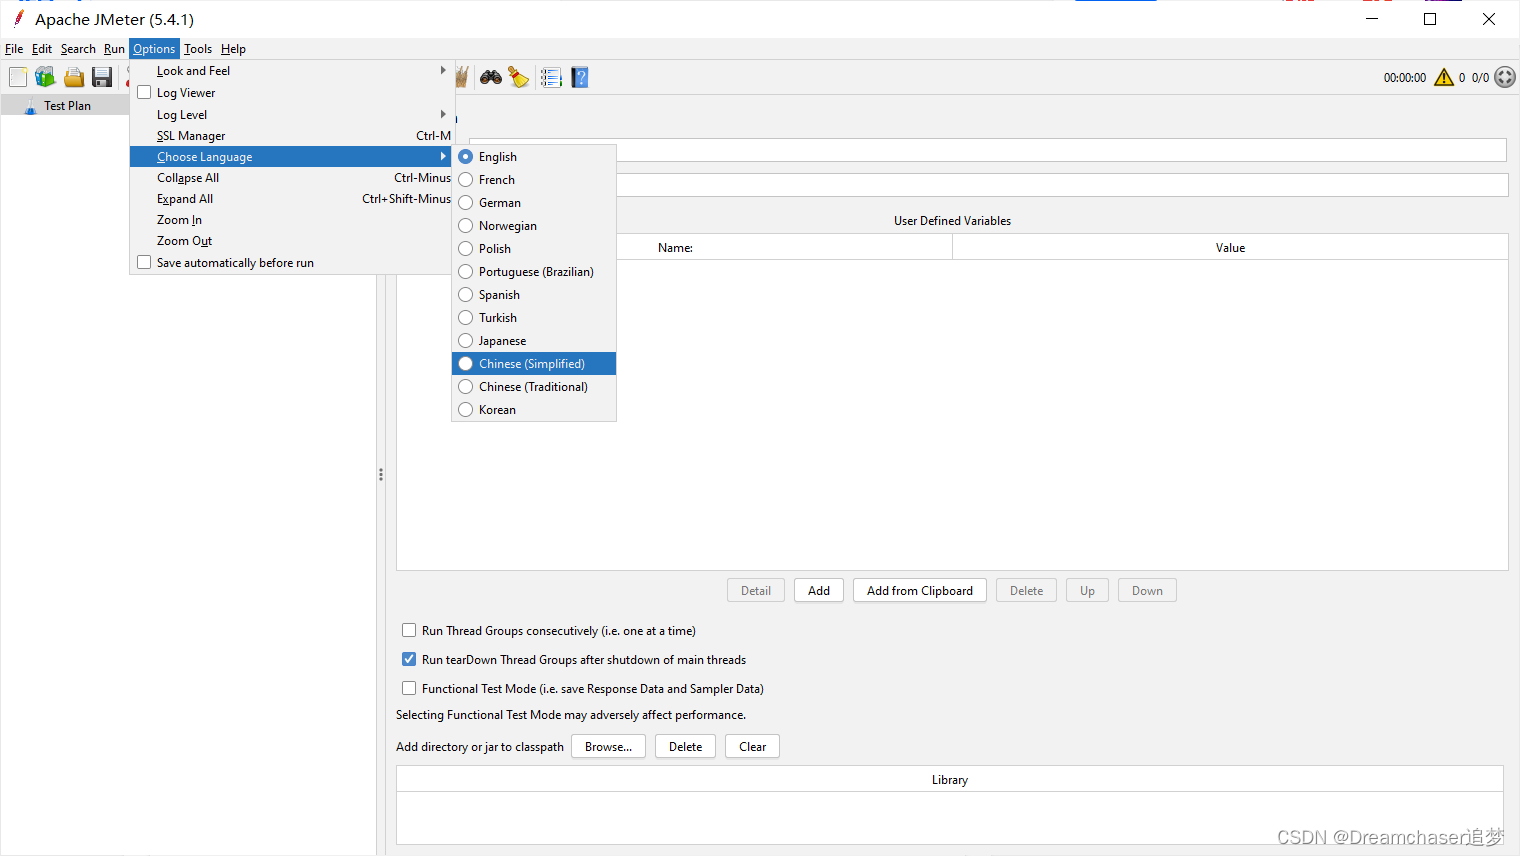
If you are not used to English, you can also change it in the settings
3. A simple test case
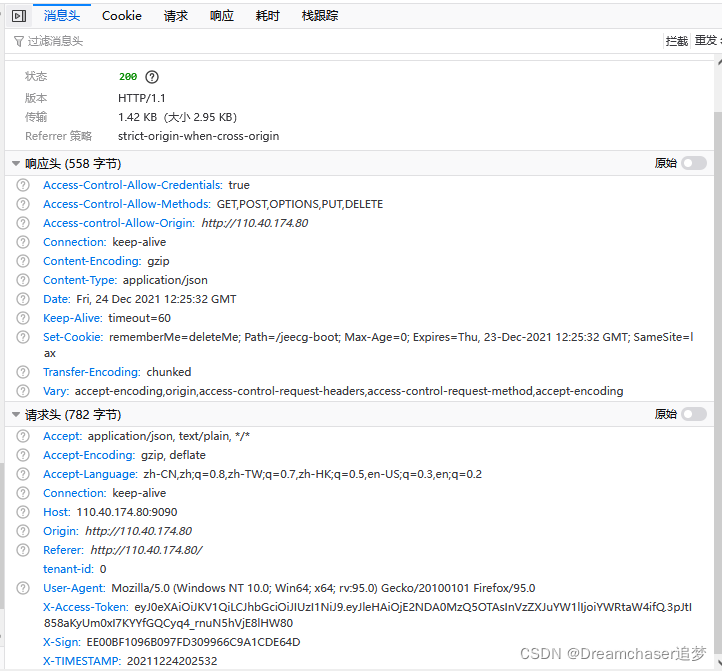
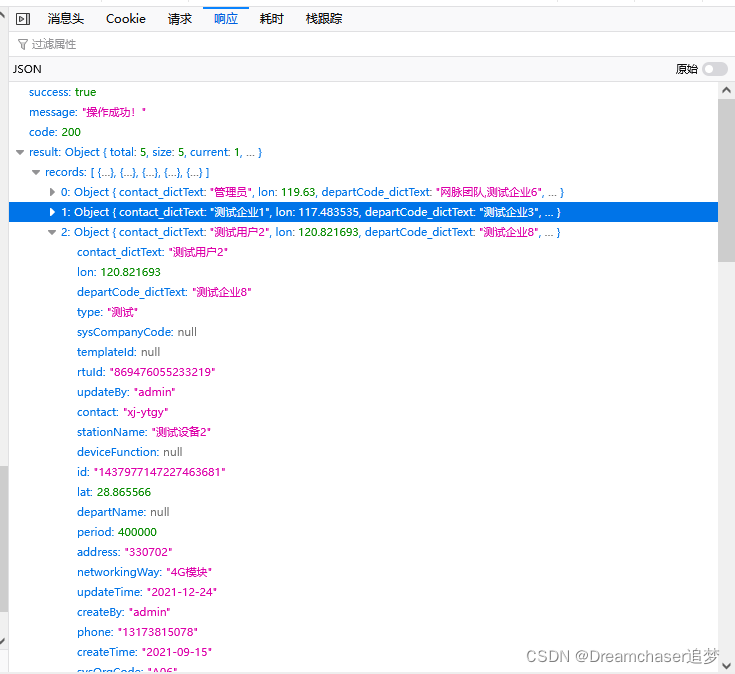
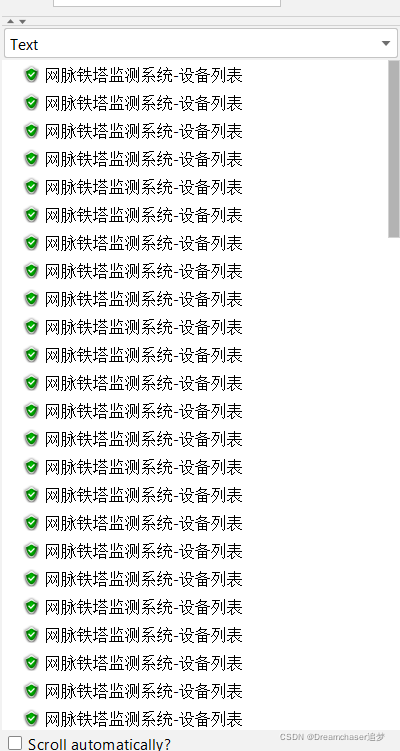
Here I demonstrate an example of testing a regular restful interface. The project of the demonstration interface comes from the network pulse tower monitoring Internet of Things platform written when I participated in the last service innovation provincial competition. This interface is mainly to obtain the device list. The normal response result is as follows:
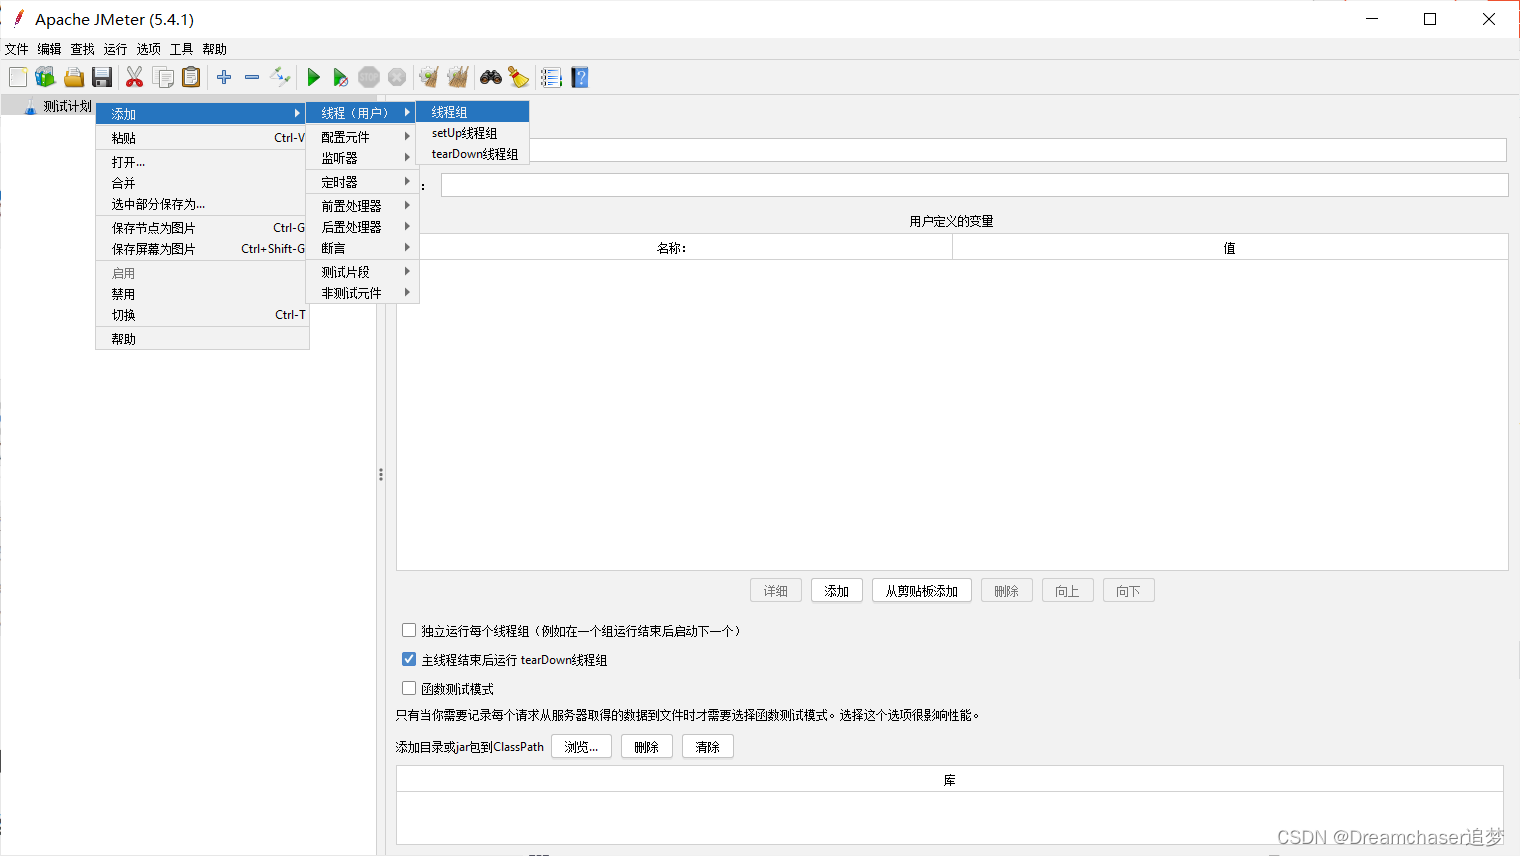
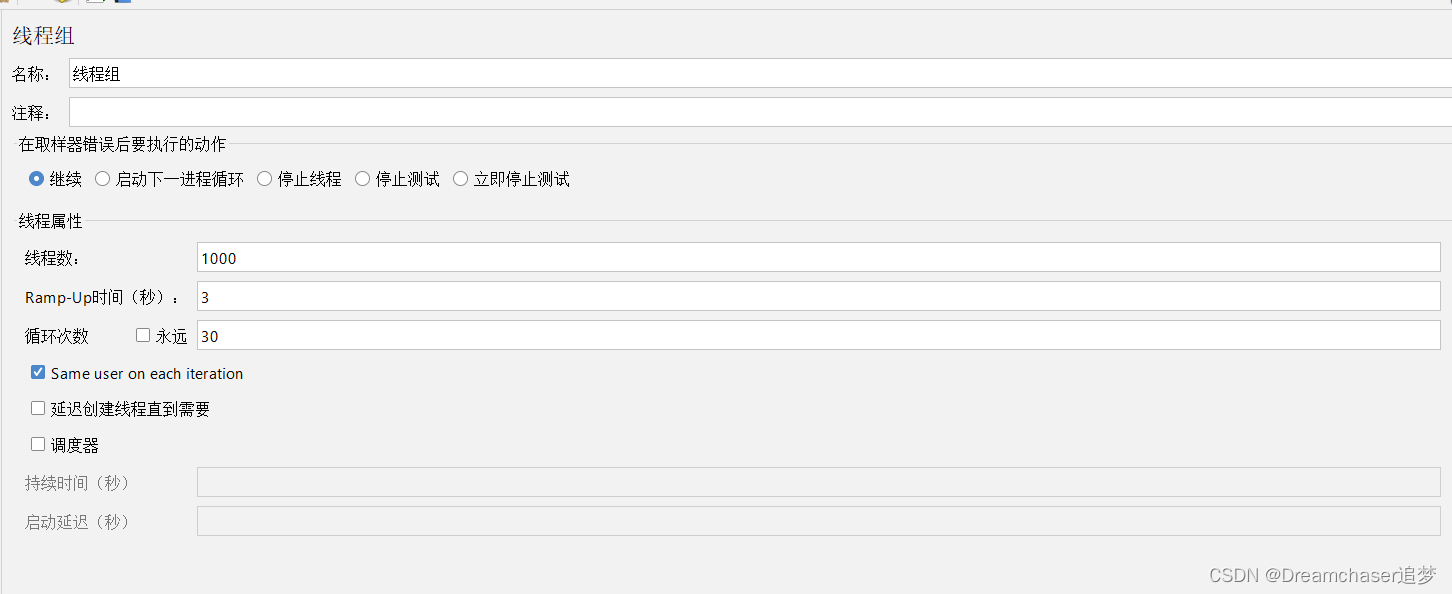
①Create a new thread group
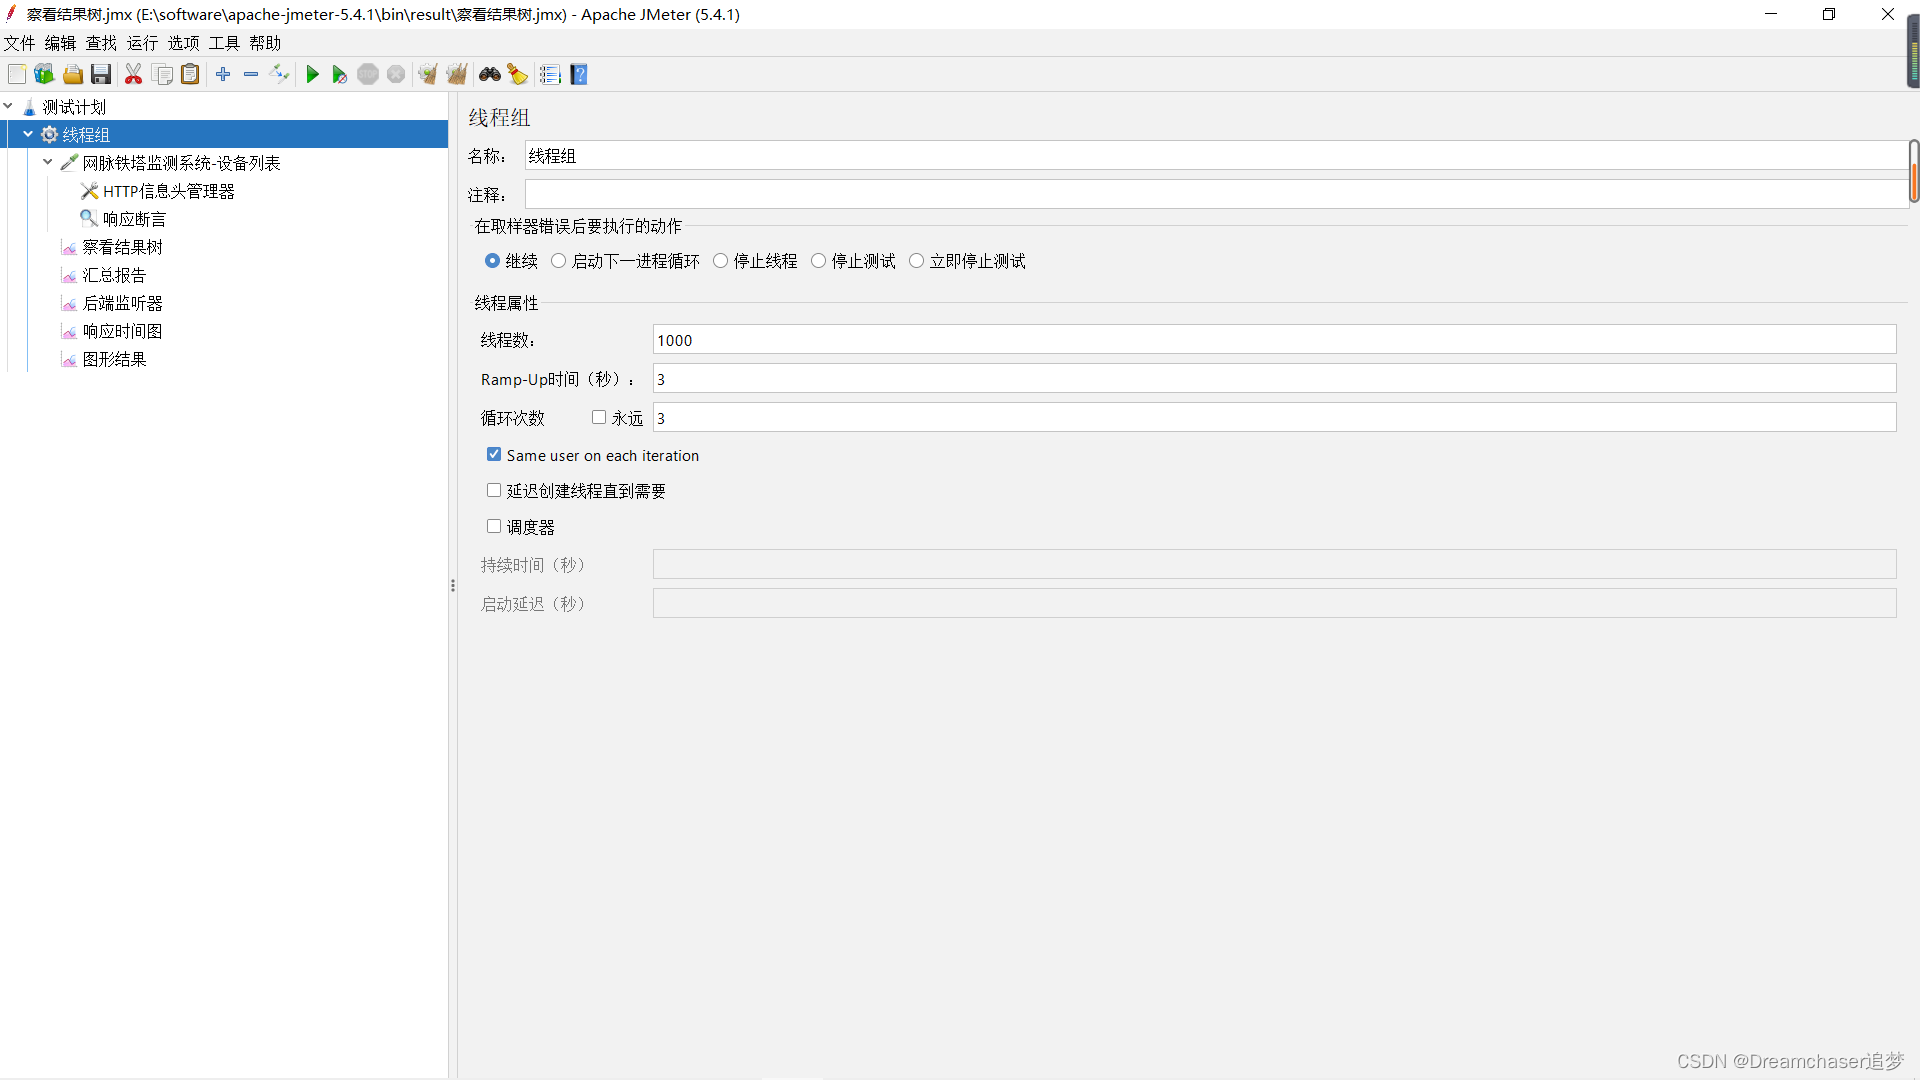
(1) Number of threads: the number of virtual users. How many threads are set is how many virtual users are set
(2) Ramp-Up time (seconds): Set the duration for all virtual users to start up. If the number of threads is 20 and the preparation time is 10 seconds, it will take 10 seconds to start 20 threads. That is, an average of 2 threads are started per second.
(3) Cycle times: the number of requests sent by each thread. If the number of threads is 20 and the number of loops is 10, then each thread sends 10 requests. The total number of requests is 20*10=200. If "Forever" is checked,
all threads will continue to send requests until the stop button on the toolbar is manually clicked, or the set thread time expires.
Here we set 30 threads (don't add too much, this is just for demonstration), the startup time is set to 3s, and the number of loops is 3 times
②Create a new HTTP request
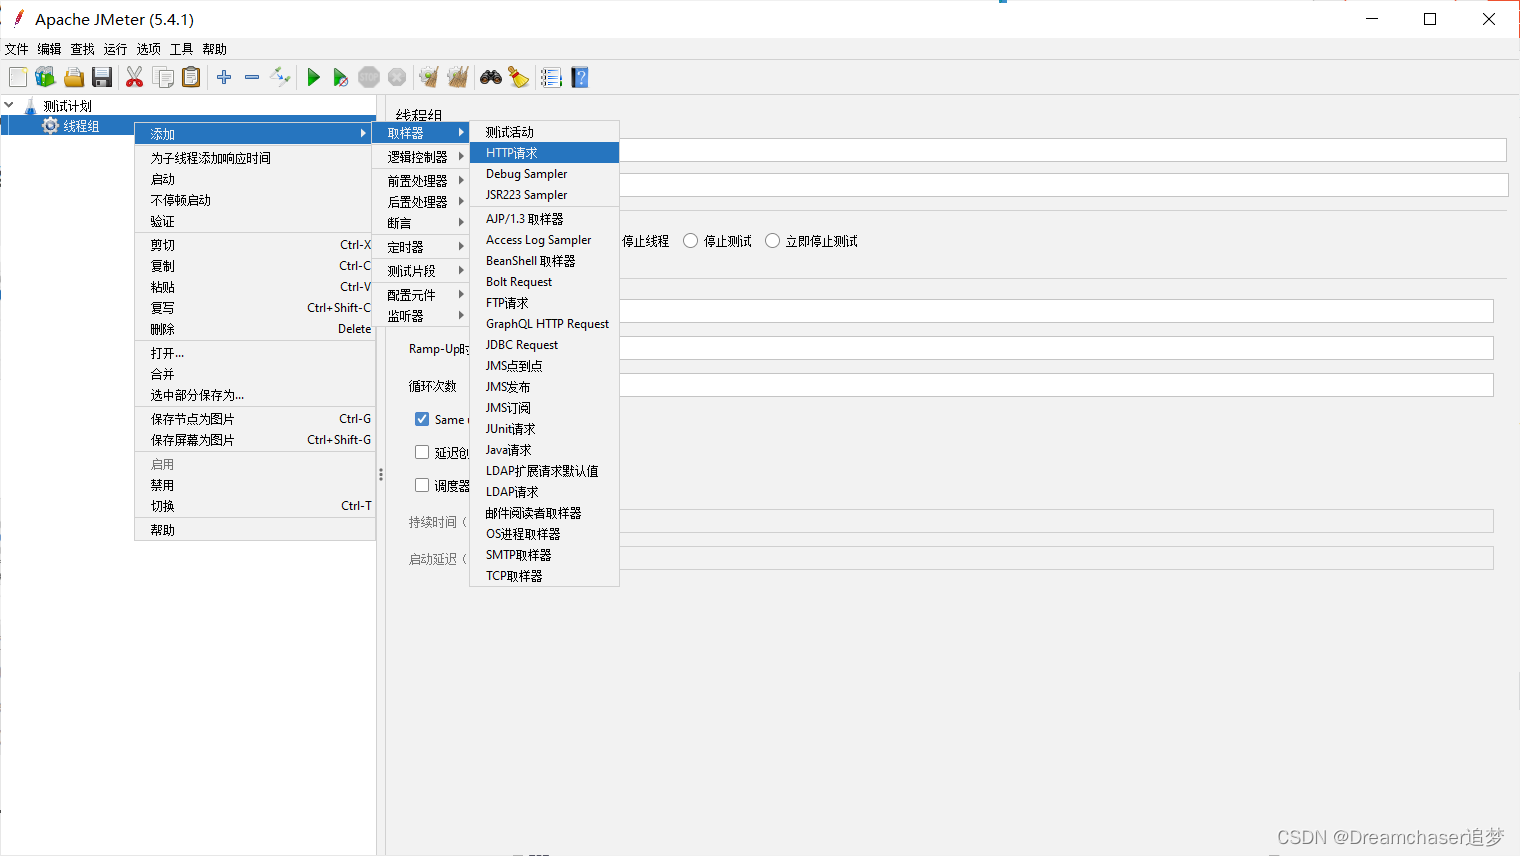
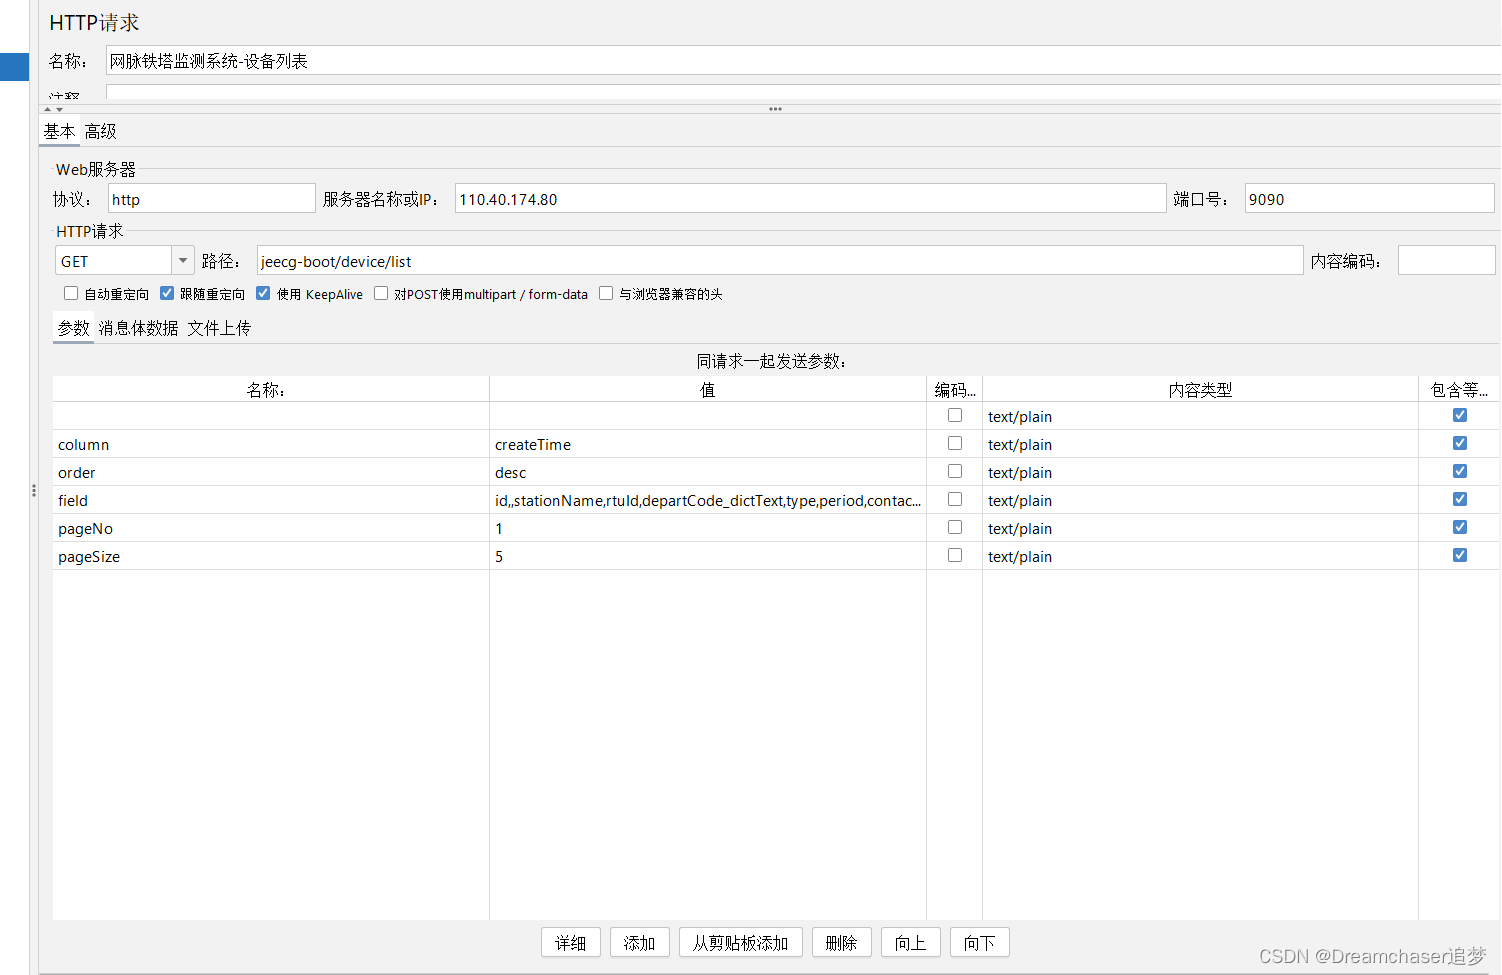
Fill in the interface information to be tested this time
③Add HTTP header (request header)
Corresponding message header information needs to be added here. In most web systems, authority authentication is often performed on the api interface, and the system tested this time is no exception. It is a typical token mechanism. token, then this test will be intercepted, and there is no way to test the business interface. So here you need to copy the token in the request header (different system permissions are designed differently, I am here X-Access-Token).
Of course, if the authorization authentication is implemented using the cookie mechanism, a new cookie manager needs to be created, so I won't go into details here.
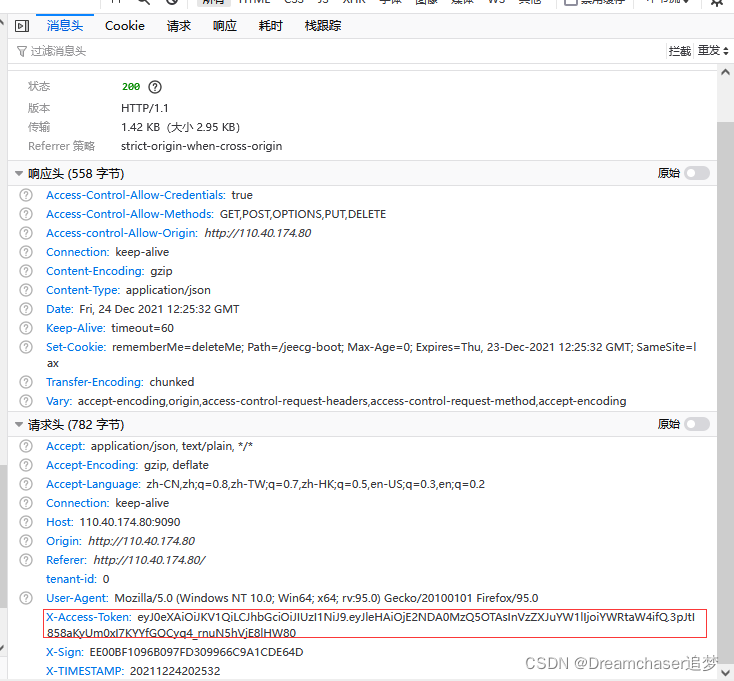
Of course, you can directly copy the entire request header information here, and then click "Add from clipboard" in Jemeter, so that you can copy all the request header information of the real request with one click.
④Add appropriate response assertion
Add an appropriate assertion to the corresponding result.
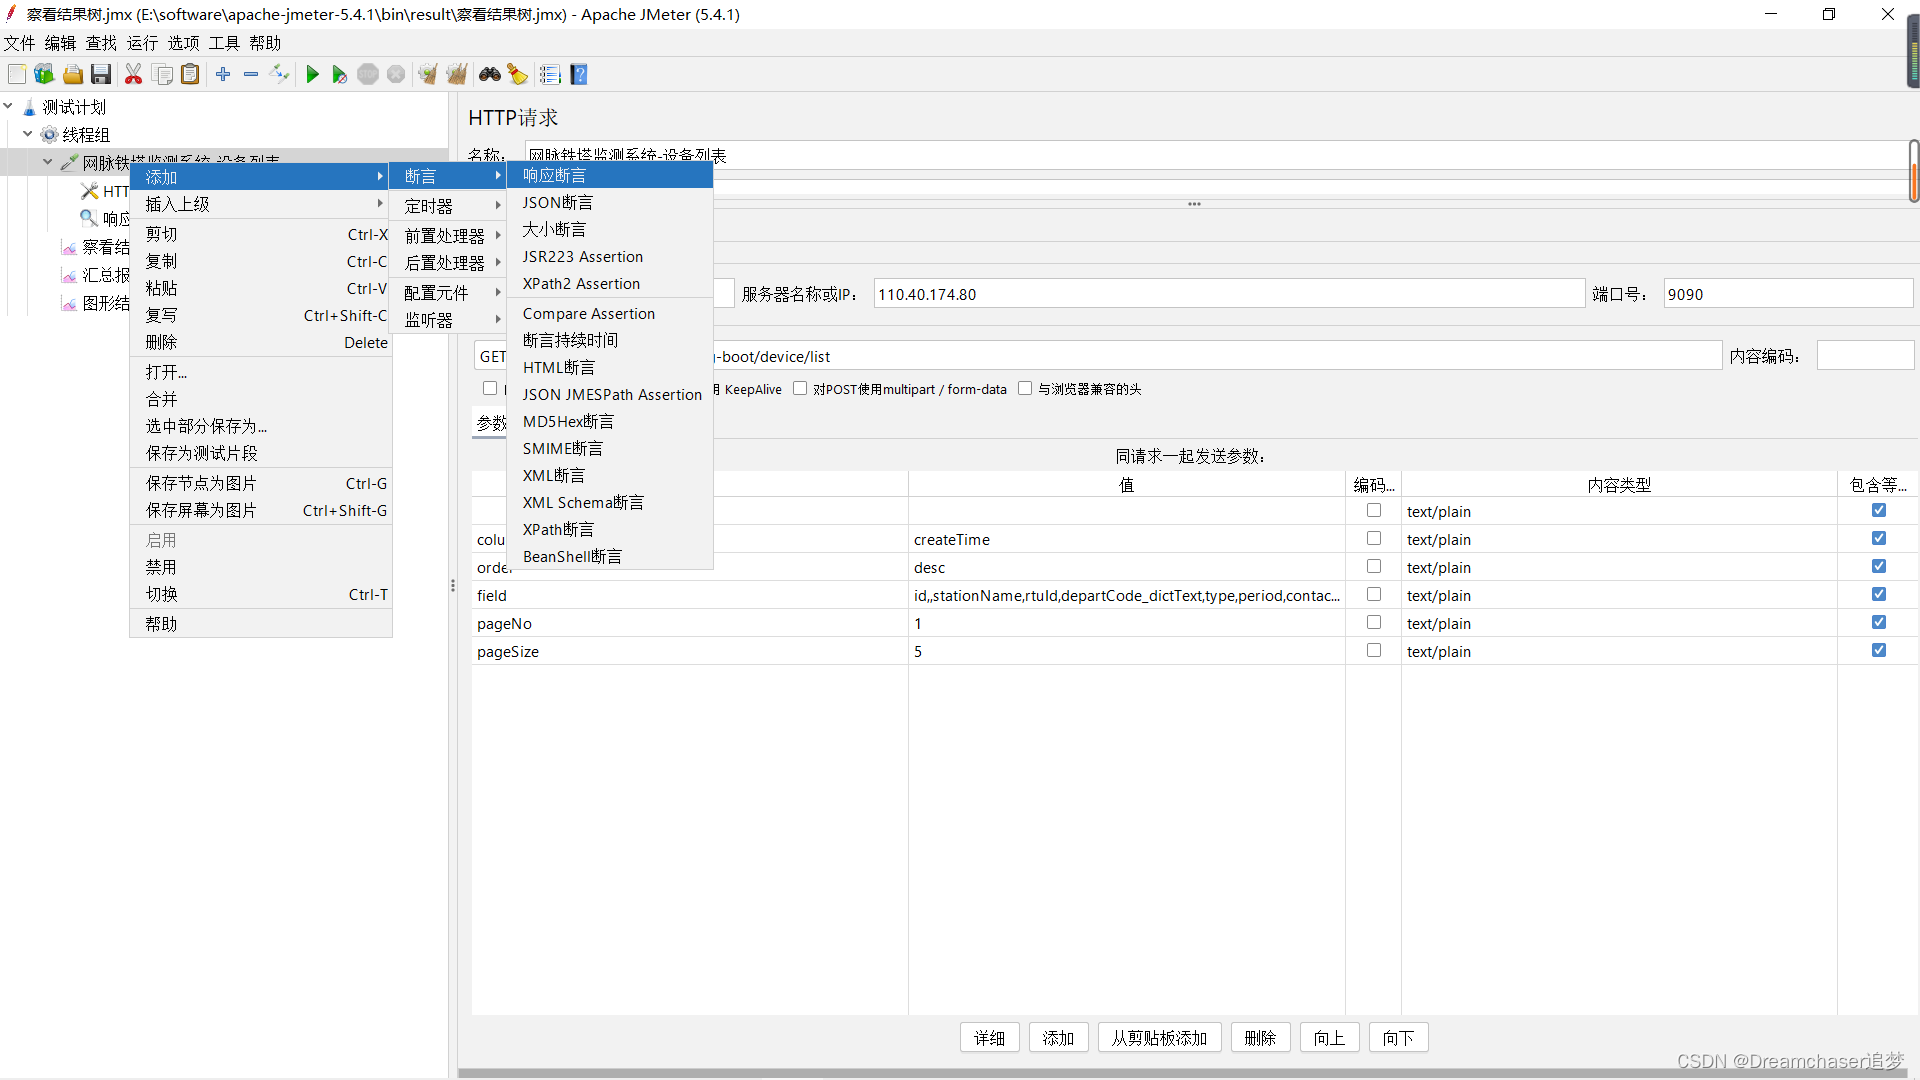
In this test system, if the response is successful, the response result will contain the string success: true, so I have made corresponding settings in the assertion.
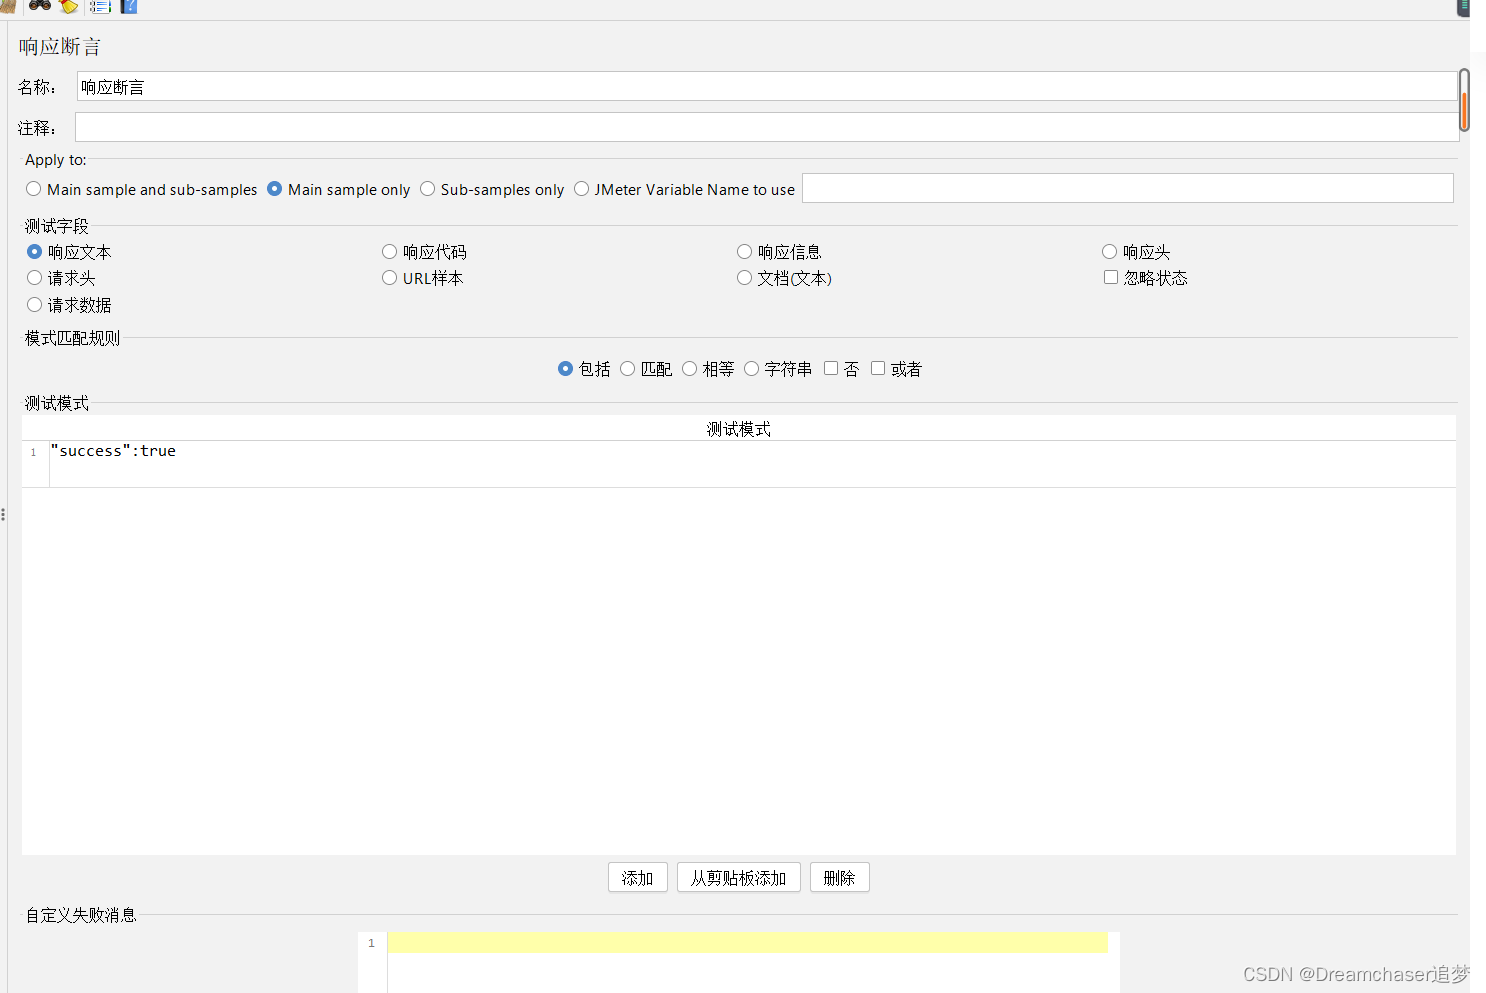
You can set the appropriate settings for your own system. assertion.
⑤Add a listener
JMeter has a number of UI Listeners that can be used to view results directly in the JMeter UI:
- View Results as Tree: View Results Tree displays a tree of all sample responses, allowing you to view the responses for any sample.
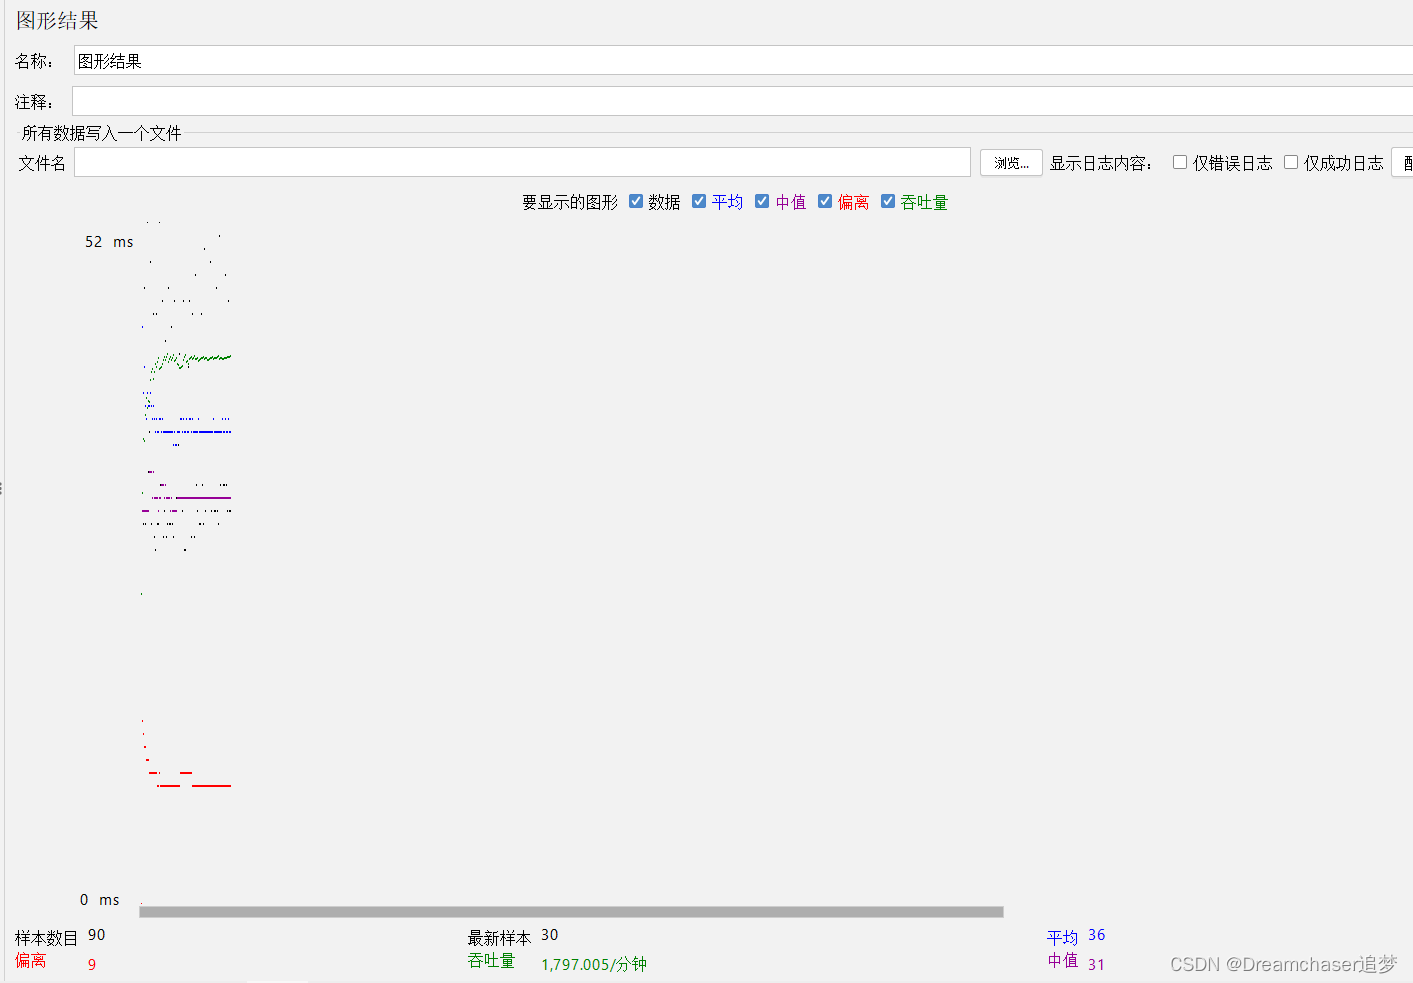
- Graph Results: The graph result listener generates a simple graph, plotting all sample times,
- Aggregate report: The aggregate report creates a table row for each differently named request in the test,
- View Results in Table: This visualizer creates a row for each sample result. Like viewing the result tree, this visualizer uses a lot of memory,
- Aggregated graphs: Aggregated graphs are similar to aggregated reports. The main difference is that aggregate graphs provide an easy way to generate bar graphs and save graphs as PNG files,
- Generate summary results: This test element can be placed anywhere in the test plan. Generate a summary of the test runs so far to a log file and/or standard output. Displays running and variance totals.
Select the appropriate result presentation method, here I have added the view result tree, summary report and graphical results
⑥Click to run
Click the run icon to run the test
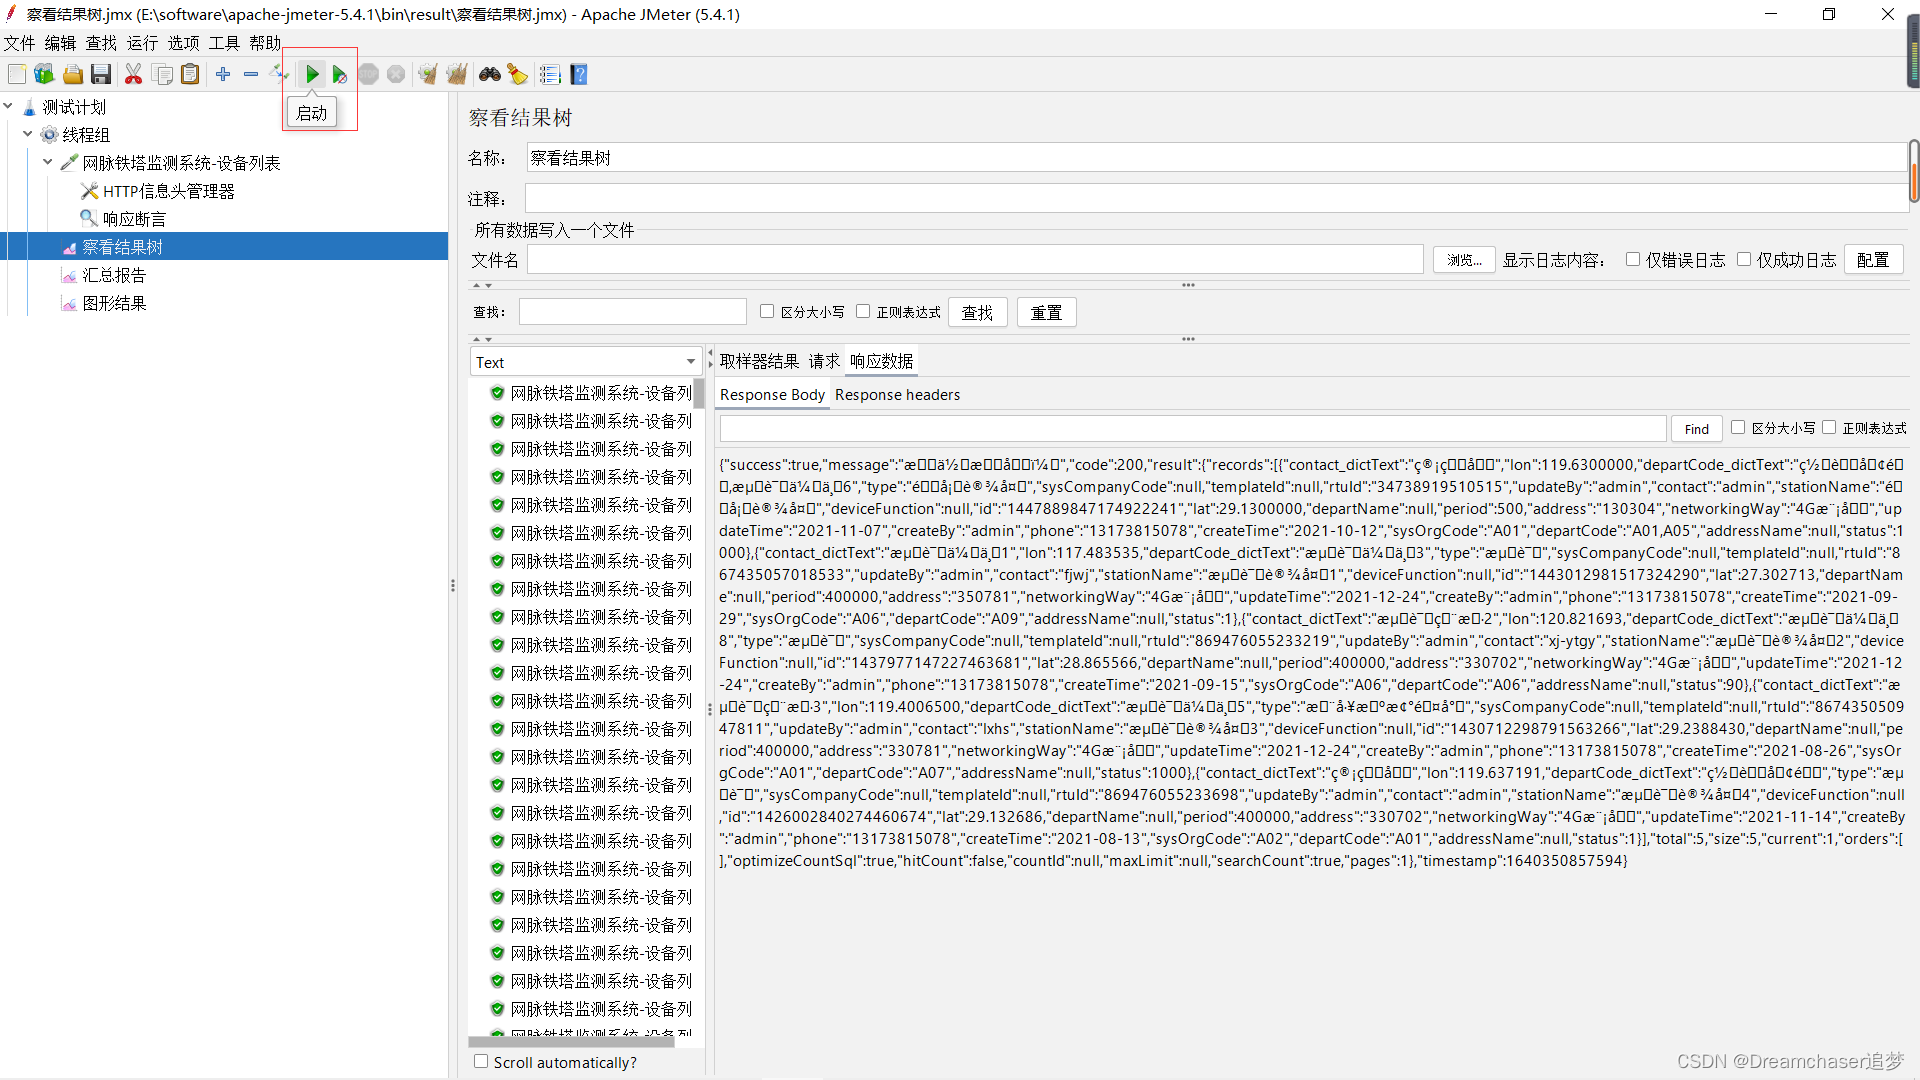
After the operation is completed, we can click the corresponding listener to view the operation result.

4. Analysis of Jemeter results
1. How to get a reliable test report?
We have completed a simple test case above, but our test is not over yet. We need to analyze the test results, but the above test results are unreliable in real projects and can only be used for debugging. If you are careful, you should be able to find this sentence on the command line running Jemeter.
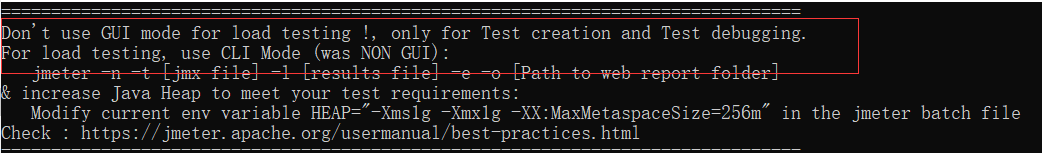
It directly states that it is not recommended to use the gui interface in real tests, especially the chart form, why?
Graphical results must not be used during load testing as it consumes a lot of resources (memory and CPU). Only used during functional testing or test plan debugging and validation.
Most UI listeners are great for debugging/testing purposes. Don't expect high loads (>= 500 users), use them sparingly. These listeners are designed to quickly get metrics when running load tests in the JMeter UI for light loads. (<= 50 concurrent users)
You can use them even for moderate loads (100-500 concurrent users), but don't expect to run distributed JMeter tests using the JMeter UI. This is not the purpose. Remember that JMeter is configured by default with 512MB of heap memory, which is quite low. While you can increase the memory allocated by JMeter, it will feel like it won't float on board anymore.
So what listeners can we use when running actual load tests?
① Simple data writer
Simple data writer: The listener can be configured to save different items to the result log file (JTL).
This is the most useful listener in JMeter. It saves performance metrics based on configuration in an external file: JTL file. JMeter JTL files are the best way to analyze the results, but there is one disadvantage: you need another tool to perform data mining.
Generally, we take the following two options
- Simple data writer + excel
- Simple data writer + HTML report DashBoard
It is recommended to use HTML report DashBoard here, which is also the officially supported way. Later I will also demonstrate the use of HTML reports DashBoard to generate performance test reports.
②Backend listener
Backend Listener: A backend listener is an asynchronous listener that allows you to plug in a custom implementation of BackendListenerClient. By default, a Graphite implementation is provided.
JMeter's Backend Listener allows plugging in external databases to store test results and performance metrics.
So we can choose the backend listener of InfluxDB+Grafana+JMeter to implement
- InfluxData: A database used as a temporary metrics store for storing performance metrics
- Grafana: Grafana is an open source platform for time series analysis that allows you to create real-time graphs from time series data
- Backend Listener for JMeter: The backend listener collects JMeter metrics and sends them to a temporary metrics store
③Other solutions
kylinTOP Testing and Monitoring Platform (Commercial Edition)
LoadRunner (Commercial Edition)
NeoLoad (Commercial Edition)
Load impact (Free to use)
…
Of course, there are some solutions on the market, but most of them are charged, so I won't go into details. For details, you can learn about this JMETER result analysis , and I refer to his solutions for a lot of content.
2. Simple data writer + HTML report DashBoard case demonstration
Here I still use the previous test case to demonstrate
① Modify the appropriate test scale
Here I increase the test pressure, change the number of threads to 1000, and cycle 30 times
②Add simple data writer
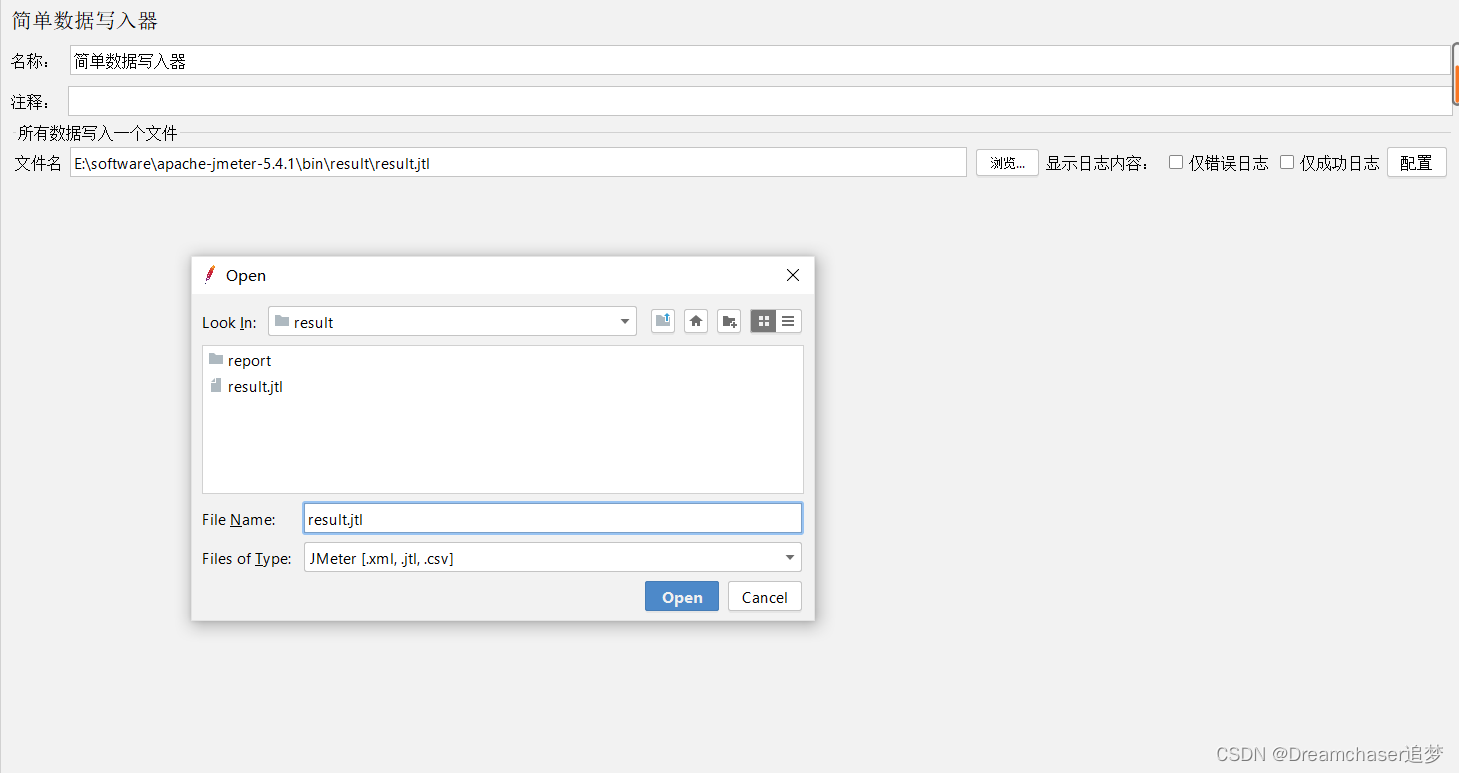
Add a simple data writer,
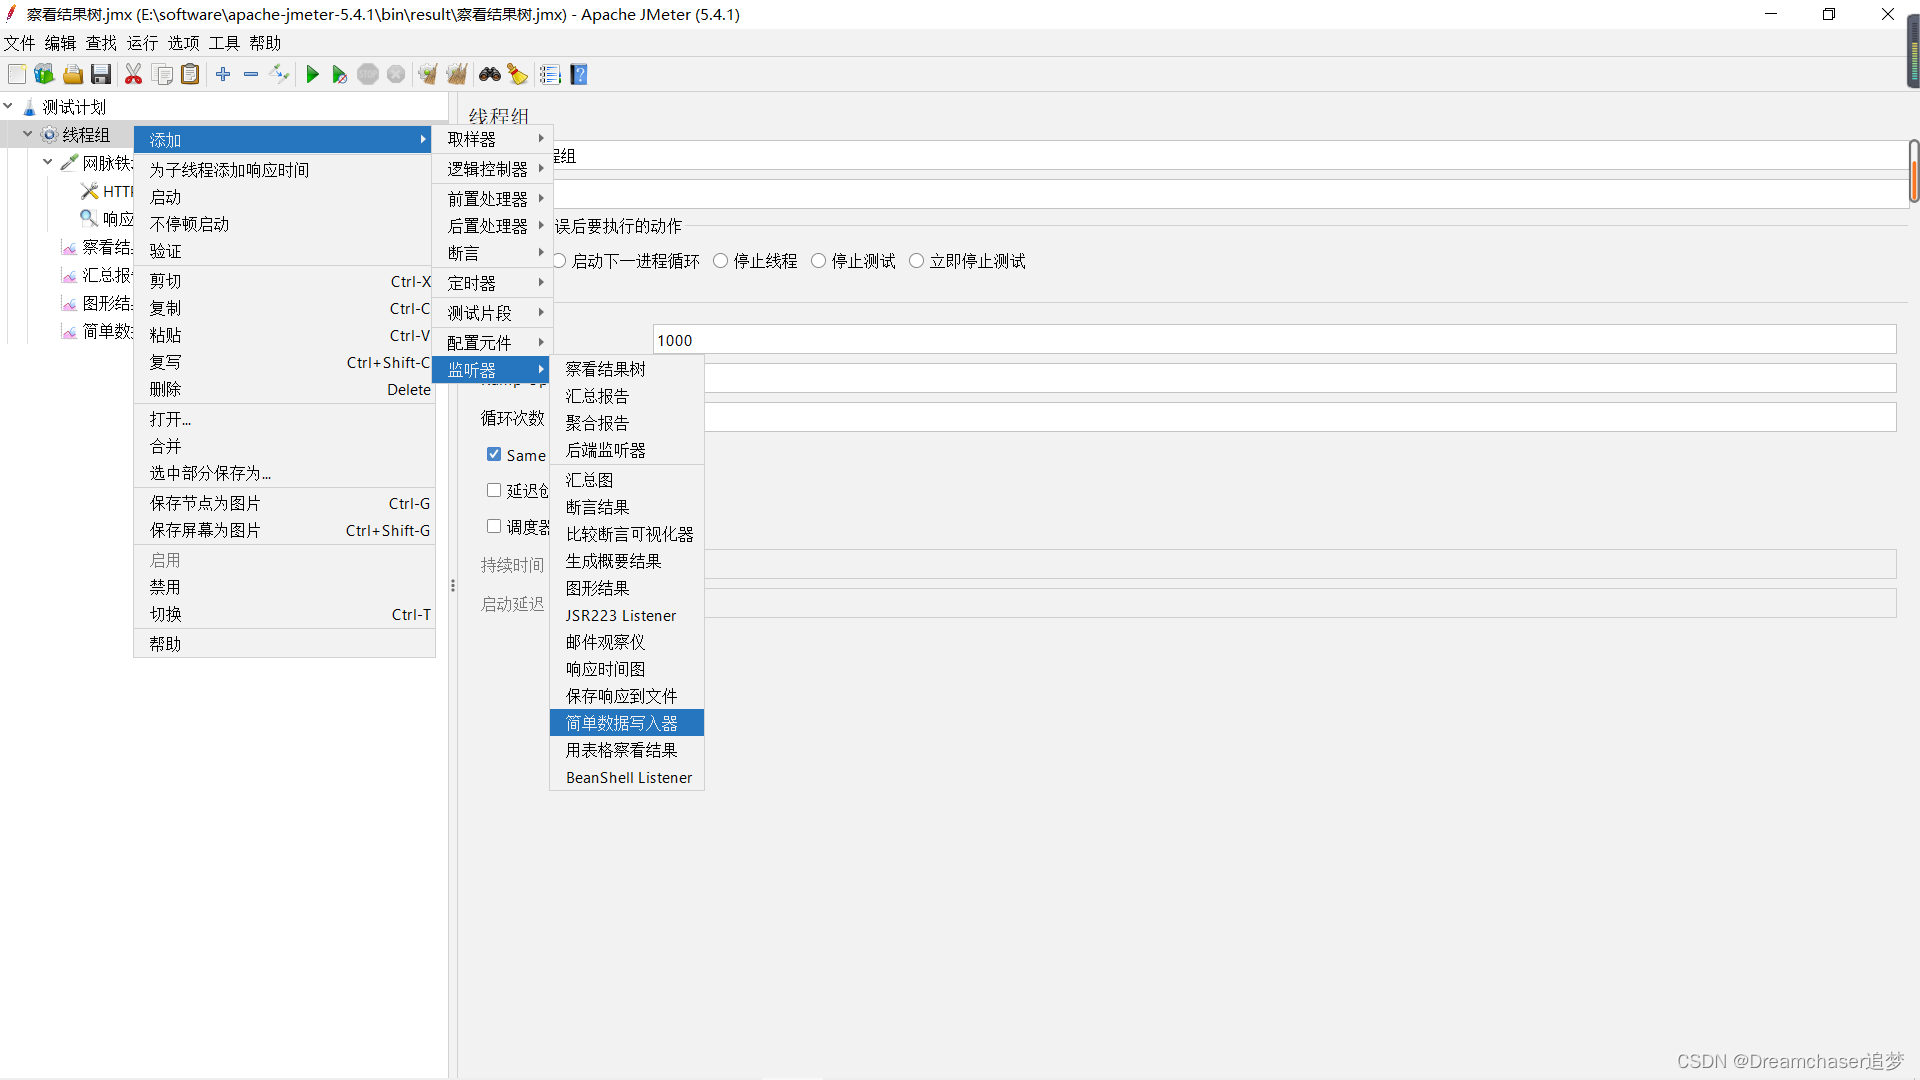
modify the output path to the appropriate directory, and save the file at the end of jtl
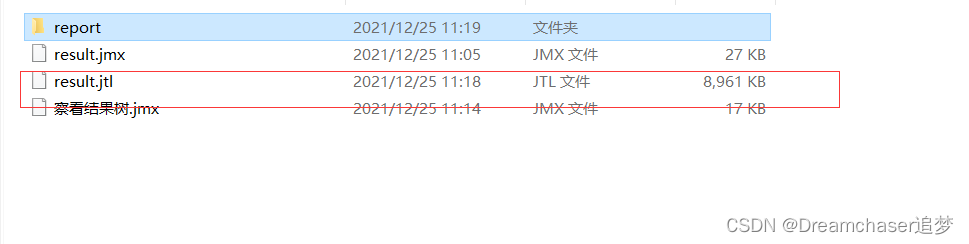
③ Run the generated file
Click the run icon, and you should be able to find the jtl file in the corresponding directory after the run is complete
④ Generate HTML report
Click Tools->Generate HTML report
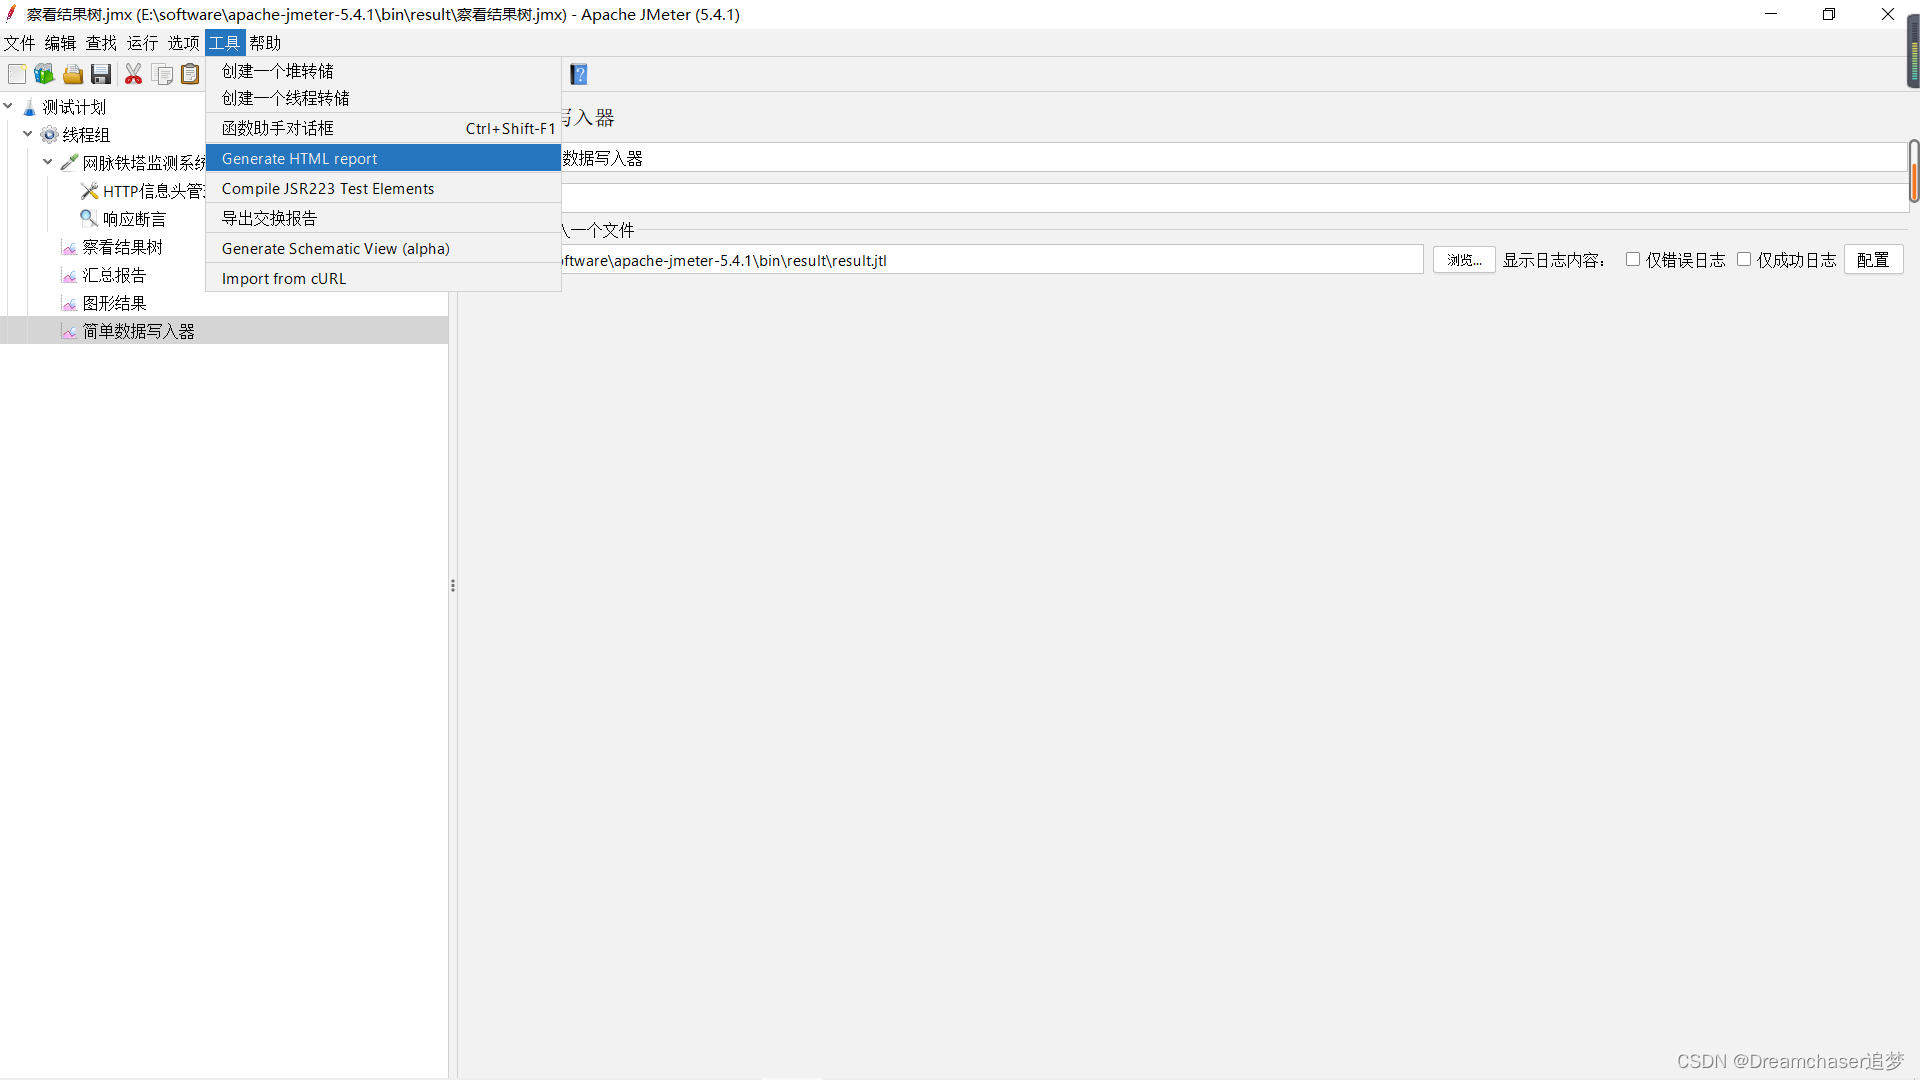
in the result files column, we select the jtl file exported before.
In the user configuration file column, we can select the user.properties file in the bin directory, or configure one according to the official website user manual . Here we can select the files in the bin directory.
We can choose a suitable empty directory for the output directory.
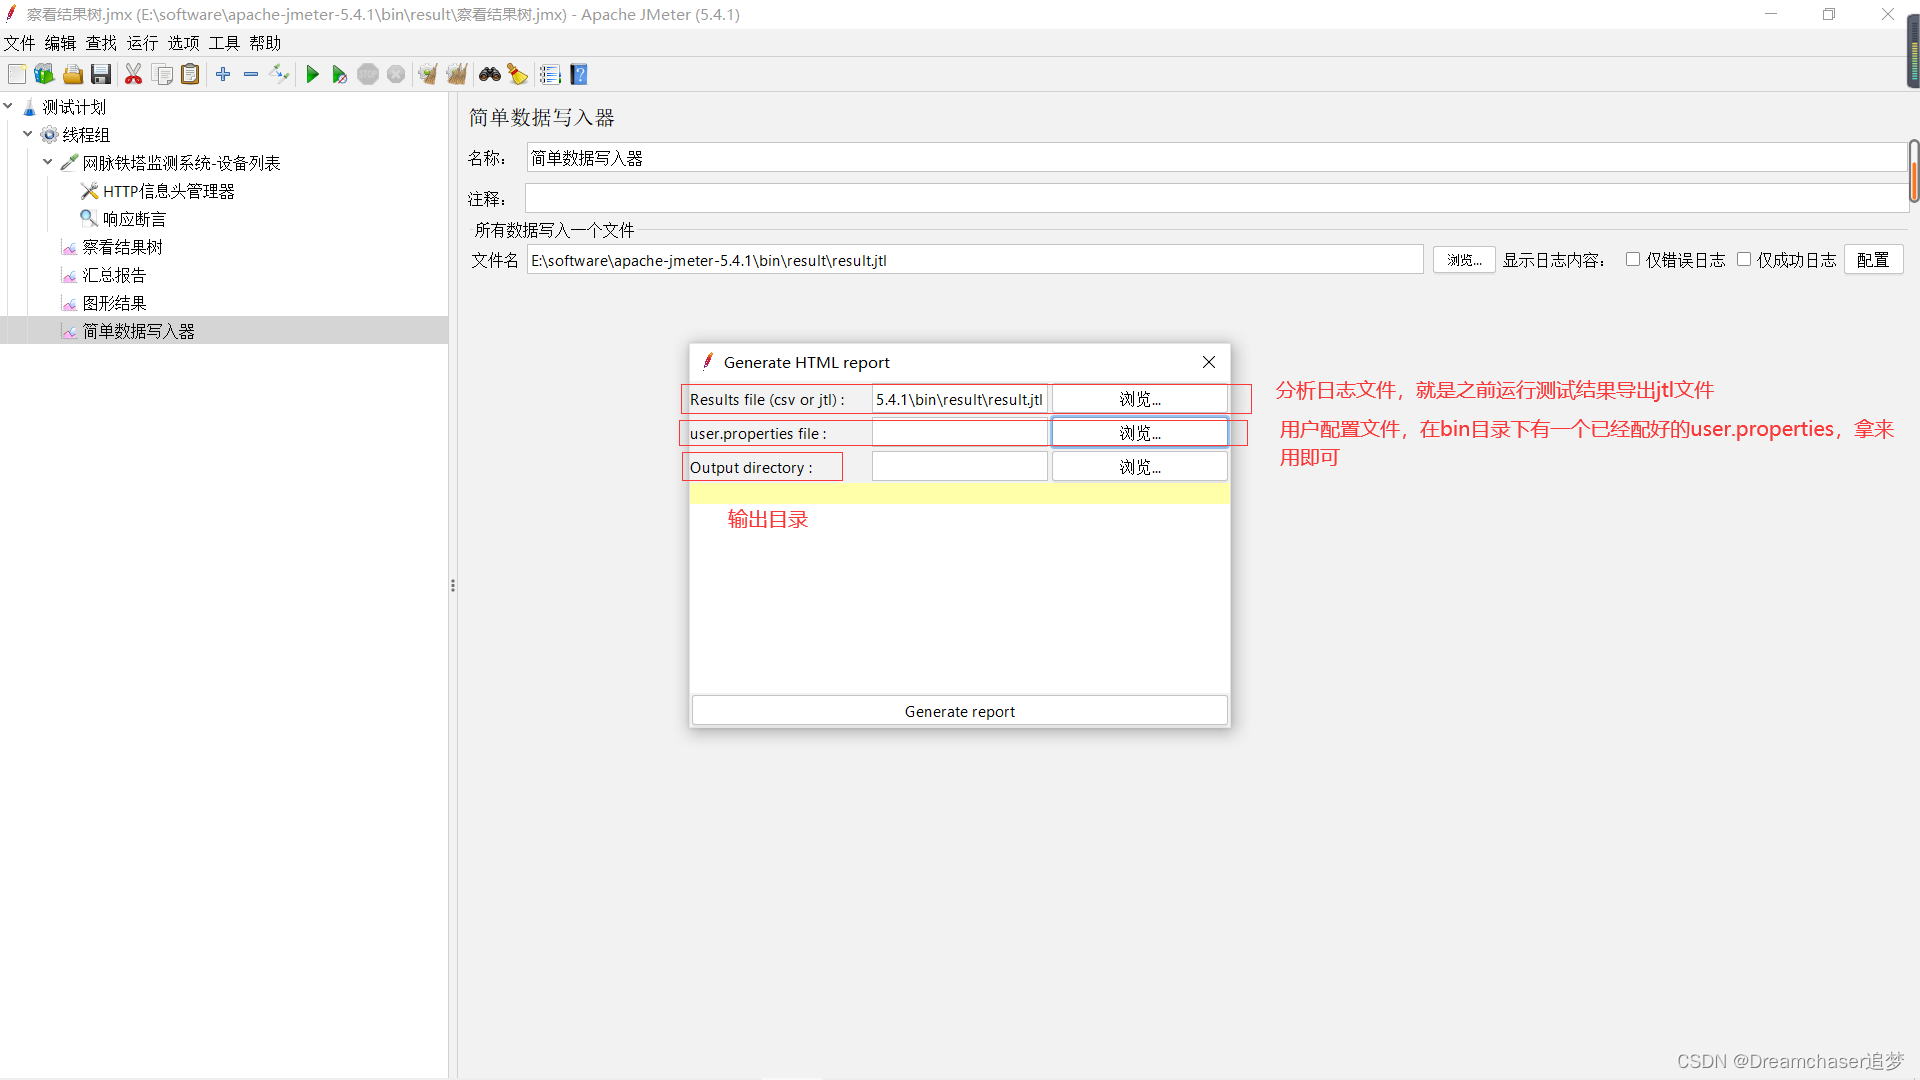
Click generate report to generate the report
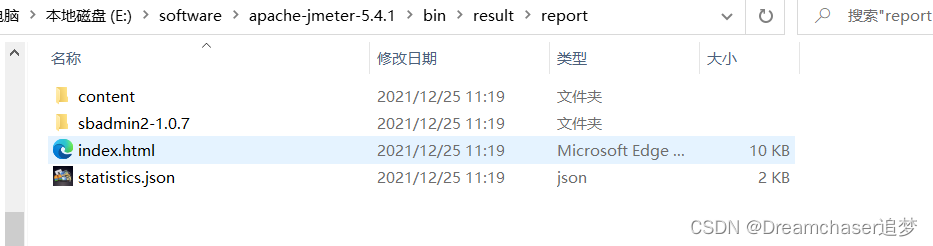
Click on index.html to see the test results
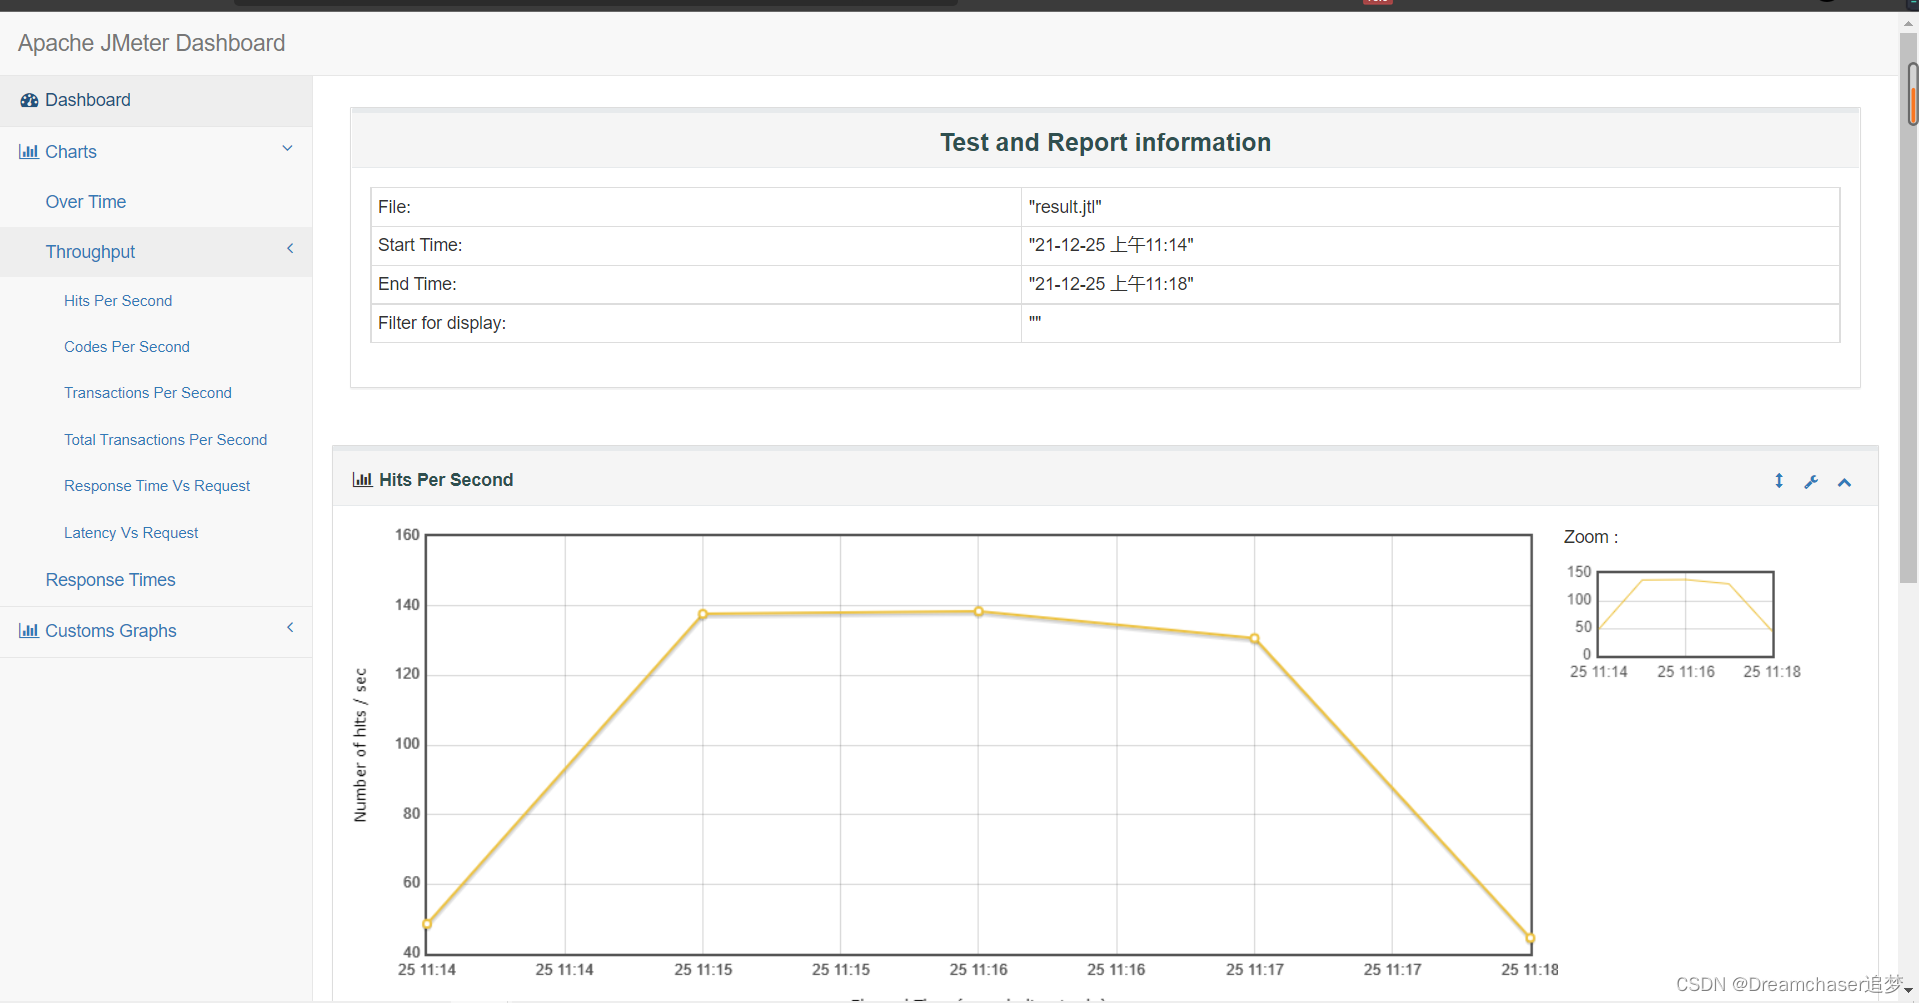
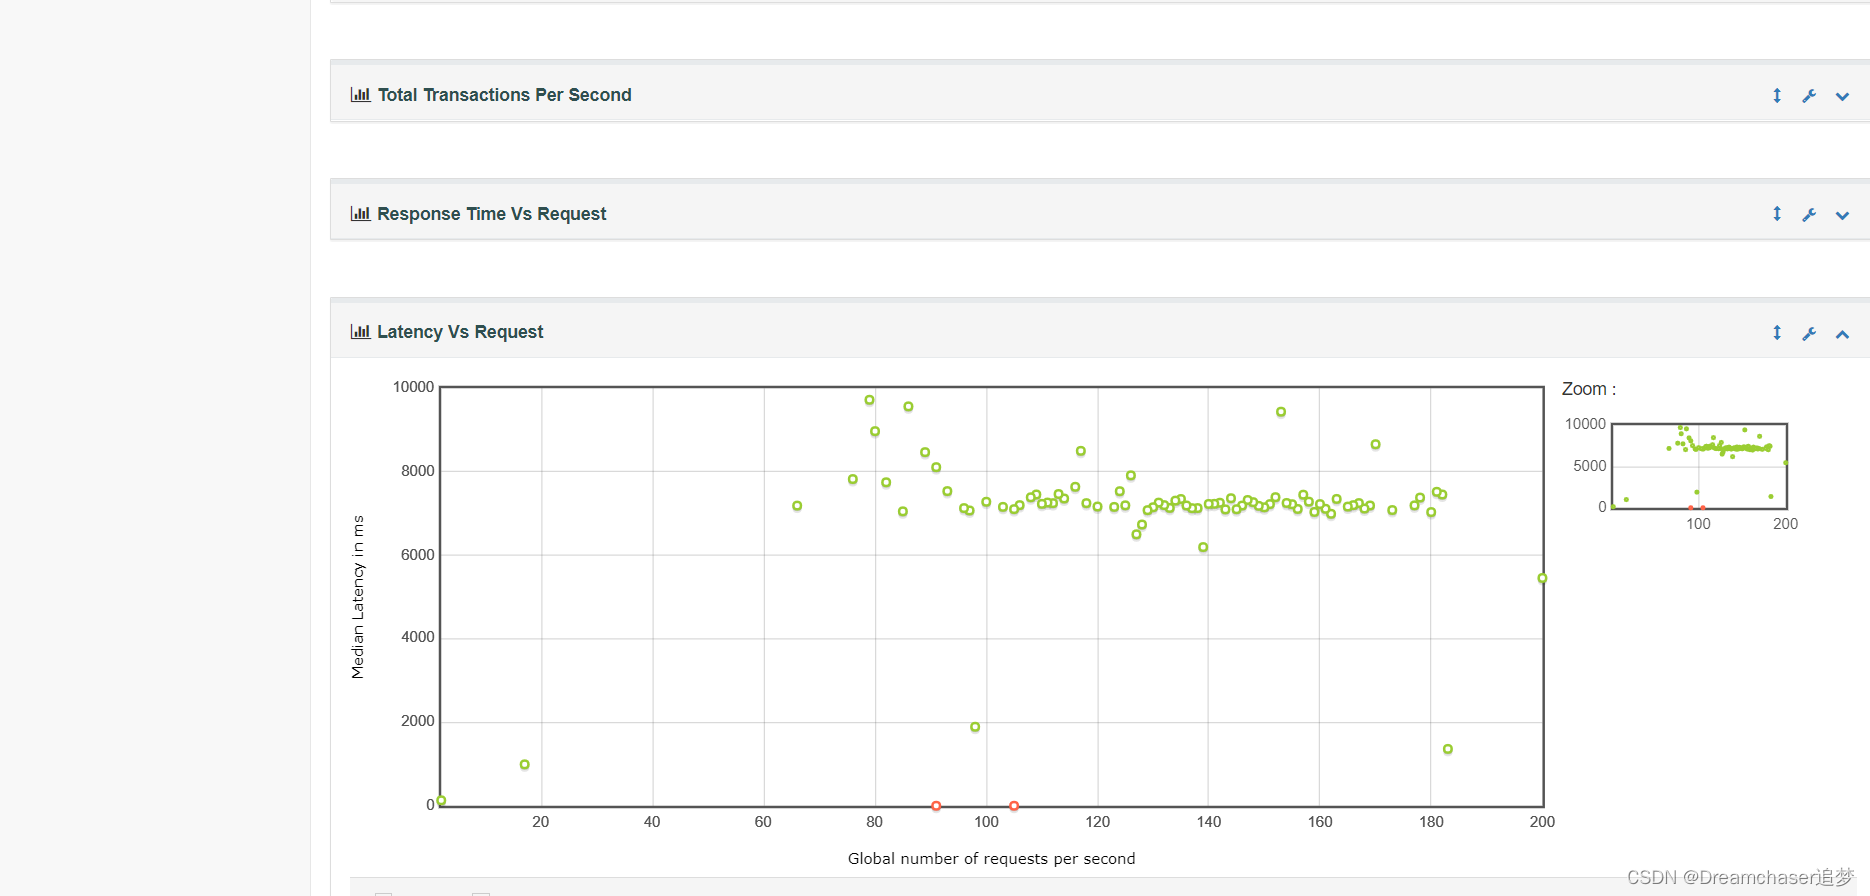
3. Analysis of results
There are many report charts, we need to pay special attention to the following:
① Success rate
In the dashboard, we can clearly see the proportion of successful requests. In this test, the success rate is 99.9%, which is completely acceptable.
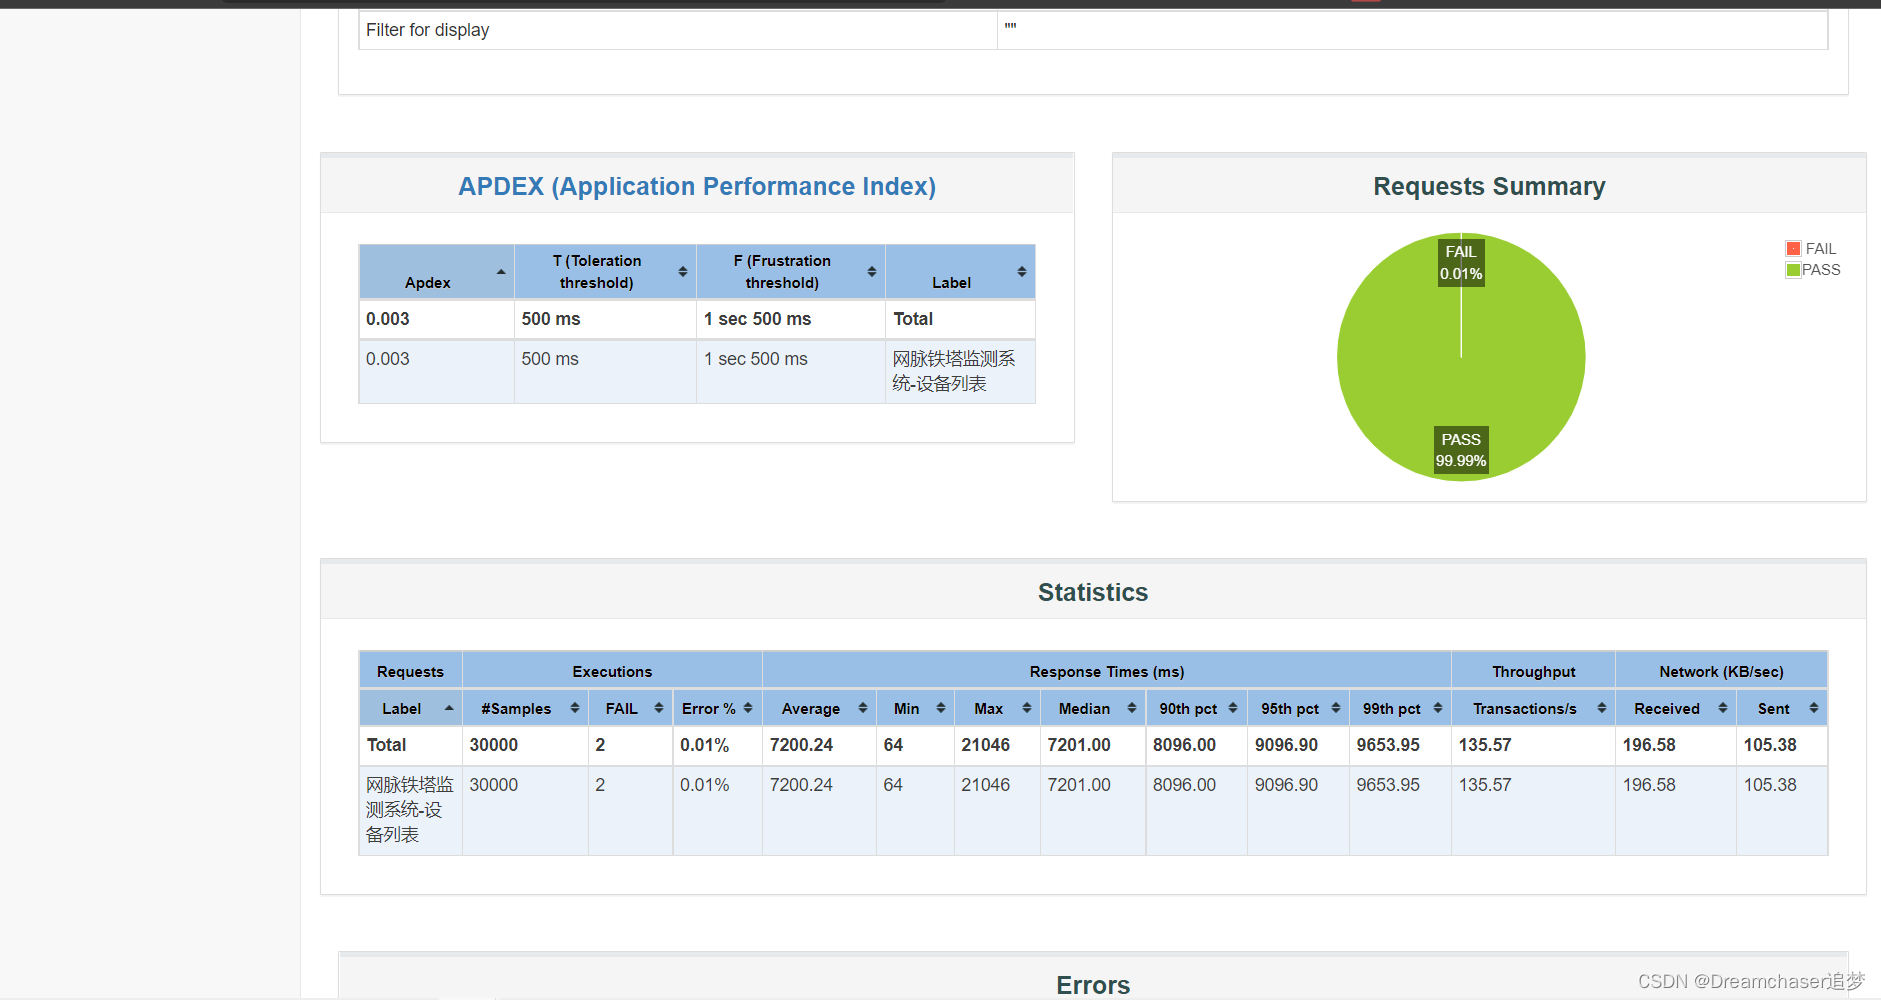
②Response time changes
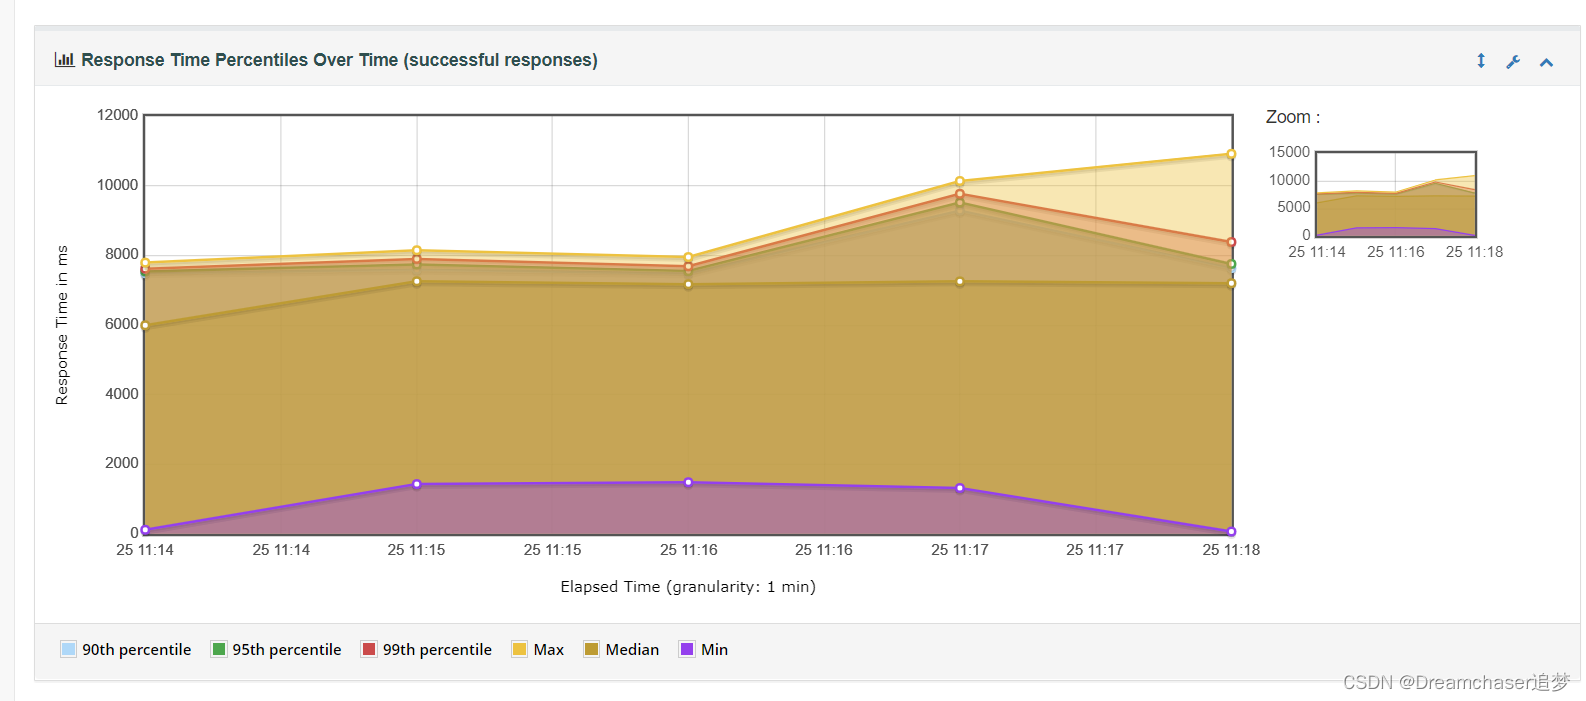
Here we can see the change of the response time in the test. The minimum value is generally not worth reference. The response time worth referring to is generally 90%-99% of the response time. We need to ensure that at least 90% of the request response time is acceptable to the user. Within the scope (the specific tolerable time varies depending on the specific business scenario)
In this test, the request duration reached a terrifying 9000ms, which is unbearable for ordinary users. Therefore, under 1000 users (1000 simulated threads), the system response cannot meet user expectations.
③TPS
TPS is the abbreviation of Transactions Per Second, the number of transactions processed per second.
This is one of the indicators we often use as a system performance, and it is also the most frequently mentioned word in microservice architecture.
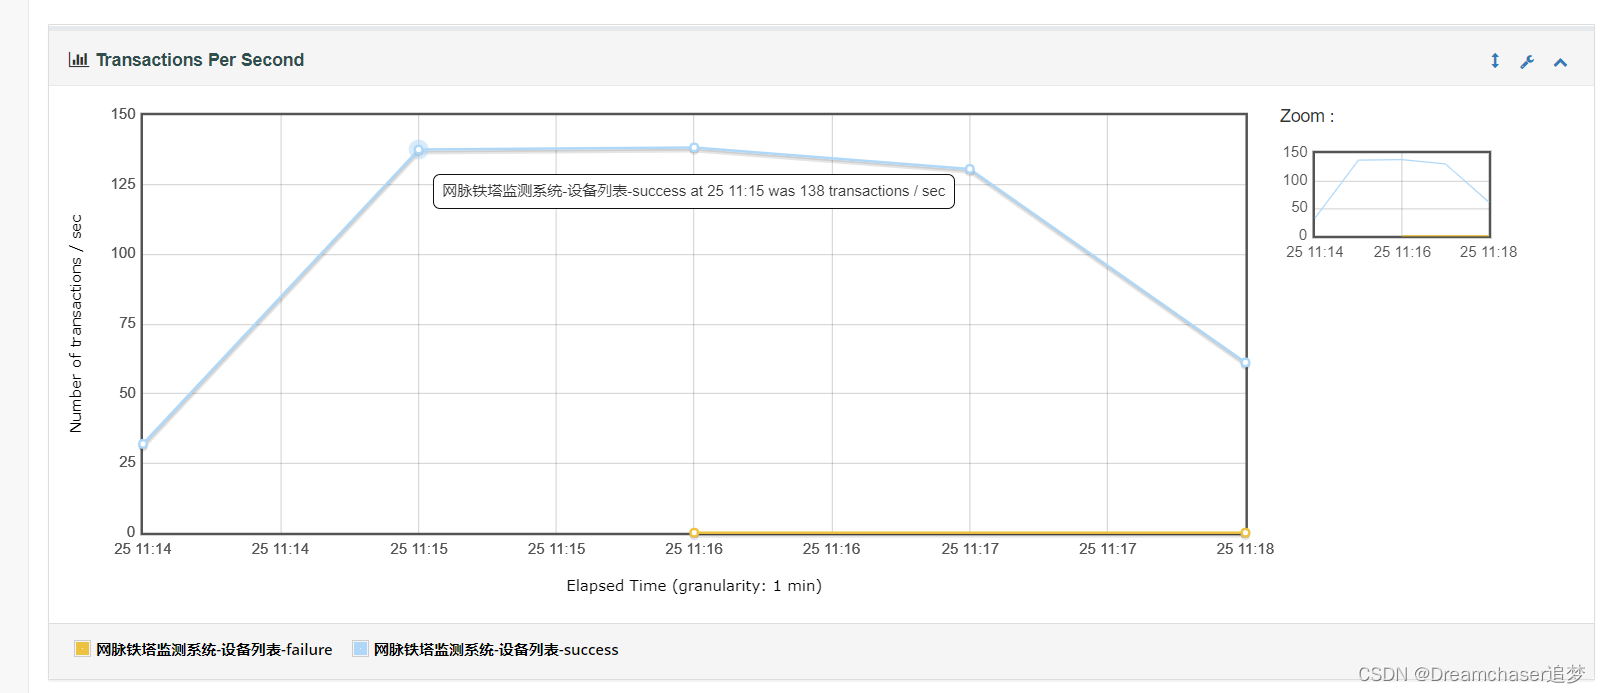
Here we can see that the TPS of the interface we tested is about 138.
4. Performance optimization scheme
According to the performance shown in the test report, we can judge the system bottleneck based on the actual CPU and memory load rate, and optimize it for our own business scenarios.
Since the blogger does not have much tuning experience, I won't repeat it here. If you encounter related problems in the future, you will come back and add it.
Finally,
I hope everyone can take their dreams as horses and live up to the splendor of life!
share with you