1 Overview
ELK = Elasticsearch + Logstash + Kibana
Elasticsearch real-time full-text search and analysis engine that provides collection, analysis, storage of data three functions; REST is an open and JAVA API and other structures to provide efficient search capabilities, scalable distributed systems. It is built on top of Apache Lucene search engine library.
Logstash is used to collect, analyze, log filtering tools. It supports almost any type of log, including system logs, error logs, and custom application log. It can receive log from many sources, these sources include the syslog, messaging (e.g. RabbitMQ) and the JMX, it is possible to output data in a variety of ways, including e-mail, and WebSockets Elasticsearch.
Kibana is a Web-based graphical interface for data relevant to the log, is stored in the analysis and visualization Elasticsearch Index. It uses Elasticsearch REST interface to retrieve the data, not only allows users to create customized dashboard view their own data, but also allows them a special way to query and filter data.
2. Service Management
2.1. Docker-compose Configuration
compose profile path: docker-elk / docker-compose.yml
You can set the parameters as needed compose
2.2. Start container
cd docker-elk
Start background #
docker-compose up -d
# View container

elasticsearch open ports 9200,9300
logstash open tcp port of 5000-5001,9600,5044
kibana open port 5601
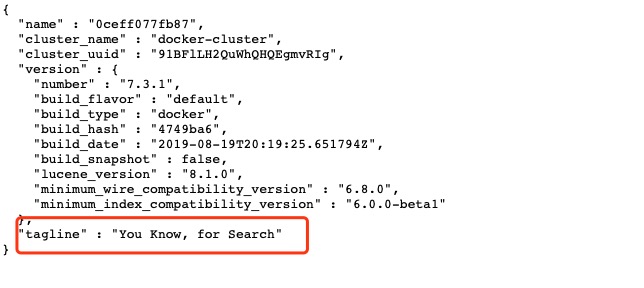
Elasticsearch verify the installation was successful: http: //192.168.1.165: 9200, if the installation was successful as shown below:
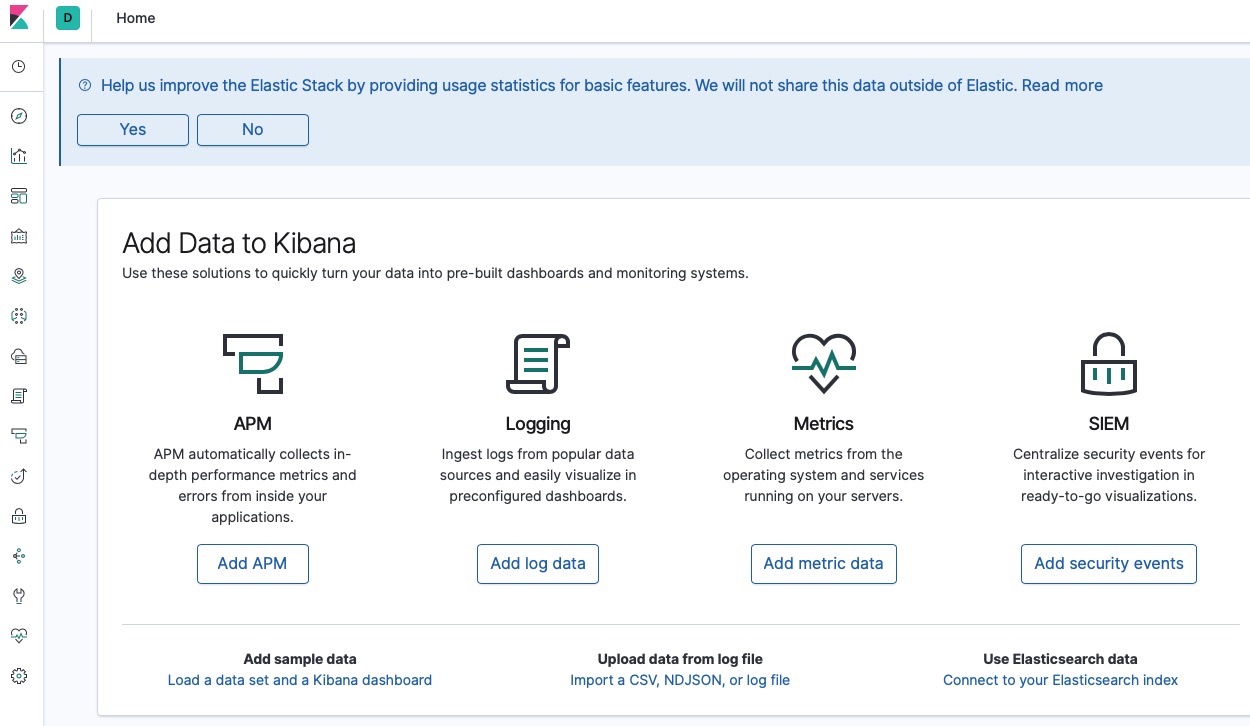
Kibana verify the installation was successful: http: //192.168.1.165: 5601, if the installation was successful as shown below:
2.2. Close the container
sudo docker-compose down -v
-v indicates empty data volume , the data volume will be stored empty elasticsearch
2.2. Restart container
sudo docker-compose restart without clearing the data volume
Modify the configuration of any elk when they are required to restart