1. Introduction
Many clinical diseases are manifested as an increase in the number of white blood cells, swelling, or changes in the shape and number of nuclei in white blood cells, so the study of the number and shape of white blood cells is of great significance. However, due to differences in staining conditions, smear preparation, image sources, sampling lighting conditions, and the occurrence of overlapping and adhesion between cells, subsequent analysis such as counting and identifying white blood cells becomes difficult. For this reason, dividing the adherent cells into individual cells has become a problem that must be solved in medical image processing. This article is based on MATLAB language for image processing and segmentation, accurate image processing, using watershed algorithm and threshold segmentation to achieve, on the basis of existing research, focusing on digital image processing technology to solve the idea of microscopic image cell counting, combined The main characteristics of blood red blood cells, setting the goals and requirements to be achieved, designing and implementing a fast and effective automatic counting system for the number of red blood cells in blood microscopic images.
1 Curriculum design task The
significance of cell number detection in real life is mainly reflected in the role of medicine. The cell number detection can be used to view and estimate the number of cells in the blood of patients or animals, such as estimating red blood cells, white blood cells, and platelets in the blood. The number of cells such as lymphocytes, lymphocytes, etc., and the number of cancer cells can also be detected to check the medical effect. Patients or animals can be treated according to this series of indicators.
(1) Preprocess the cell image;
(2) Perform image segmentation;
(3) Count the number of cells;
(4) Request to design a plan by yourself, write code to realize the above functions, and design a software interface for cell statistics.
2 Design principle
Image segmentation is based on a certain processable characteristic of medical image (such as optical density value, gray value, CT value, frequency spectrum, etc.), using the similarity in the medical image area and the difference between the areas The process of dividing into several disconnected regions.
Representing an image as a set of physically meaningful connected regions is to mark and locate the target and background in the image based on the prior knowledge of the target and the background, and then separate the target from the background or other pseudo-targets. Because these segmented regions are similar in some characteristics, image segmentation is often used for two different application purposes: pattern recognition and image understanding, and image compression and coding.
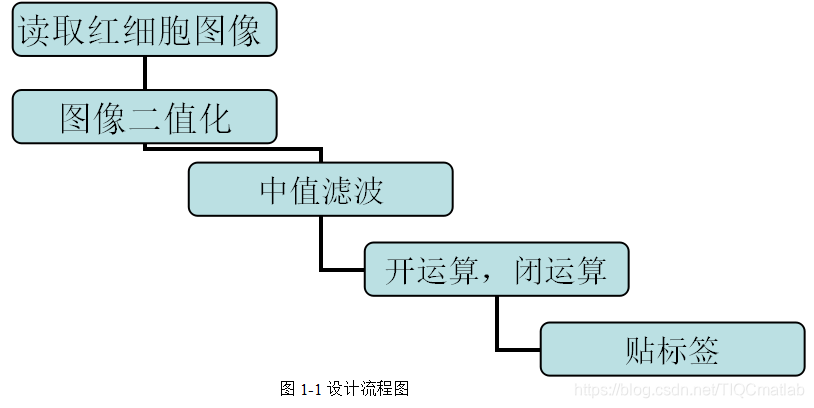
3 Design process
Process: First, convert the image into grayscale image and binary image in turn. Then perform median filtering on the binary image, and delete small-area objects (delete the black dots in the white bottom surface). Secondly, invert the image and delete small-area objects (equivalent to deleting the small white dots on the black underside of the binary image). Once again, morphological operations are performed on the image. Finally, the red blood cells are labeled, and the number of red blood cells is counted by labeling, and the goal is achieved.
Second, the source code
function varargout = untitled(varargin)
% UNTITLED M-file for untitled.fig
%      UNTITLED, by itself, creates a new UNTITLED or raises the existing
%      singleton*.
%
%      H = UNTITLED returns the handle to a new UNTITLED or the handle to
%      the existing singleton*.
%
%      UNTITLED('CALLBACK',hObject,eventData,handles,...) calls the local
%      function named CALLBACK in UNTITLED.M with the given input arguments.
%
%      UNTITLED('Property','Value',...) creates a new UNTITLED or raises the
%      existing singleton*.  Starting from the left, property value pairs are
%      applied to the GUI before untitled_OpeningFcn gets called.  An
%      unrecognized property name or invalid value makes property application
%      stop.  All inputs are passed to untitled_OpeningFcn via varargin.
%
%      *See GUI Options on GUIDE's Tools menu.  Choose "GUI allows only one
%      instance to run (singleton)".
%
% See also: GUIDE, GUIDATA, GUIHANDLES

% Edit the above text to modify the response to help untitled

% Last Modified by GUIDE v2.5 02-Dec-2015 08:59:09

% Begin initialization code - DO NOT EDIT
gui_Singleton = 1;
gui_State = struct('gui_Name',       mfilename, ...
                   'gui_Singleton',  gui_Singleton, ...
                   'gui_OpeningFcn', @untitled_OpeningFcn, ...
                   'gui_OutputFcn',  @untitled_OutputFcn, ...
                   'gui_LayoutFcn',  [] , ...
                   'gui_Callback',   []);
if nargin && ischar(varargin{

    1})
    gui_State.gui_Callback = str2func(varargin{

    1});
end

if nargout
    [varargout{

    1:nargout}] = gui_mainfcn(gui_State, varargin{

    :});
else
    gui_mainfcn(gui_State, varargin{

    :});
end
% End initialization code - DO NOT EDIT


% --- Executes just before untitled is made visible.
function untitled_OpeningFcn(hObject, eventdata, handles, varargin)
% This function has no output args, see OutputFcn.
% hObject    handle to figure
% eventdata  reserved - to be defined in a future version of MATLAB
% handles    structure with handles and user data (see GUIDATA)
% varargin   command line arguments to untitled (see VARARGIN)

% Choose default command line output for untitled
handles.output = hObject;

% Update handles structure
guidata(hObject, handles);

% UIWAIT makes untitled wait for user response (see UIRESUME)
% uiwait(handles.figure1);


% --- Outputs from this function are returned to the command line.
function varargout = untitled_OutputFcn(hObject, eventdata, handles)
% varargout  cell array for returning output args (see VARARGOUT);
% hObject    handle to figure
% eventdata  reserved - to be defined in a future version of MATLAB
% handles    structure with handles and user data (see GUIDATA)

% Get default command line output from handles structure
varargout{

    1} = handles.output;


% --- Executes on button press in pushbutton1.
function pushbutton1_Callback(hObject, eventdata, handles)
axes(handles.axes1);
I=imread('blood.BMP');
 imshow(I);
% hObject    handle to pushbutton1 (see GCBO)
% eventdata  reserved - to be defined in a future version of MATLAB
% handles    structure with handles and user data (see GUIDATA)


% --- Executes on button press in pushbutton4.
function pushbutton4_Callback(hObject, eventdata, handles)
axes(handles.axes2);
I=imread('blood.BMP');
 imshow(I);
gg=im2bw(I);
imshow(gg)
% hObject    handle to pushbutton4 (see GCBO)
% eventdata  reserved - to be defined in a future version of MATLAB
% handles    structure with handles and user data (see GUIDATA)


% --- Executes on button press in pushbutton5.
function pushbutton5_Callback(hObject, eventdata, handles)
axes(handles.axes2);
I=imread('blood.BMP');
imshow(I);
gg=im2bw(I);
imshow(gg)
J=medfilt2(gg,[3 3]);
imshow(J);
% hObject    handle to pushbutton5 (see GCBO)
% eventdata  reserved - to be defined in a future version of MATLAB
% handles    structure with handles and user data (see GUIDATA)


% --- Executes on button press in pushbutton6.
function pushbutton6_Callback(hObject, eventdata, handles)
axes(handles.axes2);
I=imread('blood.BMP');
imshow(I);
gg=im2bw(I);
imshow(gg)
J=medfilt2(gg,[3 3]);
imshow(J);
M=gg|J;
imshow(M);
% hObject    handle to pushbutton6 (see GCBO)
% eventdata  reserved - to be defined in a future version of MATLAB
% handles    structure with handles and user data (see GUIDATA)


% --- Executes on button press in pushbutton7.
function pushbutton7_Callback(hObject, eventdata, handles)
axes(handles.axes2);
I=imread('blood.BMP');
imshow(I);
gg=im2bw(I);
imshow(gg)
J=medfilt2(gg,[3 3]);
imshow(J);
M=gg|J;
imshow(M);
R=~M;
imshow(R)
% hObject    handle to pushbutton7 (see GCBO)
% eventdata  reserved - to be defined in a future version of MATLAB
% handles    structure with handles and user data (see GUIDATA)


% --- Executes on button press in pushbutton8.
function pushbutton8_Callback(hObject, eventdata, handles)
axes(handles.axes2);
I=imread('blood.BMP');
imshow(I);
gg=im2bw(I);
imshow(gg)
J=medfilt2(gg,[3 3]);
imshow(J);
M=gg|J;
imshow(M);
R=~M;
imshow(R)
F=bwfill(R,'holes');
imshow(F);
Three, running results

Four, remarks
Complete code or write on behalf of adding QQ 1564658423