Logs in ES use Grafana for monitoring and alerting
One, Grafana powerful drawing tool
-
Introduction to
Grafana Grafana is an open source measurement analysis and visualization suite. It is often used as a visualization of time series data and application analysis in infrastructure. It is also widely used in other fields including industrial sensors, home automation, weather and process control, etc. Grafana supports many different data sources. Each data source has a specific query editor, and the customized features and functions of the editor are public specific data sources. The following data sources are officially supported: Graphite, InfluxDB, OpenTSDB, Prometheus, Elasticsearch, CloudWatch and KairosDB. The query language and capabilities of each data source are different. You can combine data from multiple data sources into a dashboard, but each panel is bound to a specific data source, and it belongs to a specific organization. Let's take a look at grafana together. -
Log in to grafana
login address: http://elk.grafana.com/?orgId=1 -
Add elasticsearch data source
- Click Configuration->Add data source
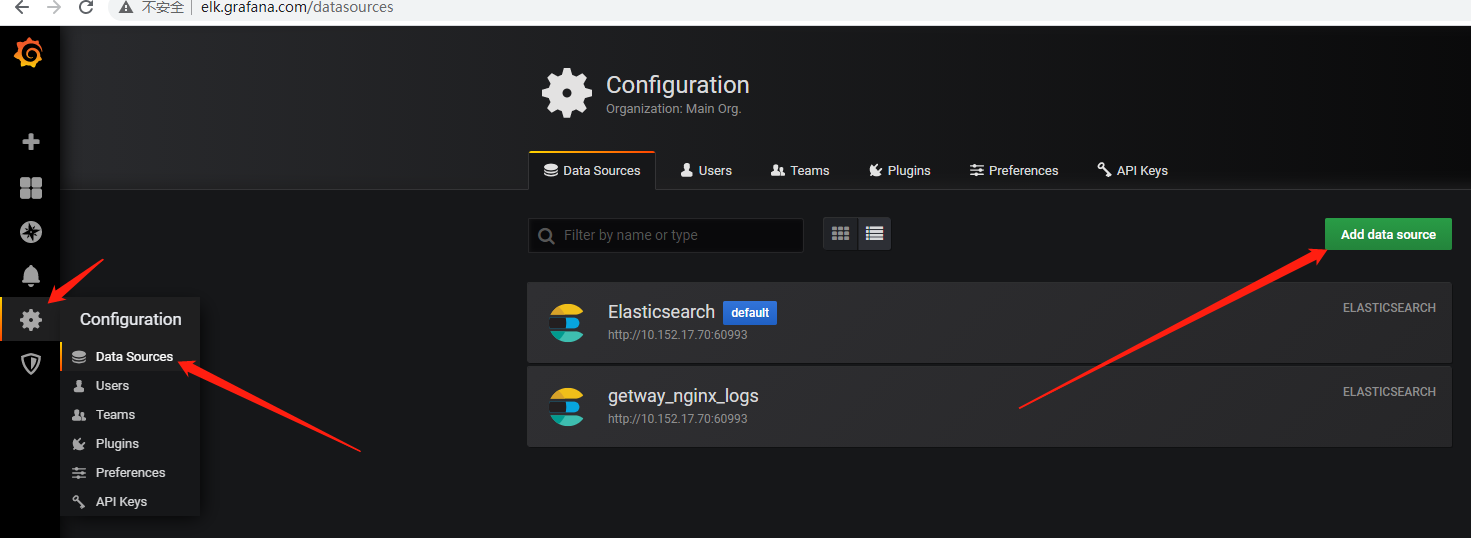
- Configuration

- Click Configuration->Add data source
-
Add alert component
Click Alerting to add, here I choose Prometheus Alertmanager (the reason is that I have to use Alertmanager for other monitoring, which is convenient for unified management)
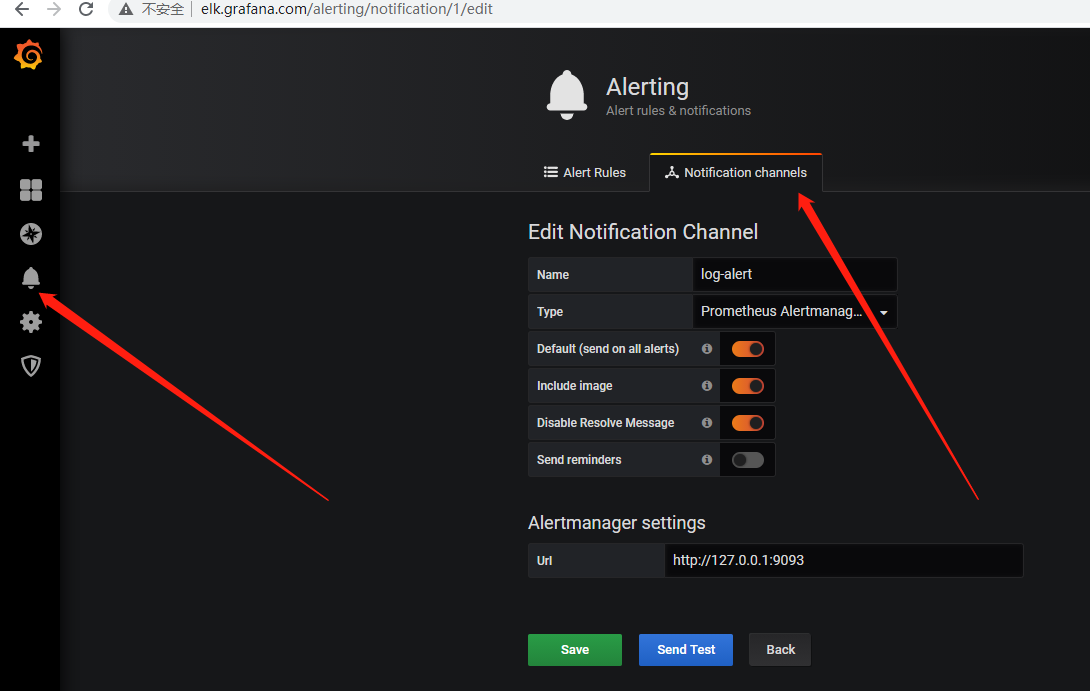
How to set up ES data alarms
-
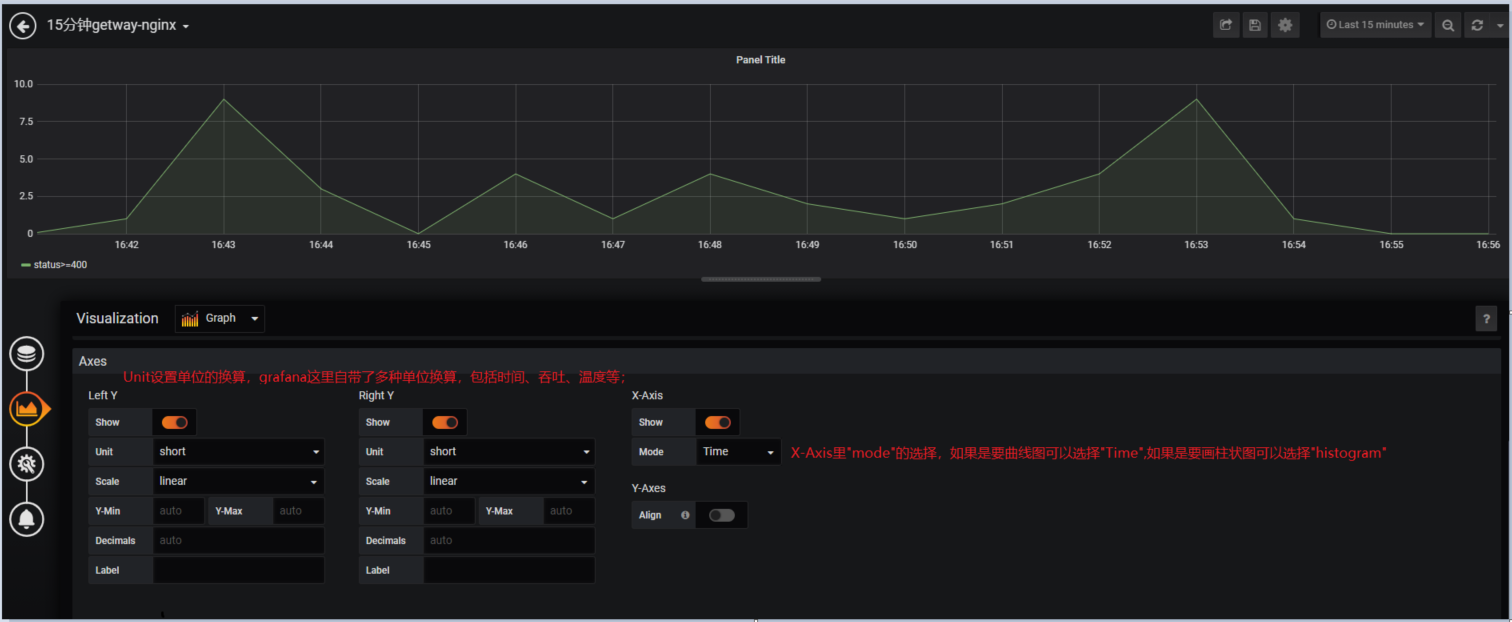
Query indicator data


-
Axes option
Here you can define the X axis and Y axis
-
Legend option
This is mainly to set the display text on the map. If you do not check "show", the related value information will not be displayed on the map.

-
General settings

-
Create alarm


verification


- Comparing the results, the
records are exactly the same - Alert
