Data analysis thinking method
Author: Yang Nannan, Li Kaidong, Chen Xintao
Source "Data Product Manager: Advanced combat"
01 Full link analysis
Full link analysis refers to the analysis and research of each node of the full link. It is a very important analysis idea and the most important idea for product managers. The well-known funnel analysis and AARRR model are typical full-link analysis (as shown in the figure below).

There are many commonly used business models that belong to the overall node monitoring in the full link analysis, such as the life cycle (user life cycle, commodity life cycle, product life cycle, etc.).
The steps of full link analysis are as follows:
- Sort out the key nodes of the link and determine the index of each node;
- Perform node insights, analyze the data of each node, and view problem points and growth points.
We use a case where the background is an advertising platform to explain the steps of full link analysis. The role of the advertising platform is to unify the docking of various media, so that advertisers can buy the traffic of each media on the advertising platform.
The first step: sort out the key nodes and determine the indicators of each node
At the beginning, the whole link process of the advertising industry was sorted out like this:
- The media sends an advertisement request;
- The advertising platform returns advertisements for some of the requests;
- Media display advertising;
- The user clicks on the ad;
- The advertising platform deducts advertising fees (this is the revenue of the advertising platform).
The key nodes and indicators sorted out are shown in the figure below. In the figure, each ratio indicator is the ratio of the data of the next node to the data of the previous node. Note that in addition to the index value of this node, the node index can also refer to the ratio index.

The full link formula is CPC, ie 收入=PV×PV展示广告的比例×广告位数量×点击率×平均点击价格.
At this point, the indicator system has been established and can be used for key node monitoring. It is necessary to sort out every node in the middle. If there are missing nodes in the middle, it means that there is an omission of ideas and problems are prone to occur. Especially when the amount of data is large and there are many data transfer systems, the nodes must be finer.
After a period of use, the author found that many nodes were missed, that is, after the advertising platform returns the data to the media, it will be displayed to users by the media after bidding and ranking. After improvement, the monitored node becomes the first in the figure below. Two ways.
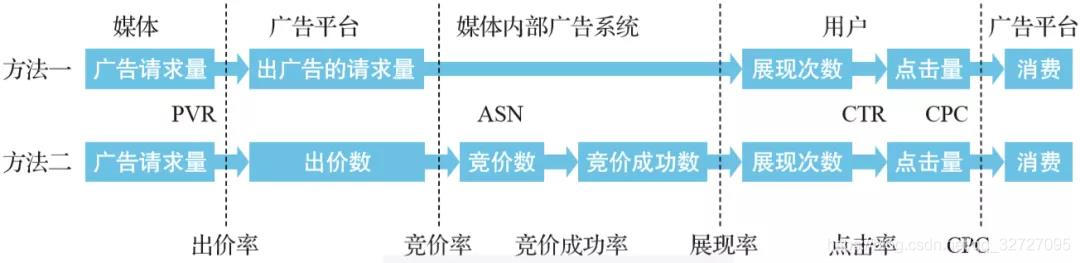
At this time, the full link formula becomes
收入=实际请求数×出价率×参与竞价率×竞价成功率×(1-响应超时率)×点击率×平均点击价格
This formula is basically the same as the previous formula, just to make the monitoring more perfect, a few nodes have been added.
Step 2: Provide in-depth insights into each node
If you are only completing the first step, full link analysis can only be used for monitoring. To get specific problems and solutions, you must conduct in-depth insights into each node and sort out the influencing factors of each node, as shown in the following figure.
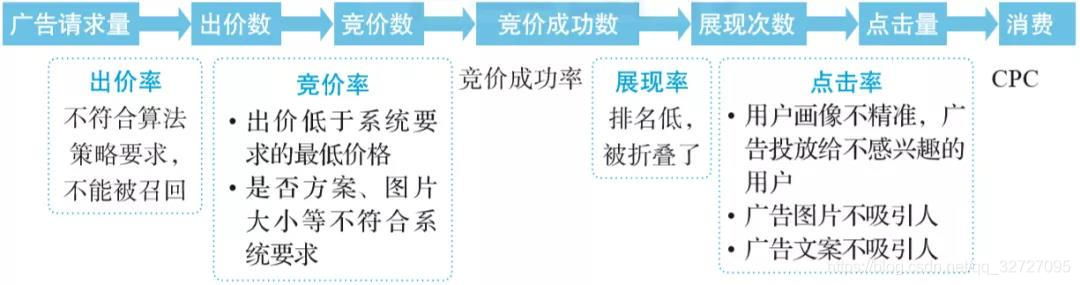
At each node, there are many reasons for the low traffic conversion efficiency of this node. After such a combing, the root cause can be found, and then solutions can be given in a targeted manner.
When the product manager is in charge of a project, it is such a node-by-node optimization to complete the overall data. It can be seen that full-link analysis is a must-have idea and skill for product managers.
02 Composition factor decomposition
The process of dividing the overall index data into different factors according to a certain classification standard is called composition factorization. The overall goal is equal to the sum of all the constituent factors. Taking the total revenue of the advertising platform as an example, the composition factors are broken down as shown in the figure below.

The overall index data can only let people see the results of the goal achieved, but they cannot know how the goal was achieved, nor the details of the implementation, let alone how to improve. The composition factor decomposition can first clarify the thinking, clearly list the factors that make up the result, and formulate corresponding strategies for different factors.
Case study: Once in a channel analysis, the composition factor was used to decompose: total cost = type A channel cost + type B channel cost. However, it was later discovered that the cost of Type A channels was 1.6 times that of Type B channels, while effective users were 2.4 times that of Type B channels (see the table below). Prior to this, the B-type channel had a very good effect in the experience of other projects, so the marketers spent their energy on the B-type channel. After seeing this data, they immediately decided to contact all the A-type channels on the market in order to expand High-quality traffic.
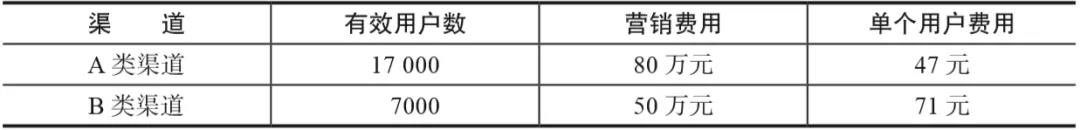
If you only look at the overall cost, you can't get such a conclusion, and you can't make useful suggestions.
There are many ways to disassemble any indicator. For example, there are several ways to decompose the composition factor of the total flow.
- Split by time. Whether the data has changed in different time periods.
- Split by channel. The flow of different channels will be different.
- Split by user. The traffic of new users and old users will be significantly different. In a company I have worked with, the traffic of old users is far greater than that of new users. In this case, it is necessary to find ways to promote the traffic of new users.
To try a variety of ways, experiment with the best factorization method.
It should be noted that how to decompose the composition factor represents the first dimension of thinking about the problem and directly affects whether a useful conclusion can be obtained. All subsequent strategies and interpretations are based on the factorization of the first step.
- Give priority to the dismantling ideas that business teams are used to. For example, advertising companies will divide customers into large customers, small and medium customers.
- Be brave to try, don't solidify your thinking.
Case study: We have done a project before, and we decompose the composition factors according to "income = mobile terminal revenue + PC terminal revenue" and found that mobile terminal revenue has risen rapidly. However, the thinking of the senior executives at that time was still "sales = traffic × conversion rate × customer unit price", and they calculated that "a customer unit price increase by x yuan will increase sales by x yuan." According to this line of thinking, resources were invested in the increase in the unit price per customer, instead of being invested in the mobile terminal. After discovering the advent of the mobile era, and then starting to build a team and buy traffic, the cost has become very high.
It can be seen from this case that how to factorize determines how to think about the components of the goal, that is, how to think about deeper issues such as solutions and resource allocation. Therefore, always try to see if there are other factorization methods. If you are limited by experience and solidified thinking, you may miss opportunities.
03 Impact factor disassembly
In many cases, the influence of factors on the results is qualitative, and the result cannot be completely divided into the addition of multiple factors. At this time, the impact factor disassembly method can be used to list all the factors that have an impact on the result, and analyze them one by one. . For example, for sales, the influencing factors are products, members, customer service, traffic, activities, etc., but it cannot be said that sales = products + members + customer service + traffic + activities.
The picture shows the disassembly of common influencing factors of B2C order conversion rate.
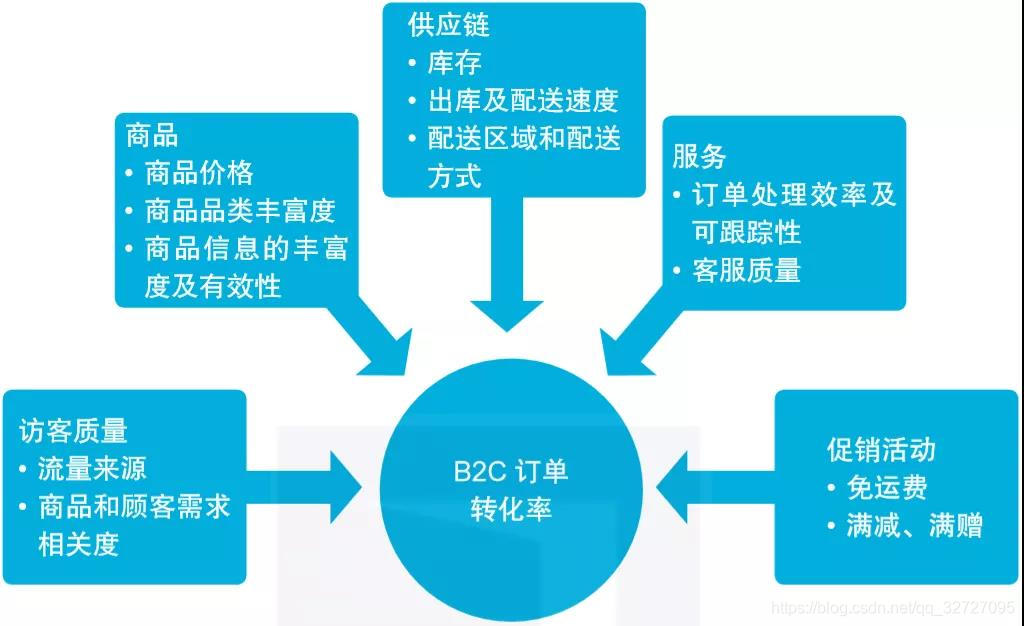
The impact of impact factors on the results is qualitative and cannot be directly derived. If you want to increase growth through impact factor decomposition, testing is a good way.
Case study: There is a SaaS software team, and the client is a small startup company. After analysis, the team believes that one of the factors that affect the purchase conversion rate is the number of customers in the customer team. If the team is small, they will not buy this kind of efficiency-improving software. So they did a test on the indicator of the number of customers in the team: 3 people, 10 people, and 5 people, and kept trying to see which value gives the highest conversion rate.
Impact factors can also be used to make PPT frameworks. Before doing data analysis, if we already know the purpose of the analysis, we need to consider which angles to achieve the purpose of the analysis. This kind of thinking is generally used.
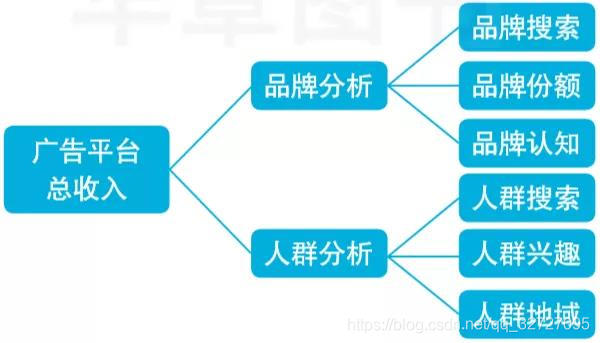
Case: A customer’s requirement is to check the effect of an event. For brand customers, we believe that the effects of the campaign include brand analysis and crowd analysis. Under such a split, the PPT framework comes out, as shown in the figure below.
04 Enumeration
The enumeration method enumerates all the data one by one, and then conducts subsequent analysis. Enumeration is the most commonly used method for strategic product managers to analyze data daily. Of course, it is also very useful for other types of data product managers.
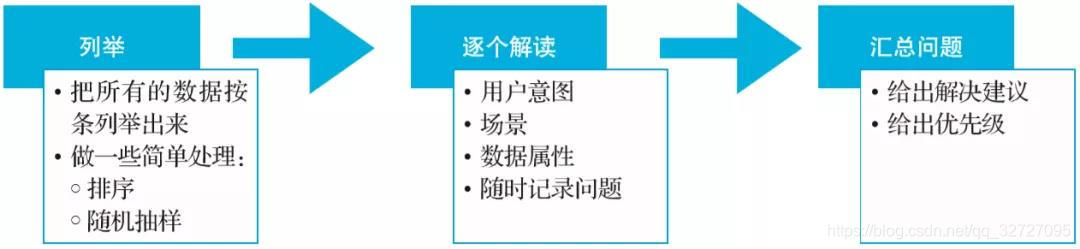
The general analysis steps of the enumeration method are shown in the figure below.
Give another example of search optimization. Algorithmic products, such as search, recommendation, advertising, etc., can use this idea when using enumeration.
Case: The analysis of search click rate is as follows.
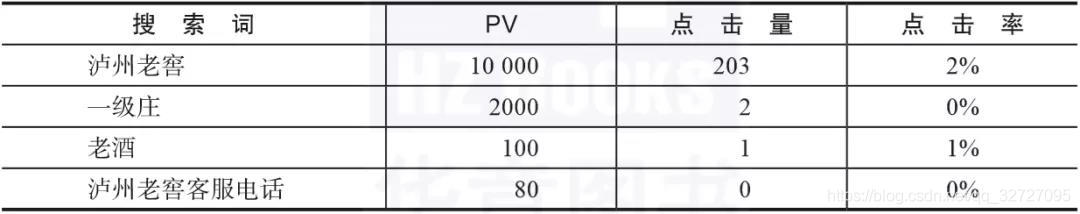
1) Data enumeration
Take out the search query list and the data indicators used for analysis
2) Interpretation one by one
Interpret the data and features one by one, and work step by step to restore the user's real usage scenarios and ideas through these data, so as to get the reason why the user does not click.
Through the above interpretation, we come to the following problems or growth points.
- Proper noun search does not recognize . There are some industry-specific nouns, search engines can’t find the corresponding results, but can only find the results of text recognition. For example, searching for "old wine" will display products such as "Luzhou Laojiao Wine", so the click-through rate low.
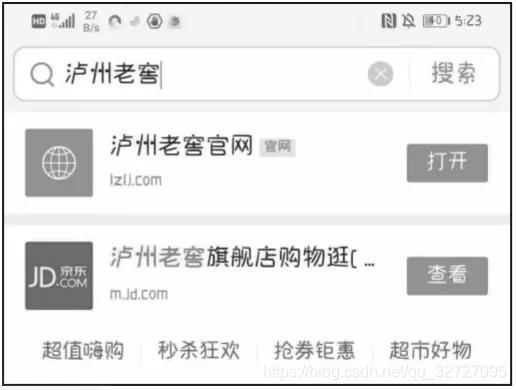
- Brand words . For brand terms, the general search results are not too problematic. However, when users search for brand terms, if they give users more authoritative and professional content, such as the brand's official website, flagship store, etc., wouldn't the user experience be better? For example, users search for brand words like "Luzhou Laojiao" and directly show them to the official website of Luzhou Laojiao, allowing users to see authoritative, professional, and comprehensive information. Figure 2-9 shows the processing method of the search sug page of the QQ browser.
- For the search terms of the customer service phone, the customer service phone can be directly displayed on the page, and the user can see it without jumping to the link in the search result page, thereby reducing user operations and improving the experience. Figure 2-10 shows Baidu's approach.
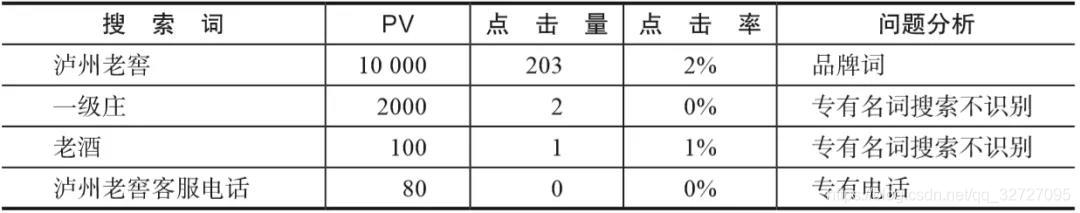
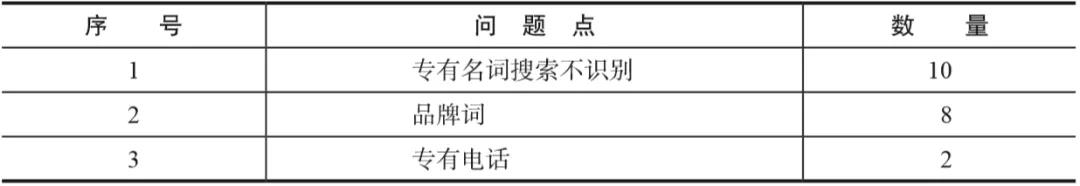
- Summarize the problems and give solutions and priorities. The problem summary is generally similar to Table 2-4.
▲Figure 2-9 Search sug page results of brand words on QQ browser

▲Figure 2-10 Phone words on Baidu search result page
▼Table 2-4 Summary of problems
In this way, through the enumeration method, the product manager can clearly understand the existing problems of the product, and give solutions and priorities.
When enumerating, one by one is certainly the basic skill of the product manager, but when faced with a large amount of data, this method is too inefficient. If you want to quickly grasp the key points, you need to use two kinds of thinking: sort thinking and sampling thinking .
1. Order thinking
Sorting refers to sorting an indicator in descending order and ascending order, and then analyzing it according to the above-mentioned enumeration method. The purpose of sorting is to confirm the area of concern. When a product manager is faced with a large amount of data, he needs to first determine which part of the data can bring the most benefits. For example, it can be sorted and analyzed in the following manner.
- Sort the PV in descending order to see how many search terms account for 90% of the total PV, focus on these few words, and call all resources to optimize them.
- Or sort them in descending order of clicks, see which search terms 90% of the clicks occur on, and call all resources to optimize them.
- Member and product data can also be viewed in this way. The author has done many types of Taobao stores before. Although those stores can have sales of hundreds of millions of yuan a year, there are actually two or three products with sales (daily orders greater than 100).
Case study(From customer statement): Although we bought a lot of keywords, only two keywords can bring traffic. So as long as these two main keywords are optimized, the money spent on data can be earned back. We treat these words like a baby, and conduct various tests and optimizations on them.
In actual use, the conclusions obtained by sorting only once are not comprehensive. In order to obtain more comprehensive information, product managers generally use multiple sorting and sorting multiple indicators.
A weekly click-through rate analysis for a complete search is as follows.
1) Sort by PV in descending order, and filter out high-frequency words, That is, the search term with large PV. High-frequency words can contribute most of the best results and the highest click-through rate.
- Sorted in descending order by PV increase. Screened out soaring words, soaring words are high-frequency words that need special attention, because they often represent new user needs or new market changes.
- Sort by ascending click rate. In this way, you can see the words with lower click-through rate among the high-frequency words, and optimizing them can bring faster improvement.
2) Sort out low-frequency words in ascending order of PV. 2% of the search terms accounted for 98% of the PV, and the remaining 98% of the words can be classified as low-frequency words. Low-frequency words are the best measure of how good a search engine is, because a large amount means a large number of users. Low-frequency words include most long-tail words, synonyms, question-and-answer words, unrecall words, no result words, words without clicks, and words without a deal. Badcase is basically generated from here.
The recall of low-frequency words is a very troublesome thing, and the algorithm is difficult to choose, because these are long-tail requirements, and there are not enough user behaviors to learn. How to give the corresponding match requires very in-depth study and analysis.
2. Random sampling
The way of enumeration can quickly see the problem, but it cannot guarantee the typicality of the problem; after adding the sorting thinking, the scope can be delimited, but it may cause deviation, because it does not represent all user behaviors. So, how can we see all user behaviors while ensuring the typicality of the problem? The answer is random sampling .
All data can be randomly sampled, or stratified sampling, that is, the overall data is stratified first, and then sampling for each layer.
Random sampling is relatively simple, and the commonly used scenarios are as follows.
- The daily work of the product manager .
- Look at randomly sampled data at least once a week to get an idea of product user behavior.
- I will watch it daily before and after the launch to understand the impact of the new strategy on users.
- Project feasibility judgment . If you want to know whether a project is feasible, you can take a sample first. The author has frequent contact with data from various media for a period of time to evaluate the quality of the media, mainly by sampling . The media will give us some real data. After we sample it, we start to make an assessment, including whether it has commercial value and the technical difficulty required. This example is mainly to tell everyone that the simple method of sampling sometimes directly affects strategic decision-making.
- Any need to understand the whole picture . For example, after the project function is launched, you need to understand the users as a whole in order to formulate a promotion plan. At this time, you can sample.
This section talks about enumeration and enumeration thinking that needs to be used, using the search case, so is this kind of thinking only needed for strategic product managers? of course not. Enumeration is the basic skill of all product managers .
For example, if you select 100 users every day to see their behavior and persist for a period of time, you will have a very in-depth understanding of the users. You will see which pages users often hover on, and you can also infer the age and occupation of these users.
The enumeration method will subtly improve the product manager's understanding of users. Every time we look at the enumerated data, we will have a better understanding of user behavior.
Product managers often face emergencies, or inquiries from leaders, or decisions on big and small matters. For example, there is a small problem in the project, whether it is going online or rolling back; suddenly it is discovered that the original solution will cause performance problems, and it is necessary to temporarily change a solution; developers and testers recommend other solutions; the leader suddenly asks if you want to follow up with competing products New changes.
Under these circumstances, product managers almost always have to draw conclusions immediately, and there is no time for detailed and comprehensive analysis. It is too late to make analysis reports or find detailed data to view. So what can product managers rely on? It depends on your understanding of the user.
Therefore, we have to look at the data from various angles every day, so that we can have in-depth insights, know the scope of impact of each problem, and deal with various situations.