Preface
The importance of GC to Java is self-evident, whether it is the tuning of the JVM in the weekdays or the relentless bombing in the interview.
In this article, I will expand the content about GC with one question and one answer.
But before that, it is strongly recommended to read this article to reveal the bottom layer of garbage collection in depth .
Because this article explains a lot of basic knowledge about garbage collection , it is important to understand the direction of garbage collection and the evolution of the ever-developing garbage collector from the source .
If the GC implementation mentioned in this article has no special instructions, it refers to HotSpot by default.
I will list all eighteen questions first. If they are all clear, then I can close this article.
Okay, let's start acting.
Young gc, old gc, full gc, mixed gc are silly and confused?
The precondition for this problem is that you have to know the GC generation and why. This was mentioned in the previous article, if you don’t know, you can go to see it.
Now let's answer this question.
In fact, GC is divided into two categories, Partial GC and Full GC.
Partial GC means partial collection , divided into young gc, old gc, and mixed gc.
- young gc: Refers to the GC that only collects the young generation.
- old gc: refers to the collection of GC in the old age alone.
- mixed gc: This is unique to the G1 collector and refers to the collection of the entire young generation and part of the old generation GC.
Full GC is the whole heap collection , which refers to the collection of the entire heap, including the young generation, the old generation, and if there is a permanent generation, it also includes the permanent generation.
In fact, there is also the term Major GC. In the "In-depth Understanding of the Java Virtual Machine", this term refers to the GC in the old age alone, which is equivalent to old gc, but there are also a lot of information that it is equivalent to full gc of.
There is also Minor GC, which refers to the young generation gc.
What is the trigger condition for young gc?
Generally speaking, young gc will be triggered when the eden of the young generation is almost full.
Why say it roughly? Because there are some collectors' recovery implementations that will execute the following young gc before full gc.
For example, Parallel Scavenge, but there are parameters that can be adjusted so that it does not perform young gc.
There may be other implementations that also have this kind of operation, but under normal circumstances it is considered that the eden area is almost full.
There are two triggers for eden to be full. One is insufficient memory allocated for the object, and the other is insufficient memory allocated for TLAB.
What are the trigger conditions for full gc?
This trigger condition is a little bit more, let's take a look.
- When the young gc is about to be performed, according to previous statistics, it is found that the average promotion size of the young generation is larger than the remaining space of the old generation, and then full gc will be triggered.
- If there is a permanent generation, full gc will be triggered if the permanent generation is full.
- There is insufficient space in the old generation, and large objects directly apply for allocation in the old generation. If the space in the old generation is insufficient at this time, full gc will be triggered.
- Guarantee failure is promotion failure. The to area of the new generation cannot fit the objects copied from eden and from, or the gc age of the new generation object reaches the threshold and needs to be promoted. If the old generation cannot fit, full gc will be triggered.
- Executing System.gc(), jmap -dump and other commands will trigger full gc.
Do you know TLAB? Let's talk
This has to start with the memory application.
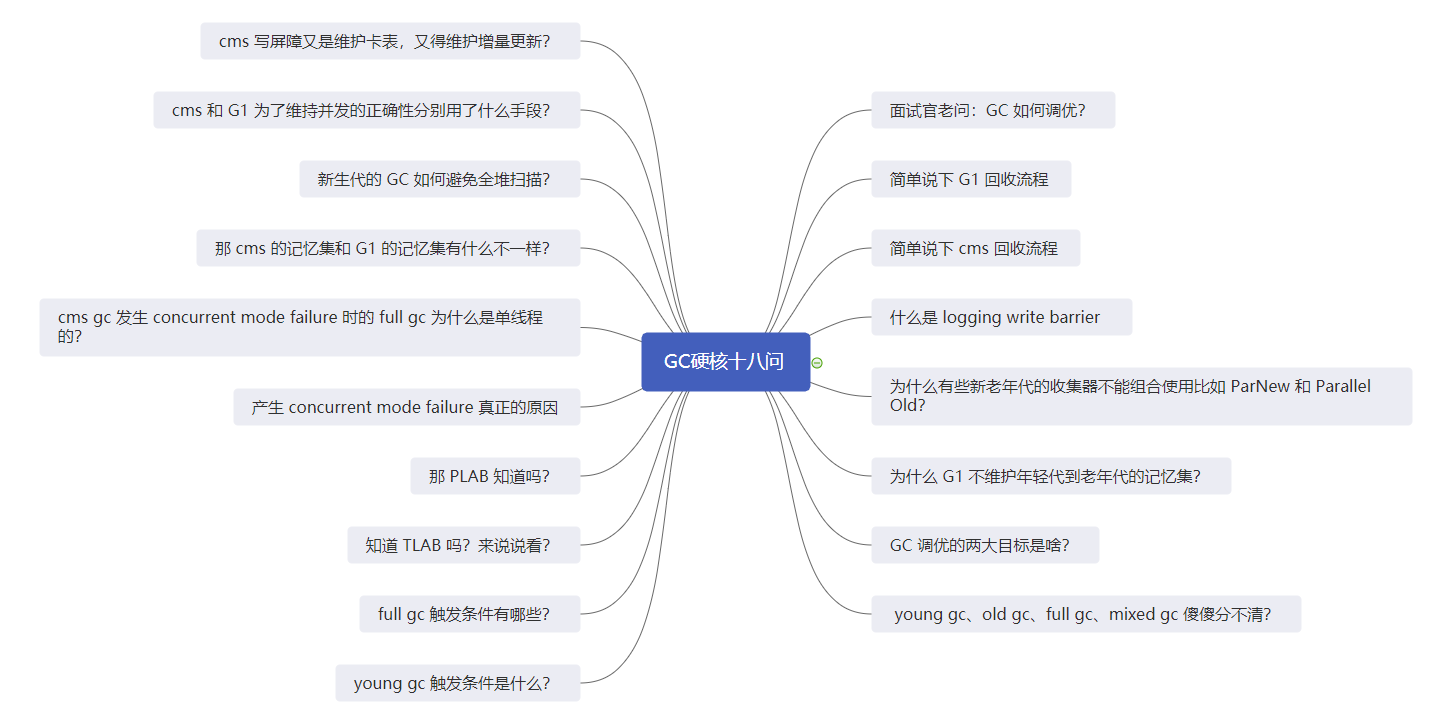
Generally speaking, generating objects need to apply for memory space from the new generation in the heap, and the heap is globally shared, like the new generation memory is regular and divided by a pointer.
The memory is compact. When creating a new object, the pointer can be moved to the right by the size of the object. This is called bump [up] the pointer.
It is conceivable that if multiple threads are allocating objects, then this pointer will become a hot resource, and the allocation efficiency will be low if mutual exclusion is required.
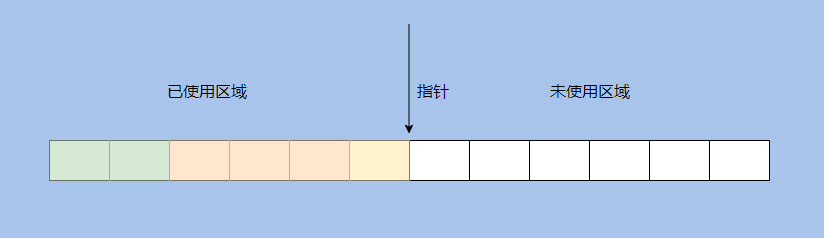
So I made a TLAB (Thread Local Allocation Buffer) to apply for an area for the memory allocated by a thread.
This area only allows this one thread to apply for the allocation of objects, and allows all threads to access this memory area .
The idea of TLAB is actually very simple. It is to assign an area to a thread, so that each thread only needs to apply for object memory in its own mu of land, and does not need to compete for hot pointers.
You can apply again when this memory is used up.
This kind of thinking is actually very common. For example, a distributed number issuer will not take one number one at a time, but will take a batch of numbers, and then apply for a batch after it is used up.
You can see that each thread has its own memory allocation area, and the shorter arrow represents the allocation pointer inside the TLAB.
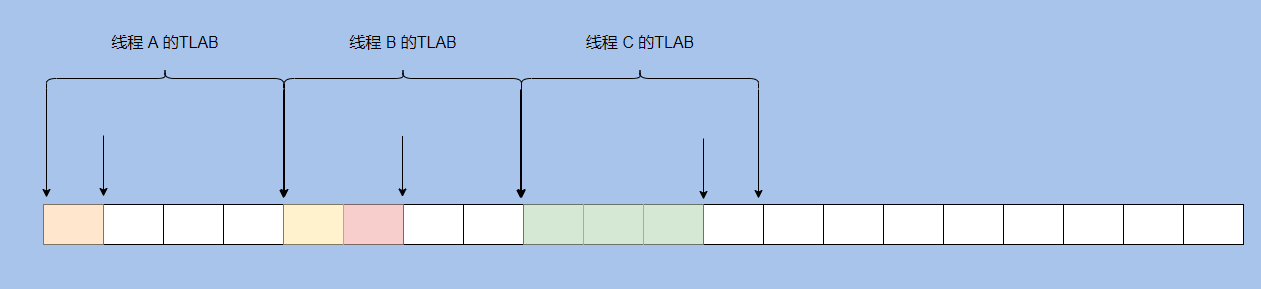
If this area is used up, apply again.
However, the size of each application is not fixed . It will be adjusted according to the historical information from the start of the thread to the present. For example, if this thread has been allocating memory, the TLAB will be larger. If this thread basically does not apply for memory allocation, the TLAB will be smaller. .
And TLAB will waste space, let's take a look at this picture.
It can be seen that there is only one square in the TLAB, and the object of application needs two squares. At this time, you need to apply for another TLAB, and the previous one is wasted.
In HotSpot, a filling object is generated to fill this block. Because the heap needs to be traversed linearly , the traversal process is to know the size of the object through the object header, and then skip this size to find the next object, so there can be no holes.
Of course, traversal can also be achieved through external recording methods such as free linked lists.
In addition, TLAB can only allocate small objects, and large objects still need to be allocated in the shared eden area .
So in general, TLAB is designed to avoid competition during object allocation.
Does PLAB know?
It can be seen that it is very similar to TLAB, and PLAB is Promotion Local Allocation Buffers.
Used when the young generation object is promoted to the old generation.
When YGC is executed in parallel by multiple threads, there may be many objects that need to be promoted to the old age. At this time, the pointers of the old age are "hot", so a PLAB is created.
First, apply for a space from the old freelist (free list), and then in this space, you can allocate memory through pointer addition (bump the pointer), so there is less competition for the freelist and the allocation of space is faster.
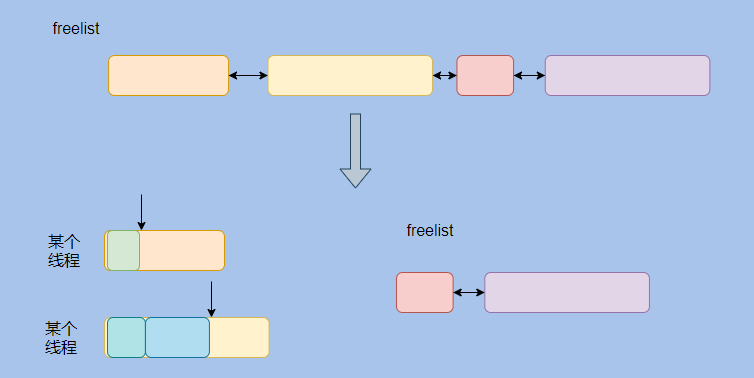
It is roughly the idea of the above figure. Each thread first applies for a block as a PLAB, and then allocates the promoted object in this block of memory.
This is similar to the idea of TLAB.
The real cause of concurrent mode failure
"In-Depth Understanding of the Java Virtual Machine": Since the CMS collector cannot handle "FloatingGarbage", it is possible that "Con-current Mode Failure" may fail and lead to another complete "Stop The World" Full GC.
The meaning of this passage is that a Full GC was caused by throwing this error.
The fact is Full GC lead to throwing this error , we look at the source code, version openjdk-8.
First search for this error.
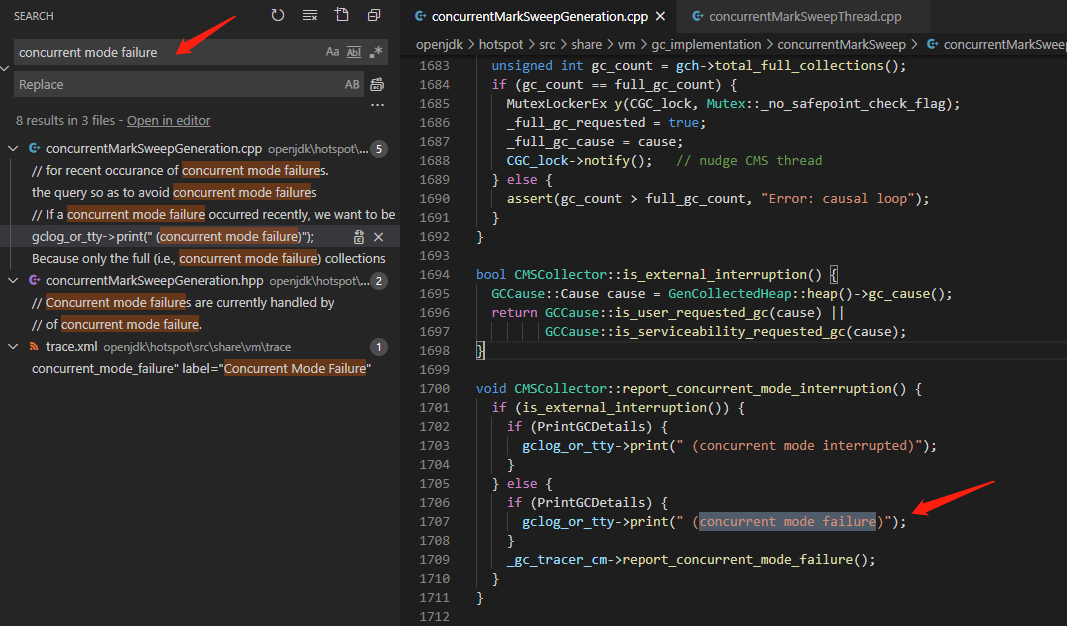
And then look around to see report_concurrent_mode_interruptionwhom to call.
It is found in void CMSCollector::acquire_control_and_collect(...)being called this method.
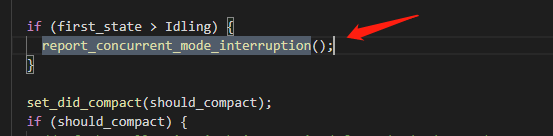
Let's take a look at first_state again: CollectorState first_state = _collectorState;
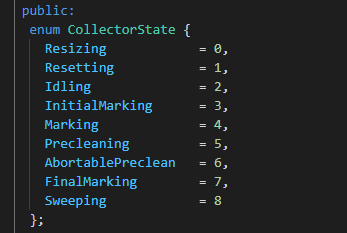
The enumeration is already very clear, just before the end of cms gc.
And acquire_control_and_collectthis method is executed foreground gc of cms.
cms is divided into foreground gc and background gc.
foreground is actually Full gc.
Therefore, when it is full gc, cms gc is still in progress and this error is thrown .
The reason is that the allocation rate is too fast, the heap is not enough, and the recovery cannot be achieved, so full gc is generated.
It is also possible that the heap threshold set by cms gc is too high.
Why is full GC single-threaded when concurrent mode failure occurs in CMS GC?
The following answer comes from R big .
Because there are not enough development resources, I am lazy. It's that simple. There are no technical problems. Large companies have made their own internal optimizations.
So how did you steal this lazy in the first place? The troubled CMS GC has experienced many turbulences. It was originally designed and implemented as a low-latency GC for Sun Labs' Exact VM.
However, Exact VM lost in the internal struggle with HotSpot VM for Sun's genuine JVM. CMS GC was later ported to HotSpot VM as the technical heritage of Exact VM.
While this migration was still in progress, Sun was already a little tired; when CMS GC was completely transplanted to HotSpot VM, Sun was already at a dying stage.
Development resources were reduced and developers were drained. At that time, the HotSpot VM development team was not able to do much and could only pick the important ones. At this time, another GC implementation of Sun Labs, Garbage-First GC (G1 GC) has been released.
Compared with the CMS that may be affected by fragmentation after a long time of operation, G1 will incrementally defragment/compress the data in the heap to avoid the effects of fragmentation, so it is considered to have more potential.
As a result, there were not many development resources at the time, and part of it was invested in the project to commercialize G1 GC-as a result, progress was slow.
After all, only one or two people are doing it. Therefore, there was not enough development resources to polish the details of the various supporting facilities of CMS GC, and the parallelization of the supporting backup full GC was delayed.
But some students will definitely have questions: Doesn’t HotSpot VM already have parallel GC? And how many more?
let's see:
- ParNew: Parallel young gen GC, not responsible for collecting old gen.
- Parallel GC (ParallelScavenge): Parallel young gen GC, similar to but not compatible with ParNew; it is also not responsible for collecting old gen.
- ParallelOld GC (PSCompact): Parallel full GC, but not compatible with ParNew/CMS.
So... that's what it is.
HotSpot VM does already have parallel GC, but two are only responsible for collecting young gen during young GC. Among the two, only ParNew can be used with CMS;
Parallel full GC has a ParallelOld, but it is not compatible with CMS GC, so it cannot be used as its backup full GC.
Why can't some collectors in the old and new generations be used in combination, such as ParNew and Parallel Old?
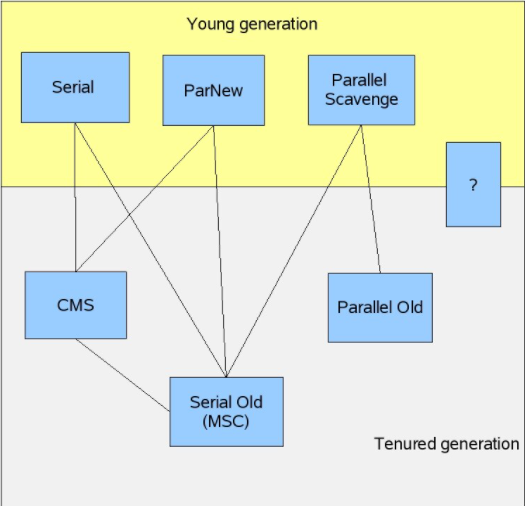
This picture was drawn by a member of the GC team at HostSpot in 2008. At that time, G1 had not yet come out and was under development, so a question mark was drawn on it.
The answer inside is:
“ParNew” is written in a style… “Parallel Old” is not written in the “ParNew” style
The generational collector implementation of HotSpot VM itself has a framework, and only implementations within the framework can be used in conjunction with each other.
However, there was a developer who didn't want to implement it according to this framework. He wrote one himself. The test result was not bad and was later absorbed by HotSpot VM, which led to incompatibility.
I saw an answer that explained it vividly before: Just like the EMU cannot carry a green leather car on the head, the electrical and hooks do not match.
How does the new generation GC avoid full heap scanning?
In the common generational GC, it is realized by using the memory set to record the address of the object referenced by the young generation in the old generation that may exist, so as to avoid the full heap scan.
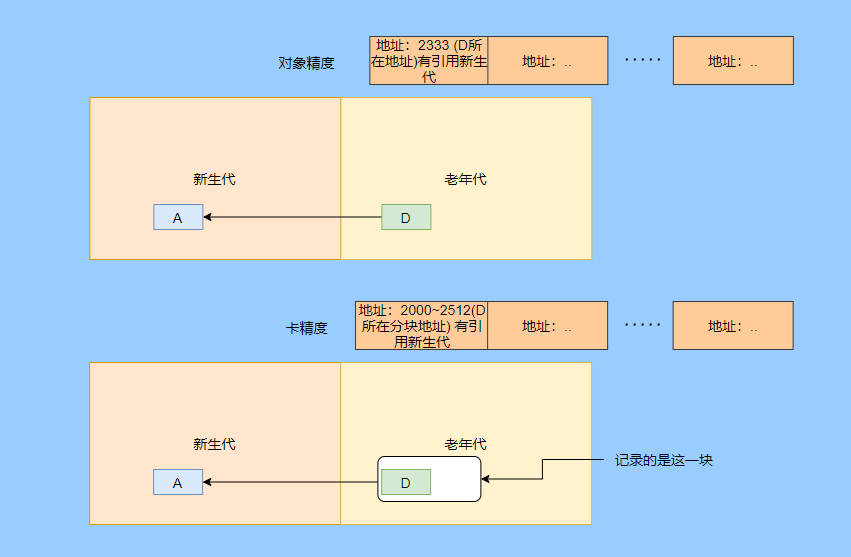
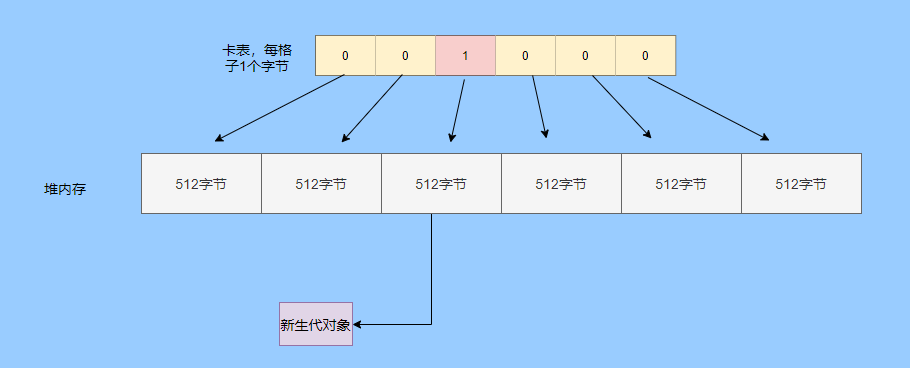
The above figure has an object accuracy, one is card accuracy, and the card accuracy is called card table.
The heap is divided into many blocks, each with 512 bytes (card page), and one element in the byte array is used to represent a certain block, and 1 indicates a dirty block, which contains cross-generation references.
The implementation in Hotspot is a card table, which is maintained through a post-write barrier. The pseudo code is as follows.
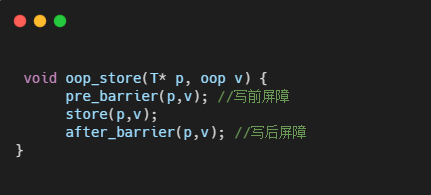
The cms needs to record the references from the old generation to the young generation, but the implementation of the write barrier does not perform any conditional filtering .
That is, it is not judged that the current object is an old-generation object and the new-generation object is referenced, and the corresponding card table is marked as dirty.
As long as it is a reference assignment, the card of the object will be marked as dirty . Of course, YGC will only scan the card table of the old generation.
This is to reduce the consumption caused by the write barrier, after all, the assignment of references is very frequent.
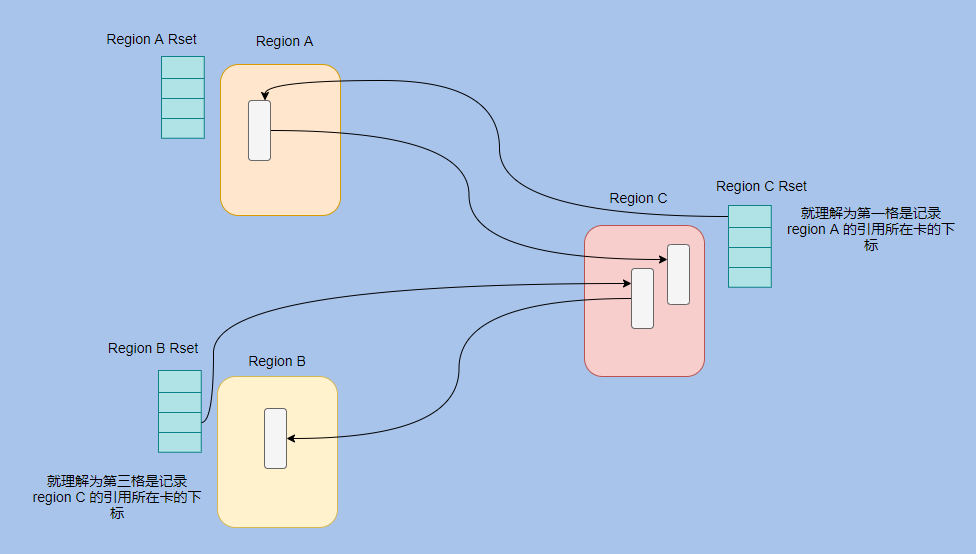
What is the difference between cms memory set and G1 memory set?
The realization of the memory set of cms is the card table.
The commonly implemented memory set is points-out. We know that the memory set is used to record cross-generation references from the non-collection area to the collection area . Its subject is actually the non-collection area, so it is points-out.
In cms, only the old generation points to the young generation card table, which is used for the young generation gc.
And G1 is based on the region, so a points-into structure is added to the points-out card table.
Because a region needs to know which other regions have pointers to itself, and then it also needs to know which cards these pointers are in .
In fact, the memory set of G1 is a hash table, the key is the starting address of other regions, and the value is a set in which the index of the card table is stored.
We look at this picture and it is very clear.
For example, each reference field assignment requires a large overhead to maintain the memory set, so the implementation of G1 utilizes the logging write barrier (described below).
It is also an asynchronous idea. The modification will be recorded in the queue first, and when the queue exceeds a certain threshold, the background thread will take it out and traverse to update the memory set.
Why doesn't G1 maintain the memory set from the young generation to the old generation?
G1 is divided into young GC and mixed gc.
young gc will select all regions of the young generation for collection.
midex gc will select all regions of the young generation and some regions of the old generation with high collection yields for collection.
Therefore , the regions of the young generation are all within the collection range, so there is no need to additionally record cross-generation references from the young generation to the old generation .
What are the methods used by cms and G1 to maintain the correctness of concurrency?
The previous article analyzed the two sufficient and necessary conditions for concurrent execution of missing bids:
-
Insert the new object into the scanned object, that is, insert the reference of the black object to the white object.
-
Removed the reference from the gray object to the white object.
cms and g1 break these two necessary and sufficient conditions through incremental update and SATB, respectively, and maintain the correctness of the concurrency of GC threads and application threads.
cms uses incremental update (Incremental update), breaking the first condition, marking the inserted white object as gray through the write barrier, that is, adding it to the mark stack, and scanning again in the remark phase to prevent missing mark.
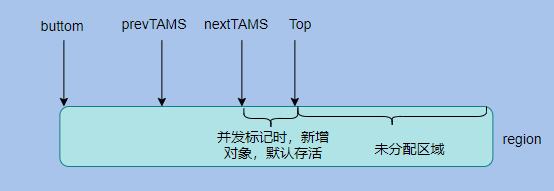
G1 uses SATB (snapshot-at-the-beginning) to break the second condition. It will write down the old reference relationship through the write barrier, and then scan the old reference relationship again.
This is already very clear from the English nouns. To put it bluntly, if the object is alive at the beginning of the GC, it is considered alive, which is equivalent to taking a snapshot.
And the newly allocated objects in the gc process are also considered to be alive. Each region will maintain a TAMS (top at mark start) pointer, which is the position of the Top pointer when prevTAMS and nextTAMS mark the start of two concurrent markings respectively.
The Top pointer is the position of the newly allocated object in the region, so the objects in the area between nextTAMS and Top are all newly allocated objects and they are considered to be alive.
In the remark phase, cms using incremental updates needs to re-scan all the thread stacks and the entire young generation. Because it is equal to the new root of the previous root, it needs to be re-scanned. If there are many objects in the young generation, it will be time-consuming.
It is important to note that this stage is STW, so CMS also provides a CMSScavengeBeforeRemark parameter to force a YGC before the remark stage.
If g1 passes SATB, it only needs to scan the old references recorded by SATB in the final marking stage. In this respect, it will be faster than cms, but because of this, there will be more floating garbage than cms.
What is the logging write barrier?
The write barrier actually consumes the performance of the application. It is the logic executed during reference assignment. This operation is very frequent, so a logging write barrier is created.
Some logic to be executed by the write barrier is moved to a background thread for execution to reduce the impact on the application .
In the write barrier, only one log message needs to be recorded to a queue, and then other background threads will take out the message from the queue to complete subsequent operations. In fact, it is asynchronous thinking.
Like the SATB write barrier, each Java thread has an independent, fixed-length SATBMarkQueue, and only old references are pushed into the queue in the write barrier. When it is full, it will be added to the global SATBMarkQueueSet.
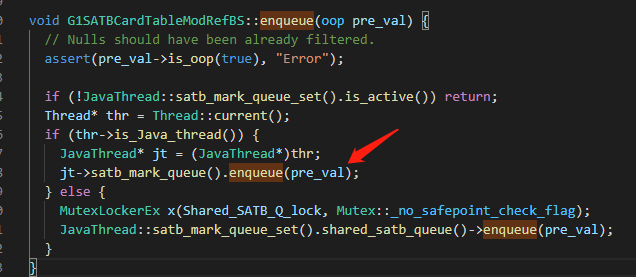
The background thread will scan, and if it exceeds a certain threshold, it will process and start tracing.
The record write barrier is also used to maintain the write barrier of the memory set.
Simply talk about the G1 recycling process
From the overall point of view, G1 is divided into two major stages, namely concurrent marking and object copying.
Concurrent marking is based on STAB and can be divided into four major stages:
1. Initial marking (initial marking), this stage is STW, scan the root set, and mark the objects directly reachable by the root. In G1, marking objects is recorded using an external bitmap instead of the object header.
2. Concurrent marking (concurrent marking). This phase is concurrent with the application thread. Tracing starts from the directly reachable object marked in the previous step and scans all reachable objects recursively. STAB will also record the changed references at this stage.
3. Final marking (final marking), this stage is STW, processing the references in STAB.
4. The cleanup phase (clenaup). This phase is STW. According to the marked bitmap, the number of surviving objects in each region is counted. If there are regions that are not alive at all, they will be recycled as a whole.
Object copy stage (evacuation), this stage is STW.
According to the marking result, select the appropriate reigon to form a collection set (collection set or CSet), and then copy the surviving objects of the CSet to the new region.
The bottleneck of G1 lies in the object copy stage, which requires more bottlenecks to transfer objects.
Simply talk about the cms recycling process
In fact, several processes can be learned from the CollectorState enumeration of the previous question.
1. Initial mark (initial mark) , this stage is STW, scan the root set, and mark the objects directly reachable by the root.
2. Concurrent marking (Concurrent marking) . This stage is concurrent with the application thread. Tracing is started from the directly reachable object marked in the previous step, and all reachable objects are scanned recursively.
3. Concurrent precleaning (Concurrent precleaning) . This stage is concurrent with the application thread. It is to help the re-marking stage to do some work first, scan the dirty area of the card table and the newly promoted objects to the old age, etc., because the re-marking is STW Yes, so share a little bit.
4. Interruptible pre-cleaning stage (AbortablePreclean) , this is basically the same as the previous stage, just to share the work of re-marking.
5. Remark . This stage is STW. Because the reference relationship in the concurrent stage will change, it is necessary to re-traverse the new generation objects, Gc Roots, card tables, etc. to correct the mark.
6. Concurrent sweeping . This stage is concurrent with the application thread to clean up garbage.
7, Concurrent reset (Concurrent reset) , this stage and the application thread concurrently, reset the internal state of cms.
The bottleneck of cms lies in the re-marking phase, which takes a long time to rescan.
The cms write barrier is to maintain the card table, but also to maintain incremental updates?
In fact, there is only one card table, and it is definitely not enough to support YGC and CMS concurrent incremental update.
YGC will scan and reset the card table every time, so that the incrementally updated records are cleared.
So I also made a mod-union table . During concurrent marking, if YGC needs to reset the record of the card table, the corresponding position of the mod-union table will be updated.
In this way, the cms re-marking stage can combine the current card table and mod-union table to process incremental updates to prevent missing objects.
What are the two goals of GC tuning?
They are the shortest pause time and throughput .
The shortest pause time: Because GC will STW pause all application threads, this time is equivalent to a stall for the user, so reducing the STW time is the key to delay-sensitive applications.
Throughput: For some applications that are not sensitive to delay, such as some background computing applications, throughput is the focus of attention. They do not pay attention to the time of each GC pause, but only focus on the small total pause time and high throughput.
for example:
Option 1: GC pauses for 100 ms each time, and pauses 5 times per second.
Scheme 2: GC pauses for 200 ms each time, and pauses 2 times per second.
Relatively speaking, the first one has low latency and the second one has high throughput. Basically, they cannot have both.
Therefore, the application goals need to be clarified when tuning .
How to tune the GC
This question is easy to ask in the interview, so grasp the core answer.
Now it is generational GC. The idea of tuning is to try to allow objects to be recycled in the young generation to prevent too many objects from being promoted to the old generation, and to reduce the allocation of large objects.
Need to balance the size of generations, the number of garbage collections, and the pause time .
The GC needs to be fully monitored, monitoring the occupancy of each age, YGC trigger frequency, Full GC trigger frequency, object allocation rate, and so on.
Then tune it according to the actual situation.
For example, if an inexplicable Full GC was performed, it is possible that a third-party library called System.gc.
Frequent Full GC may be the memory threshold triggered by CMS GC is too low, resulting in the object cannot be allocated.
There are also the threshold of the subject's age promotion, the survivor is too small, etc. The specific situation still needs to be analyzed in detail, anyway, the core is unchanged.
At last
In fact, there is still no analysis on the content of ZGC, don't worry, ZGC's article has been half written, and will be published later.
Questions about GC are still very common in interviews. In fact, there are just a few things going back and forth. Just remember to grasp the core as I mentioned .
Of course, it’s even better if you have actual tuning experience, so you must seize the opportunity at work. If an abnormal situation occurs, please actively participate, and then think hard. This is all practical experience.
Of course, if you want to know more GC details, just look at the source code. There are no secrets in the source code.
Personal ability is limited, if there are any mistakes, please contact me immediately, and you are also welcome to contact me by private message
Shoulders of giants
https://segmentfault.com/a/1190000021394215?utm_source=tag-newest
https://blogs.oracle.com/jonthecollector/our-collectors
https://www.iteye.com/blog/user/rednaxelafx R big blog
https://www.jianshu.com/u/90ab66c248e6 Zhan Xiaolang's blog
I am yes, from a little bit to a little bit, we will see you in the next article.