In wireless sensor networks, using unmanned aerial vehicles (UAV) as mobile data collectors for sensor nodes (SN) is an energy-saving technology to extend the life of the network. Taking into account the general fading channel model of the SN-UAV link, the wake-up schedule of the SN and the trajectory of the UAV are jointly optimized to minimize the maximum energy consumption of all SNs, while ensuring that the required amount of data is collected for each SN Send reliably. We formulate the design as a mixed integer non-convex optimization problem. By applying continuous convex optimization technology, an effective iterative algorithm is proposed to find suboptimal solutions. Numerical results show that compared with the benchmark scheme, this scheme achieves significant network energy saving.
clear all
close all
addpath('./src')
global u q0 qF
istrain = 0
if istrain == 1
%% Optimization
Q = {};
X = {};
Theta = {};
Lo = {};
for T = [40 50 100]
disp(['T =' num2str(T) ', start'])
[q, x, th, lo]= solveP1('T', T,'Sk',10*(10^6),'epsilon',10^-2);
disp(['T =' num2str(T) ', end'])
Q = cat(1, Q, {q});
X = cat(1, X, {x});
Theta = cat(1,Theta,{th});
Lo = cat(1,Lo, {lo});
end
else
load('./data/Fig1.mat')
parameter_setting('Sk',10*(10^6),'epsilon',10^-2);
end
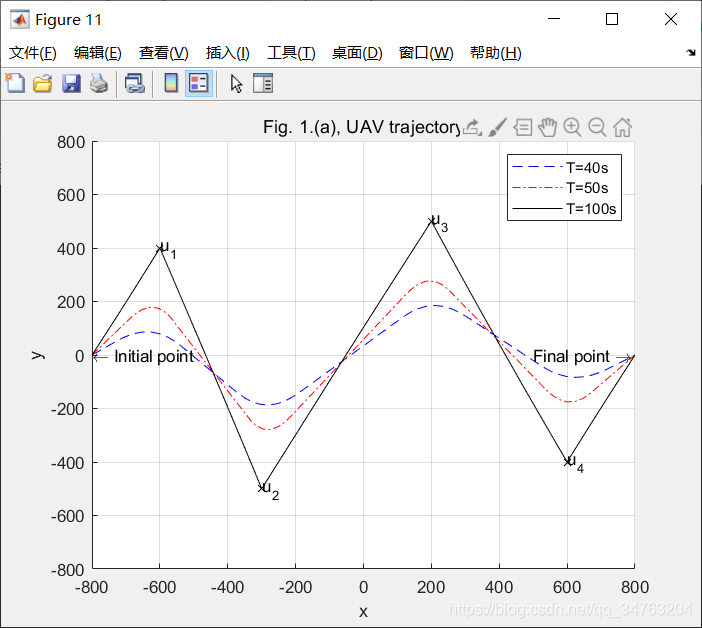
%% figure 1.(a)
figure(11)
hold on
plot(Q{1}(1,:),Q{1}(2,:), '--b',Q{2}(1,:),Q{2}(2,:), '-.r',Q{3}(1,:),Q{3}(2,:), '-k');
scatter(u(1,:),u(2,:), 'xk');
legend('T=40s','T=50s','T=100s');
axis([ -800 800 -800 800])
grid on
title('Fig. 1.(a), UAV trajectory')
xlabel('x')
ylabel('y')
text(q0(1),q0(2),'\leftarrow Initial point');
text(qF(1)-300,qF(2),'Final point \rightarrow');
for k = 1: 4
text(u(1,k),u(2,k),['u_{', num2str(k), '}']);
end
drawnow
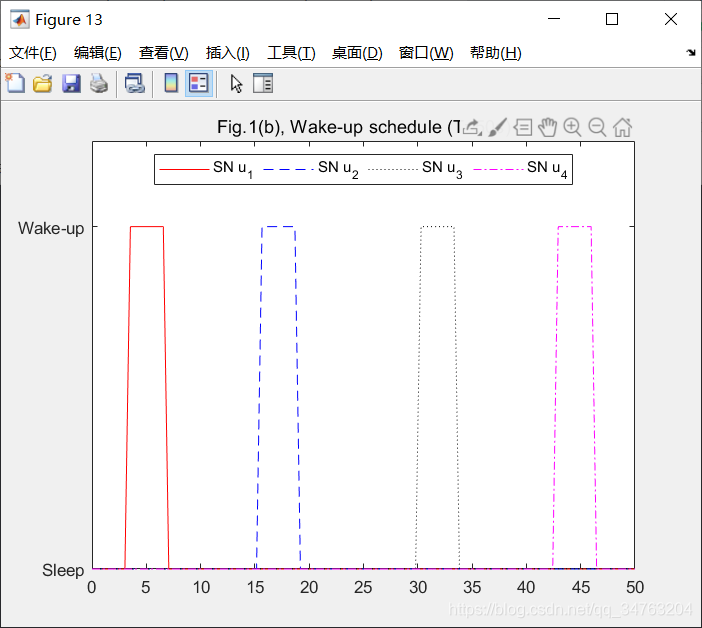
%% figure 1.(b)
figure(13)
Xr = X{2};
t = zeros(4,1);
for k = 1: 4
t(k) = graythresh(Xr(:,k));
end
t = min(t) * 1.2;
Xr(Xr >= t) = 1;
Xr(Xr < t) = 0;
plot([0:99]*50/99, Xr(:,1), '-r',[0:99]*50/99, Xr(:,2), '--b', [0:99]*50/99, Xr(:,3), ':k',[0:99]*50/99, Xr(:,4), '-.m');
legend('SN u_{1}','SN u_{2}','SN u_{3}','SN u_{4}','Location','north','NumColumns',4);
axis([ 0 50 0 1.25])
title('Fig.1(b), Wake-up schedule (T=50s)');
yticks([0 1])
yticklabels({'Sleep','Wake-up'})
drawnow
%% save datas
mkdir ./data
save('./data/Fig1.mat', 'X','Q','Theta');
Complete code or write on behalf of adding QQ1575304183