1. Introduction
1 Bayesian statistical methods 
3 Bayesian prediction methods
Bayesian statistical prediction methods are very different from classic statistical prediction methods. Classical statistical prediction methods always build statistical prediction models based on past data and information. The result of conventional prediction is to transform input information into output information in a purely mechanical form. Therefore, classic statistical prediction methods cannot handle the occurrence of abnormal situations. However, Bayesian statistical forecasting methods not only use past data and information, but also use people's subjective knowledge of forecasting. People have subjective or empirical knowledge of prediction. Bayesian statistical forecasting uses Bayesian formula to integrate people’s subjective or empirical knowledge of prediction with prior information to obtain posterior information, so posterior information does not only include prior Information also reflects people's subjective perceptions, so Bayesian prediction can handle the occurrence of abnormal situations. There are generally two cases of so-called abnormal conditions or exceptions. 
4 Data prediction of
Bayesian network As a branch of machine learning, Bayesian network has the unique strength of inference and visualization when dealing with uncertain problems and the interdependence of multiple factors in complex systems. Flight delays are just such a problem. There are many factors that directly affect flight delays, and there are many indirect factors that cause delays, and some factors still have certain dependencies. Therefore, Bayesian network can be used as a method and means to analyze and predict flight delays.
In recent years, with the rapid growth of my country's economy and residents' living standards, China's civil aviation is currently in a golden period of rapid development. The number of flights has increased, the density of flights has gradually increased, and many contradictions in resource allocation have become increasingly prominent. Airspace and airport resources are difficult to meet the increasing number of flights. Coupled with weather and other factors that affect the normal operation of flights, large-scale flight delays at airports are unavoidable. In order to provide a more reliable flight delay analysis, to a certain extent, it can provide airports and airlines with early warning of flight delays under certain factors, and provide reference for relevant units to prepare for large-scale flight delays in advance. The data prediction algorithm of Sri Lanka network.
There are many factors that cause flight delays. The factors that cause flight delays can be divided into four categories according to their attributes: airline reasons, airport management reasons, air traffic control reasons, and passenger reasons. According to the flight delay factors, it can be roughly analyzed and summarized as shown in the flight delay indicator chart.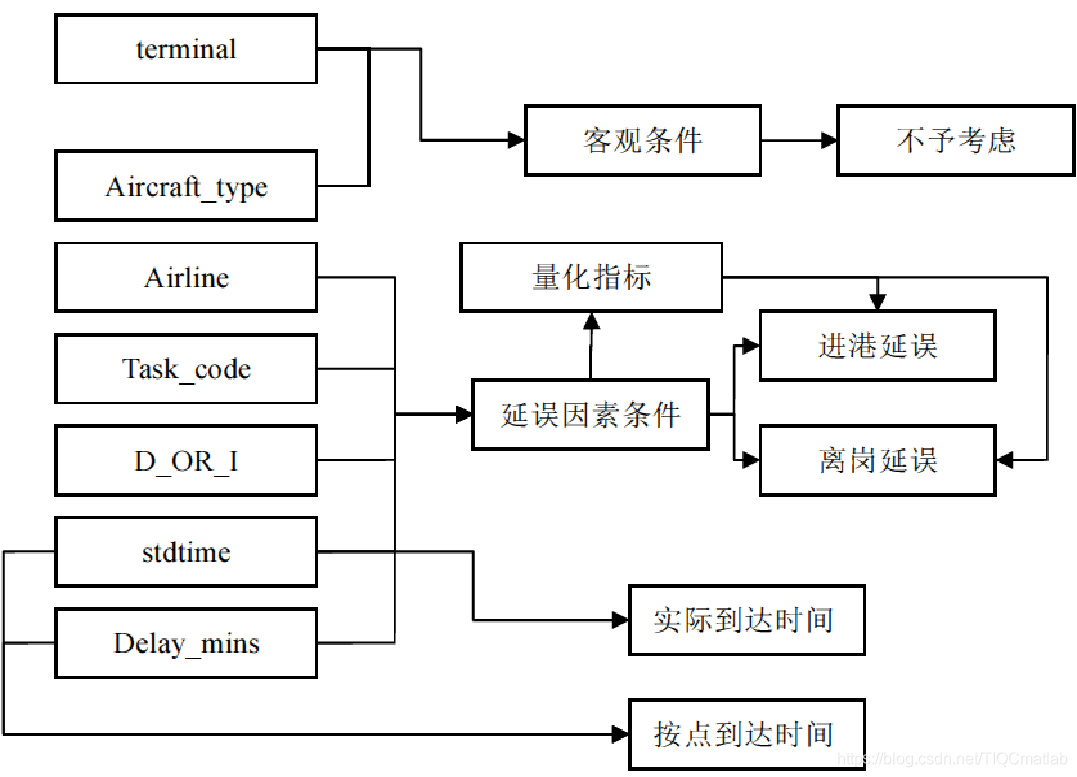
%----------------------------------------
clc,clear,close all
load('sourcedata.mat');
load data.mat
load('datatest.mat');
n=size(data);

%***********创建朴素贝叶斯分类器对象***********
% 创建朴素贝叶斯分类器对象ObjBayes
training=data(1:103,1:5);
group=data(1:103,6);
ObjBayes = NaiveBayes.fit(training,group,'Distribution','kernel')
%**********对训练样本进行判别****************
% 利用所创建的朴素贝叶斯分类器对象ObjBayes,对训练样本进行判别
pre0 = ObjBayes.predict(training);
disp '贝叶斯分类器训练数据和实际结果是否相等,相等为1,否则为0'
isequal(pre0, group)  % 判断判别结果pre0与分组向量group是否相等

pre1 = ObjBayes.predict(data(1:103,1:5));
% isequal(pre1, data(71:103,6))  % 判断判别结果pre0与分组向量group是否相等
figure,
subplot(211),bar(data(:,6));figure(gcf);axis tight,box off,grid on
title('原始数据---> 用于训练网络---103组数据 ---实际延误率')
subplot(212),bar(pre1);figure(gcf);axis tight,box off,grid on
title('贝叶斯网络训练结果---预测延误率')

%% 贝叶斯预测误差统计
By1=ysw(data,pre1)
Three, running results


Four, remarks
Complete code or write on behalf of adding QQ1575304183