DolphinDB database provides a stream table and a stream computing engine for real-time data processing, including abnormal detection of sensor data in the Internet of Things. The built-in anomaly detection engine (Anomaly Detection Engine) can meet the needs of most anomaly detection scenarios. If the anomaly detection logic is complex and special, and the standardized anomaly detection engine cannot meet the requirements, the user can implement it with a custom message processing function.
1. Application requirements
A monitoring system collects data every second. There are two anomaly detection requirements as follows:
- Every 3 minutes, if the sensor temperature is over 40 degrees Celsius twice and over 30 degrees Celsius three times, the system will alarm.
- If the sensor network is disconnected and there is no data within 5 minutes, the system will alarm.
The above alarm refers to writing a record to a stream data table if an abnormality is detected.
2. Design Ideas
The stream computing framework of the distributed time series database DolphinDB currently supports time series aggregation engines , cross-section aggregation engines , anomaly detection engines and custom stream computing engines:
- Time-Series Aggregator: It can perform vertical aggregation calculation of device status (aggregate in time series), or aggregate multiple device states horizontally and then aggregate according to time. Time series aggregation supports streaming calculations with sliding windows. DolphinDB has optimized the performance of the built-in window aggregation functions, and a single-core CPU can complete the timing aggregation of nearly one million states per second.
- Cross Sectional Aggregator (Cross Sectional Aggregator): It is an extension of the snapshot engine that can perform horizontal aggregation calculations on device status, such as calculating the average temperature of a batch of devices.
- Anomaly Detection Engine: It can detect whether the data meets the user-defined alarm indicators in real time. If abnormal data is found, it will be output to the table to meet the needs of real-time monitoring and early warning of the Internet of Things.
- Custom stream computing engine: When none of the above three engines can meet the demand, users can also use DolphinDB script or API language to customize message processing functions.
For the first requirement, the system will alarm when the sensor temperature is abnormal within 3 minutes, and the abnormal detection engine is just suitable. Just simply write an expression with DolphinDB script to describe the exception logic. But the second requirement does not apply. The anomaly detection engine is processed by device grouping. The calculation is triggered every time new data flows in, or the aggregation calculation is performed in a moving window of a fixed length at intervals. If a sensor does not generate new data, it cannot trigger calculations. The solution is to customize a message handler (message handler) to calculate and detect. The specific realization idea is: use a key-value memory table to record the latest acquisition time of each sensor. The message enters the message processing function at a certain time interval (for example, 1 second). The message processing function first updates the key-value memory table, and then checks whether the latest collection time recorded by each device in this table exceeds 5 minutes, and if so, it will alarm.
3. Detailed implementation steps
3.1 Define the input and output stream data table
First define a streaming data table to receive the sensor data collected in real time, and use the enableTableShareAndPersistence function to share and persist the streaming data table to the hard disk. The cacheSize parameter limits the maximum amount of data retained in memory to 1 million rows. Although the sensor device has many indicators, because this example only involves temperature indicators, this example simplifies the table structure. The table structure contains only three columns, namely the sensor number deviceID, time ts, and temperature. code show as below:
st=streamTable(1000000:0,`deviceID`ts`temperature,[INT,DATETIME,FLOAT])
enableTableShareAndPersistence(table=st,tableName=`sensor,asynWrite=false,compress=true, cacheSize=1000000)
Second, define the alarm output stream data table for the output of the anomaly detection engine. According to the description of the parameters of createAnomalyDetectionEngine in the DolphinDB user manual , the anomaly engine has strict requirements on the format of the output table, that is, its first column must be a time type, used to store the timestamp of the detected anomaly, and The data type of this column must be consistent with the time column of the input table. If the keyColumn (grouping column) parameter is not empty, then the second column is keyColumn. In this example, the grouping column is the sensor number deviceID. The next two columns are int type and string/symbol type, which are used to record the type of exception (subscript in metrics) and the content of the exception. The table code is as follows:
share streamTable(1000:0, `time`deviceID`anomalyType`anomalyString, [DATETIME,INT,INT, SYMBOL]) as warningTable3.2 Create an abnormality detection engine to realize the function of abnormal sensor temperature alarm
In the anomaly detection engine, set the anomaly index to sum(temperature> 40)> 2 && sum(temperature> 30)> 3, the grouping column (keyColumn) is the sensor number deviceID, the data window windowSize is 180 seconds, and the calculated time interval step is 30 seconds. How to set these parameters can refer to the anomaly detection engine . code show as below:
engine = createAnomalyDetectionEngine(name="engine1", metrics=<[sum(temperature > 40) > 2 && sum(temperature > 30) > 3  ]>,dummyTable=sensor, outputTable=warningTable, timeColumn=`ts, keyColumn=`deviceID, windowSize = 180, step = 30)
subscribeTable(tableName="sensor", actionName="sensorAnomalyDetection", offset=0, handler= append!{engine}, msgAsTable=true)
3.3 Create a custom message processing function to realize the function of sensor offline alarm
The second requirement is to save the latest data collection time of each sensor to determine whether data has not been collected for 5 minutes. This example uses a key-value memory table to store the latest state of each device, and uses the sensor number deviceID as the primary key. In the key-value table, the search and update based on the key-value have very high efficiency. When receiving sensor data, use append! function to update the records in the key-value table. If the primary key value in the new record does not exist in the table, then add a new record to the table; if the primary key value of the new record duplicates the primary key value of the existing record, the corresponding primary key value in the table will be updated record of.
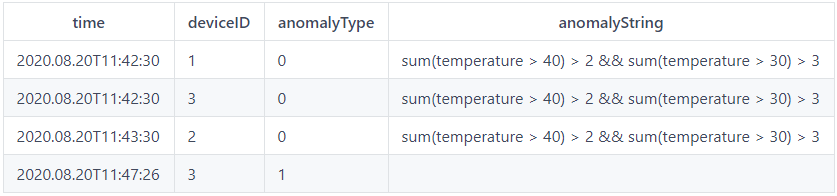
When outputting anomaly information to the alarm output stream data table, the type of anomaly anomalyType is set to 1 because the anomaly detection engine in the previous section has already used 0. The content of the exception is set to empty.
The parameter throttle and batchSize of the configuration function subscribeTable can achieve the purpose of improving the performance of batch processing of messages. The parameter throttle determines how often the handler will process a message. In this example, it is set to process every second. It should be noted here that when the number of messages reaches the batchSize, the incoming messages will be processed even if the interval is not up, so the batchSize needs to be set to a relatively large number. The sample code is as follows, where the number of sensors deviceNum is assumed to be 3:
t=keyedTable(`deviceID,100:0,`deviceID`time,[INT,DATETIME])
deviceNum=3
insert into t values(1..deviceNum,take(now().datetime(),deviceNum))
def checkNoData (mutable keyedTable, mutable outputTable, msg) {
	keyedTable.append!(select deviceID, ts from msg)
	warning = select now().datetime(), deviceID, 1 as anomalyType, "" as anomalyString from keyedTable where time < datetimeAdd(now().datetime(), -5, "m")
	if(warning.size() > 0) outputTable.append!(warning)
}
subscribeTable(tableName="sensor", actionName="noData", offset=0,handler=checkNoData{t, warningTable}, msgAsTable=true, batchSize=1000000, throttle=1)
4. Simulation write and verification
Assuming that 3 sensors collect data once a second, all devices have data in the previous minute, and the third device has no data after 1 minute. The sample code is as follows:
def writeData(){
	deviceNum = 3
	for (i in 0:60) {
		data = table(take(1..deviceNum, deviceNum) as deviceID, take(now().datetime(), deviceNum) as ts, rand(10..41, deviceNum) as temperature)
		sensor.append!(data)
		sleep(1000)
	}
	deviceNum = 2
	for (i in 0:600) {
		data = table(take(1..deviceNum, deviceNum) as deviceID ,take(now().datetime(), deviceNum) as ts, rand(10..45,deviceNum) as temperature)
		sensor.append!(data)
		sleep(1000)
	}
}
submitJob("simulateData", "simulate sensor data", writeData)
After running, query the warning output table warningTable, you can see the results are as follows: