DolphinDB provides a stream table and a stream computing engine for real-time data processing, including anomaly detection of sensor data in the Internet of Things. The built-in Anomaly Detection Engine can meet the needs of most anomaly detection scenarios. If the anomaly detection logic is complex and special, and the standardized anomaly detection engine cannot meet the requirements, the user can implement it with a custom message processing function.
1. Application requirements
A monitoring system collects data every second. There are two anomaly detection requirements as follows:
- Every 3 minutes, if the sensor temperature is over 40 degrees Celsius twice and over 30 degrees Celsius three times, the system will alarm.
- If the sensor network is disconnected and there is no data within 5 minutes, the system will alarm.
The above alarm means that if an abnormality is detected, a record is written to a stream data table.
2. Design Ideas
The flow computing framework of the distributed time series database DolphinDB currently supports time series aggregation engines , cross-section aggregation engines , anomaly detection engines, and custom flow computing engines:
- Time-Series Aggregator: It can perform vertical aggregation calculation of device status (aggregate in time series), or aggregate multiple device states horizontally and then aggregate according to time. Time series aggregation supports streaming calculations with sliding windows. DolphinDB has optimized the performance of the built-in window aggregation functions, and a single-core CPU can complete the timing aggregation of nearly one million states per second.
- Cross Sectional Aggregator (Cross Sectional Aggregator): It is an extension of the snapshot engine that can perform horizontal aggregation calculations on device status, such as calculating the average temperature of a batch of devices.
- Anomaly Detection Engine: It can detect whether the data meets the user-defined alarm indicators in real time. If abnormal data is found, it will be output to the table to meet the needs of real-time monitoring and early warning of the Internet of Things.
- Custom stream computing engine: When none of the above three engines can meet the demand, users can also use DolphinDB script or API language to customize message processing functions.
For the first requirement, the system will alarm when the sensor temperature is abnormal within 3 minutes, and the abnormal detection engine is just suitable. Just simply write an expression with DolphinDB script to describe the exception logic. But the second requirement does not apply. The anomaly detection engine is processed by device grouping. The calculation is triggered every time new data flows in, or the aggregation calculation is only performed in a fixed-length moving window at regular intervals. If a sensor does not generate new data, it cannot trigger calculations. The solution is to customize a message handler to calculate and detect. The specific realization idea is: use a key-value memory table to record the latest acquisition time of each sensor. The message enters the message processing function at a certain time interval (for example, 1 second). The message processing function first updates the key-value memory table, and then checks whether the latest collection time recorded by each device in this table exceeds 5 minutes, and if so, it will alarm.
3. Detailed implementation steps
3.1 Define the input and output stream data table
First define a streaming data table to receive the sensor data collected in real time, and use the enableTableShareAndPersistence function to share and persist the streaming data table to the hard disk. The cacheSize parameter limits the maximum amount of data retained in the memory to 1 million rows. Although the sensor device has many indicators, because this example only involves temperature indicators, this example simplifies the table structure. The table structure only contains three columns, namely the sensor number deviceID, time ts, and temperature. code show as below:
st=streamTable(1000000:0,`deviceID`ts`temperature,[INT,DATETIME,FLOAT])
enableTableShareAndPersistence(table=st,tableName=`sensor,asynWrite=false,compress=true, cacheSize=1000000)
其次定义报警输出流数据表用于异常检测引擎的输出。按照DolphinDB用户手册中对创建异常检测引擎函数createAnomalyDetectionEngine各参数的说明,异常引擎对输出表的格式有严格要求,即它的第一列必须是时间类型,用于存放检测到异常的时间戳,并且该列的数据类型需与输入表的时间列一致。如果keyColumn(分组列)参数不为空,那么第二列为keyColumn,在本例中,分组列为传感器编号deviceID。之后的两列分别为int类型和string/symbol类型,用于记录异常的类型(在metrics中的下标)和异常的内容。建表代码如下:
share streamTable(1000:0, `time`deviceID`anomalyType`anomalyString, [DATETIME,INT,INT, SYMBOL]) as warningTable
3.2 创建异常检测引擎,实现传感器温度异常报警的功能
异常检测引擎中,设置异常指标为sum(temperature > 40) > 2 && sum(temperature > 30) > 3 ,分组列(keyColumn)为传感器编号deviceID,数据窗口windowSize为180秒,计算的时间间隔step为30秒。这些参数如何设置可参考异常检测引擎。代码如下:
engine = createAnomalyDetectionEngine(name="engine1", metrics=<[sum(temperature > 40) > 2 && sum(temperature > 30) > 3  ]>,dummyTable=sensor, outputTable=warningTable, timeColumn=`ts, keyColumn=`deviceID, windowSize = 180, step = 30)
subscribeTable(tableName="sensor", actionName="sensorAnomalyDetection", offset=0, handler= append!{engine}, msgAsTable=true)
3.3 创建自定义消息处理函数,实现传感器离线报警的功能
第二个需求,需要保存每个传感器的最新数据采集时间,用于判断是否已有5分钟未采集数据。本例采用键值内存表保存每个设备的最新状态,并以传感器编号deviceID作为主键。键值表中,基于键值的查找和更新具有非常高的效率。收到传感器数据时,用append!函数更新键值表中的记录。如果新记录中的主键值不存在于表中,那么往表中添加新的记录;如果新记录的主键值与已有记录的主键值重复时,会更新表中该主键值对应的记录。
在输出异常信息到报警输出流数据表时,异常的类型anomalyType因为上节异常检测引擎已用0,所以这里设为1。异常的内容设为空。
配置函数subscribeTable的参数throttle和batchSize,可以达到批量处理消息提升性能的目的。参数throttle决定handler间隔多久时间处理一次消息,本例中设定为每秒处理一次。这里要注意当消息的数量达到batchSize时,即便间隔时间没到也会处理进来的消息,所以需要将batchSize设置为一个比较大的数。示例代码如下,其中传感器数deviceNum假设为3:
t=keyedTable(`deviceID,100:0,`deviceID`time,[INT,DATETIME])
deviceNum=3
insert into t values(1..deviceNum,take(now().datetime(),deviceNum))
def checkNoData (mutable keyedTable, mutable outputTable, msg) {
	keyedTable.append!(select deviceID, ts from msg)
	warning = select now().datetime(), deviceID, 1 as anomalyType, "" as anomalyString from keyedTable where time < datetimeAdd(now().datetime(), -5, "m")
	if(warning.size() > 0) outputTable.append!(warning)
}
subscribeTable(tableName="sensor", actionName="noData", offset=0,handler=checkNoData{t, warningTable}, msgAsTable=true, batchSize=1000000, throttle=1)
4. 模拟写入与验证
假设3个传感器,一秒钟采集一次数据,前一分钟所有设备都有数据,1分钟后第3个设备无数据。示例代码如下:
def writeData(){
	deviceNum = 3
	for (i in 0:60) {
		data = table(take(1..deviceNum, deviceNum) as deviceID, take(now().datetime(), deviceNum) as ts, rand(10..41, deviceNum) as temperature)
		sensor.append!(data)
		sleep(1000)
	}
	deviceNum = 2
	for (i in 0:600) {
		data = table(take(1..deviceNum, deviceNum) as deviceID ,take(now().datetime(), deviceNum) as ts, rand(10..45,deviceNum) as temperature)
		sensor.append!(data)
		sleep(1000)
	}
}
submitJob("simulateData", "simulate sensor data", writeData)
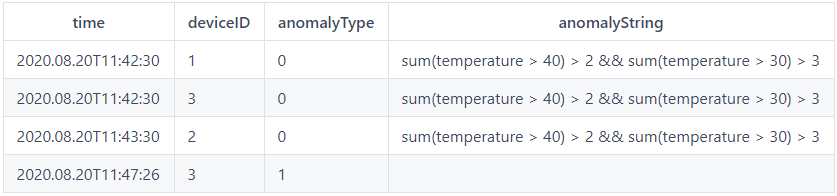
运行后,查询报警输出表warningTable,可看到结果示例如下: