AnyGantt is an advanced JavaScript-based solution for building complex and informative Gantt charts. It is completely cross-browser and cross-platform, and can be used for ASP.NET, ASP, PHP, JSP, ColdFusion, Ruby on Rails or simple HTML pages.
Click to download the official version of AnyGantt
3D charts
AnyChart supports 3D versions of the following chart types: area, bar chart, column chart, line chart and pie chart. Some modifications of these types can also be drawn in 3D-see the "Supported Types" section.
This article describes how to create and configure 3D charts.
Module
大多数3D图表需要添加Core和Basic 3D模块:
<script src="https://cdn.anychart.com/releases/8.9.0/js/anychart-core.min.js"></script>;
<script src="https://cdn.anychart.com/releases/8.9.0/js/anychart-cartesian-3d.min.js"></script>;
3D Pie and Donut charts need to use the Core module in conjunction with Pie and Donut:
<script src="https://cdn.anychart.com/releases/8.9.0/js/anychart-core.min.js"></script>;
<script src="https://cdn.anychart.com/releases/8.9.0/js/anychart-pie.min.js"></script>;
These two modules are included in the basic module, so they can also be used to create 3D Pie and Donut charts:
<script src="https://cdn.anychart.com/releases/8.9.0/js/anychart-base.min.js"></script>;
Quick start
To create a 3D chart, use one of the following chart constructors:
anychart.area3d()
anychart.bar3d()
anychart.column3d()
anychart.pie3d()
anychart.line3d()
You can pass data to the chart constructor, also You can create a series of data using one of the following methods:
area()
bar()
column()
line()
line2d()
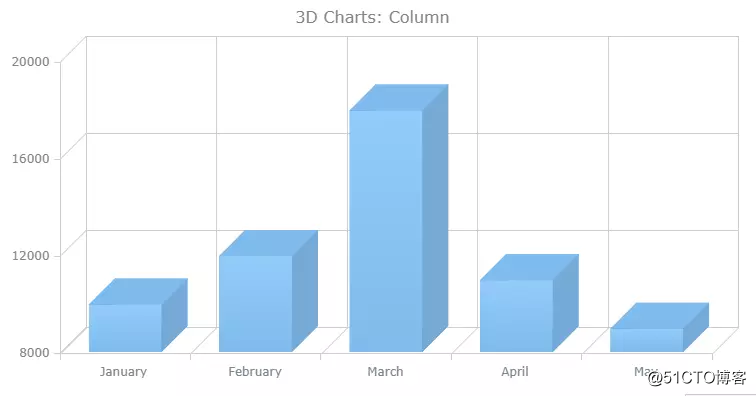
It looks like this:
// create data
var data = [
["January", 10000],
["February ", 12000],
["March", 18000],
["April", 11000],
["May", 9000]
];
// create a 3d column chart
chart = anychart.column3d();
// create a column series and set the data
var series = chart.column(data);
// set the container id
chart.container("container");
// initiate drawing the chart
chart.draw();
Special setting
Z-Angle
3D charts can be displayed from different angles: To set the angle, please use the zAngle() method for any 3D chart except 3D Pie.
Note: The value used as a parameter should be in the range of 0 to 90. By default, the angle is 45°.
In the following example, there is a 3D column chart with the Z angle set to 20°.
// configure the z-angle of the chart
chart.zAngle(20);
Z-Aspect
The depth of the 3D chart may vary: to set it up, use the zAspect() method for any 3D chart except 3D Pie.
Note: You can set the depth (in pixels (digital value) or percentage (string value)).
In the example below, there is a 3D column chart with the Z aspect ratio set to 100% (Z angle is also configured):
// configure the z-aspect of the chart
chart.zAspect("100%"");
Z distribution
A series of multi-series 3D charts can be distributed along the Z axis or along the X axis.
To enable or disable Z-axis distribution, call the zDistribution() method and use true or false as a parameter (when Z-axis distribution is disabled, the sequence will be distributed along the X-axis).
The default distribution depends on the chart constructor you use. For anychart.bar3d() and anychart.column3d(), it is the X distribution. For anychart.area3d() and anychart.line3d(), it is the Z distribution.
This is an example 3D histogram with Z-axis distribution enabled:
// create a 3d column chart
chart = anychart.column3d();

// enable the z-axis distribution
chart.zDistribution(true);

// create series (column) and set the data
var series1 = chart.column(seriesData_1);
var series2 = chart.column(seriesData_2);
var series3 = chart.column(seriesData_3);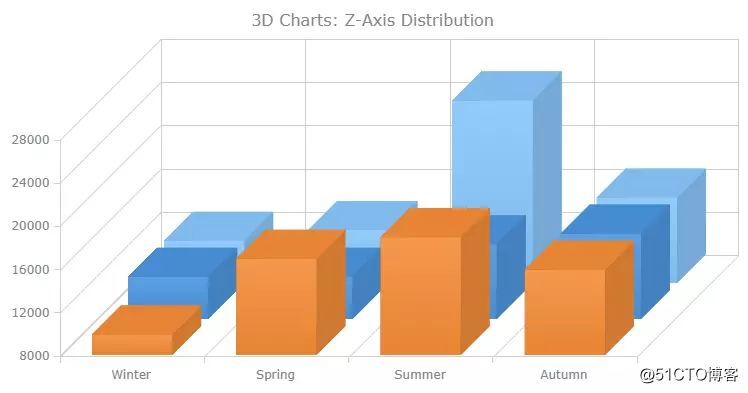
Supported types
The following is a list of supported 3D charts:
3D area
3D column
3D column
3D donut
3D Pie
3D line
3D 2D line
Friends who are interested in this tutorial can download the AnyGantt trial version for free experience~ For more product information, please consult [online Customer Service】>>>
APS is the work of Huidu Technology's 15 years of industry experience and technology precipitation. It helps to improve the production efficiency of the company by connecting the entire supply chain process such as ordering, purchasing, manufacturing, warehousing and logistics.
If you want to purchase AnyGantt genuine license or Huidu APS system, or for more product information, please click [Consult online customer service]