Overview
MySQL is a commonly used relational database. As a branch version of MySQL, MariaDB is compatible with the MySQL protocol and is becoming more and more popular. How to use Prometheus to monitor them in the Kubernetes environment? It is usually achieved by the open source mysqld-exporter . This article will focus on this topic in detail.
Introduction to mysqld-exporter principle
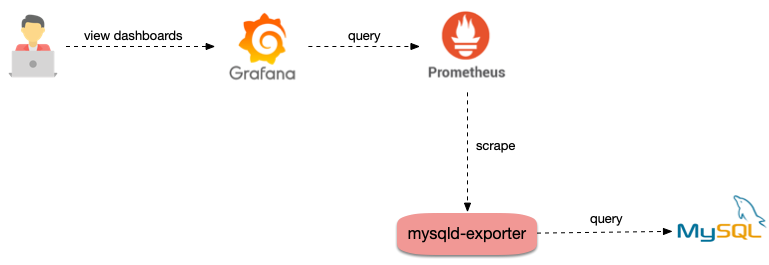
mysqld-exporter reads some database status data in MySQL or MariaDB, converts it into Prometheus indicator format and exposes it to the http interface to be collected by Prometheus, so that MySQL and MariaDB that do not originally support Prometheus indicators can be used Prometheus monitors:
Steps
Deploy mysqld-exporter
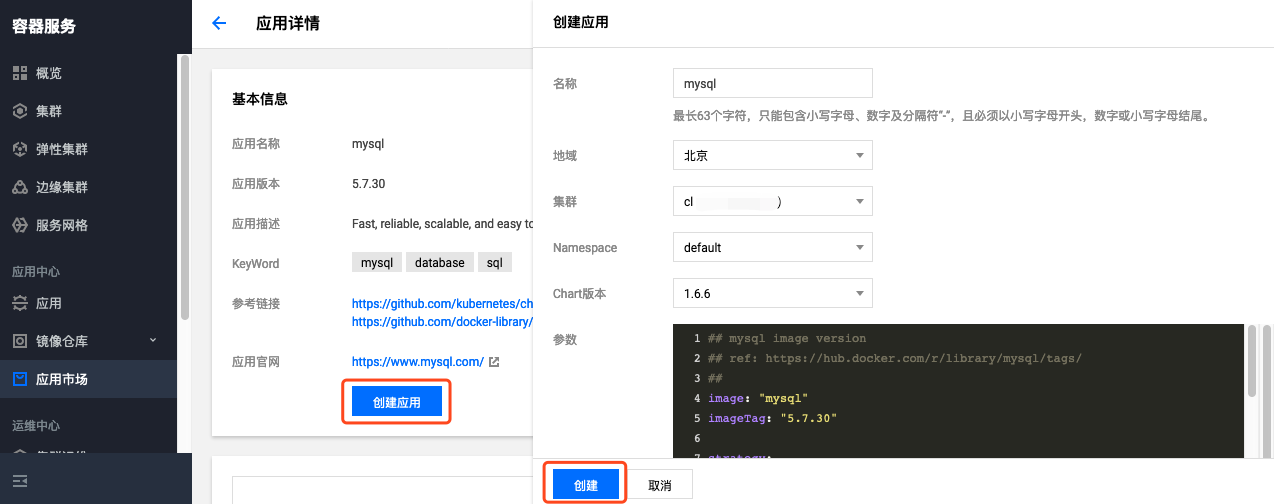
Before deploying mysqld-exporter, first ensure that MySQL or MariaDB has been deployed, either in the cluster or outside the cluster, or use ready-made cloud services. If not, here is an example of deploying from the application market to the cluster to deploy a MySQL:
- Find MySQL in the application market and click
创建应用-创建.
- Check whether mysql is running normally:
$ kubectl get pods
NAME                     READY   STATUS        RESTARTS   AGE
mysql-698b898bf7-4dc5k 1/1 Running 0 11s- Get the root password:
$ kubectl get secret -o jsonpath={.data.mysql-root-password} mysql
6ZAj33yLBo
After having MySQL, we begin to prepare to deploy mysqld-exporter. First, create an account for mysqld-exporter and log in to MySQL:
$ kubectl exec -it mysql-698b898bf7-4dc5k bash
$ mysql -uroot -p6ZAj33yLBo
Then enter SQL to create an account, here for mysqld-exporter/123456example:
CREATE USER 'mysqld-exporter' IDENTIFIED BY '123456' WITH MAX_USER_CONNECTIONS 3;
GRANT PROCESS, REPLICATION CLIENT, REPLICATION SLAVE, SELECT ON *.* TO 'mysqld-exporter';
flush privileges;
Then use the following yaml to deploy mysqld-exporter:
apiVersion: apps/v1
kind: Deployment
metadata:
  name: mysqld-exporter
spec:
  replicas: 1
  selector:
    matchLabels:
      app: mysqld-exporter
  template:
    metadata:
      labels:
        app: mysqld-exporter
    spec:
      containers:
      - name: mysqld-exporter
        image: prom/mysqld-exporter:v0.12.1
        args:
        - --collect.info_schema.tables
        - --collect.info_schema.innodb_tablespaces
        - --collect.info_schema.innodb_metrics
        - --collect.global_status
        - --collect.global_variables
        - --collect.slave_status
        - --collect.info_schema.processlist
        - --collect.perf_schema.tablelocks
        - --collect.perf_schema.eventsstatements
        - --collect.perf_schema.eventsstatementssum
        - --collect.perf_schema.eventswaits
        - --collect.auto_increment.columns
        - --collect.binlog_size
        - --collect.perf_schema.tableiowaits
        - --collect.perf_schema.indexiowaits
        - --collect.info_schema.userstats
        - --collect.info_schema.clientstats
        - --collect.info_schema.tablestats
        - --collect.info_schema.schemastats
        - --collect.perf_schema.file_events
        - --collect.perf_schema.file_instances
        - --collect.perf_schema.replication_group_member_stats
        - --collect.perf_schema.replication_applier_status_by_worker
        - --collect.slave_hosts
        - --collect.info_schema.innodb_cmp
        - --collect.info_schema.innodb_cmpmem
        - --collect.info_schema.query_response_time
        - --collect.engine_tokudb_status
        - --collect.engine_innodb_status
        ports:
        - containerPort: 9104
          protocol: TCP
        env:
        - name: DATA_SOURCE_NAME
          value: "mysqld-exporter:123456@(mysql.default.svc.cluster.local:3306)/"
---
apiVersion: v1
kind: Service
metadata:
  name: mysqld-exporter
  labels:
    app: mysqld-exporter
spec:
  type: ClusterIP
  ports:
  - port: 9104
    protocol: TCP
    name: http
  selector:
    app: mysqld-exporter
! Pay attention to replace the account password in DATA_SOURCE_NAME and the MySQL connection address according to the actual situation
Add monitoring collection configuration
With mysqld-exporter, we can configure the collection of monitoring so that the data exposed by mysqld-exporter can be collected. If prometheus-operator is installed in your cluster, you can configure collection rules by defining ServiceMonitor. Example:
apiVersion: monitoring.coreos.com/v1
kind: ServiceMonitor
metadata:
  name: mysqld-exporter
spec:
  endpoints:
    interval: 5s
    targetPort: 9104
  namespaceSelector:
    matchNames:
    - default
  selector:
    matchLabels:
      app: mysqld-exporter
You can configure the collection rules by modifying the native configuration file of Prometheus. Example:
    - job_name: mysqld-exporter
      scrape_interval: 5s
      kubernetes_sd_configs:
      - role: endpoints
        namespaces:
          names:
          - default
      relabel_configs:
      - action: keep
        source_labels:
        - __meta_kubernetes_service_label_app_kubernetes_io_name
        regex: mysqld-exporter
      - action: keep
        source_labels:
        - __meta_kubernetes_endpoint_port_name
        regex: http
Add monitoring panel
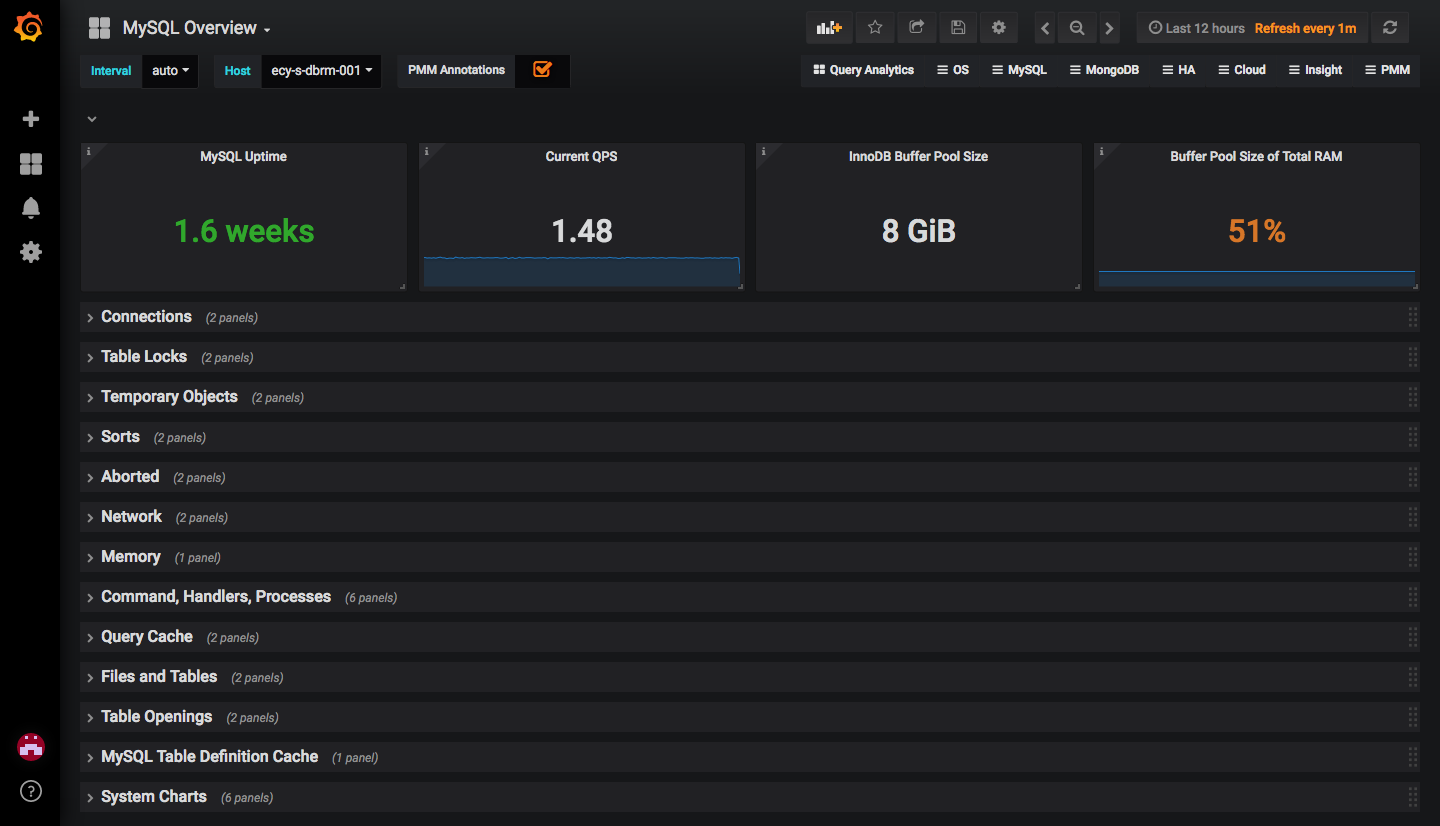
Acquisition configured, the normal acquisition Once you have the data, but also need to add a monitor panel display is Grafana, if only to see an overview of some cases MySQL or MariaDB, you can import grafana.comthis panel: https://grafana.com/grafana/dashboards/ 7362
If you need a richer panel, you can import percona open source some of the panel, address: https://github.com/percona/grafana-dashboards/tree/master/dashboards (import MySQL_content to json file in the beginning).
summary
This article describes how to use open source mysqld-exporterwill not support the original Prometheus of MySQL or MariaDB access in, let Prometheus can collect monitoring indicators database and add Grafana monitoring panel, make monitoring easier viewing.