Article Directory
1. Topic analysis
Research and analysis of the main pollutants of the main stream of the Yangtze River in the past year, which areas are the main pollutants of the permanganate index and ammonia nitrogen?
In order to determine the main pollutants permanganate index (CODMn) and ammonia nitrogen (NH3-N) the main pollution sources, we need to know the emission quality of the main pollutants in each region.
The emission quality of pollutants in the region can be determined by the difference between the pollutant quality of the current observation station and the quality of the upstream part that affects the region. Through the degradation formula of the pollutants, the relationship between the quality changes in the upstream part of the region is analyzed, and then the quality relationship of the pollutant discharge in the region is obtained. Based on the basic data of the Yangtze River for more than a year, the average discharge rate of pollutants in various regions is calculated, and the main pollution sources are determined.
2. Principle formula
By analyzing the basic data of the mainstream of the Yangtze River for more than a year to calculate the emission quality of the main pollutants in each region, the main pollutant permanganate index and the main pollution sources of ammonia nitrogen can be determined.
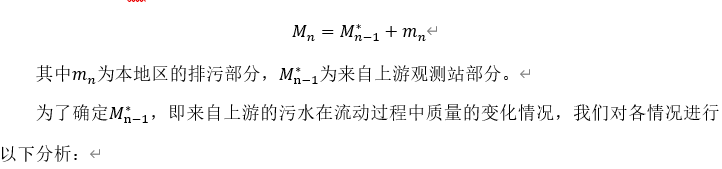
The source of water pollution at the observatory,Mainly from the sewage part of the area and upstream sewage. Then, the mass of pollutants per second when the water flows through the observation station (the nth) is:
Rivers have the ability to purify pollutants, so the pollutants contained in the water flow from upstream to downstream will change to a certain extent. When the flow rate is constant, the steady-state water quality model of the one-dimensional river shows the concentration of pollutants at x downstream: