Background introduction
With the rapid development of China's economy and the rapid increase in urban population, it has brought a series of problems. Traffic jams and environmental damage have been caused. The development of public transportation can perfectly solve the problems we are facing now. Bicycles are flexible and flexible. The advantages of low-carbon and environmental protection. If bicycles can replace the current motor vehicles, the roads will not be so crowded, people ’s travel efficiency will be greatly improved, automobile exhaust emissions will be greatly reduced, and the quality of the environment will also be improved. At the same time, in order to perfectly solve the "last mile" distance from the subway station to the company and from the bus station to the home, shared bicycles came into being.
Bike sharing effectively solves the annoyance of "walking tired, crowded bus, traffic jam, expensive taxi". Overnight, from north to Guangzhou, Shenzhen, and even some second-tier cities, shared bicycle streets and alleys can be seen everywhere. Following ofo ’s announcement of a strategic investment of tens of millions of U.S. dollars on Didi Express on September 26, 2016, the two parties will cooperate in the field of shared bicycles. (RMB 1.5 billion) financing, domestic bike sharing has become more popular, and a recent screenshot of a mobile phone has become popular on the red network. In this screenshot, the icons of 24 bike sharing apps dominate the entire mobile phone screen, and it really is "a picture illustrating the fierce competition of bike sharing." On the streets, as if overnight, shared bicycles have reached the point of "flooding", and the streets of major cities are lined with shared bicycles of various colors. The continuous development of the sharing economy has gradually changed people's daily lives, and the spirit of sharing has gradually penetrated into the hearts of the people.
Data source (updated)
Link: https://pan.baidu.com/s/10tC88d1fvuDMV-DtUInt2g
extraction code: tlq1 After
copying this content, open the Baidu network disk mobile phone App, the operation is more convenient.
python source code
# 1.导包操作:科学计算包numpy,pandas,可视化matplotlib,seaborn
import numpy as np # 导入numpy并重命名为np
import pandas as pd # 导入pandas并重命名为pd
from pylab import mpl
mpl.rcParams['font.sans-serif'] = ['SimHei'] # 设置中文字体
from datetime import datetime
import calendar
import matplotlib.pyplot as plt
import seaborn as sn
# weekday方法:日期--》星期值(整数,下标从0开始)
# strptime方法:字符串--》日期
# day_name方法:星期值--》星期(字符串)
# month_name方法:月份值--》月份(字符串)
# month方法:日期--》月份值(整数)(1-12)
# map方法:根据对应字典产生映射
# 2. 数据采集/查看和处理
def collect_and_process_data():
# 2.1 数据读取
bikedata = pd.read_csv('train.csv')
# 2.2 数据查看
print(bikedata.shape) # 查看数据
print(bikedata.head(5)) # 查看数据的前5行
print(bikedata.dtypes) # 查看数据类型
# 2.3数据提取
# 2.3.1提取年月日
# 对datetime这一列应用匿名函数:
# x表示datetime这一列数据
# x.split()以空格符分割,返回字符串列表
# x.split()[0]取出列表的第一个元素
bikedata['date'] = bikedata.datetime.apply(lambda x: x.split()[0]) # 添加一列:date
# 2.3.2提取小时
bikedata['hour'] = bikedata.datetime.apply(lambda x: x.split()[1].split(':')[0])
# 2.3.3 在年月日的基础上提取星期几(格式化字符串)
bikedata['weekday'] = bikedata.date.apply(
lambda dateString: calendar.day_name[datetime.strptime(dateString, '%Y/%m/%d').weekday()])
# 2.3.4 在年月日的基础上提取月份值
bikedata['month'] = bikedata.date.apply(
lambda dateString: calendar.month_name[datetime.strptime(dateString, "%Y/%m/%d").month])
# 2.4 数据转换
# 2.4.1 将season转换为英文季节值
bikedata['season'] = bikedata.season.map({1: 'spring', 2: 'summer', 3: 'fall', 4: 'winter'})
# 2.4.2 将以下变量转化成分类变量
print(bikedata)
varlist = ['hour', 'weekday', 'month', 'season', 'holiday', 'workingday']
for x in varlist:
bikedata[x] = bikedata[x].astype('category') # astype 改变数据类型
print(bikedata.dtypes)
# 2.4.3删除无意义的列
bikedata.drop('datetime', axis=1, inplace=True)
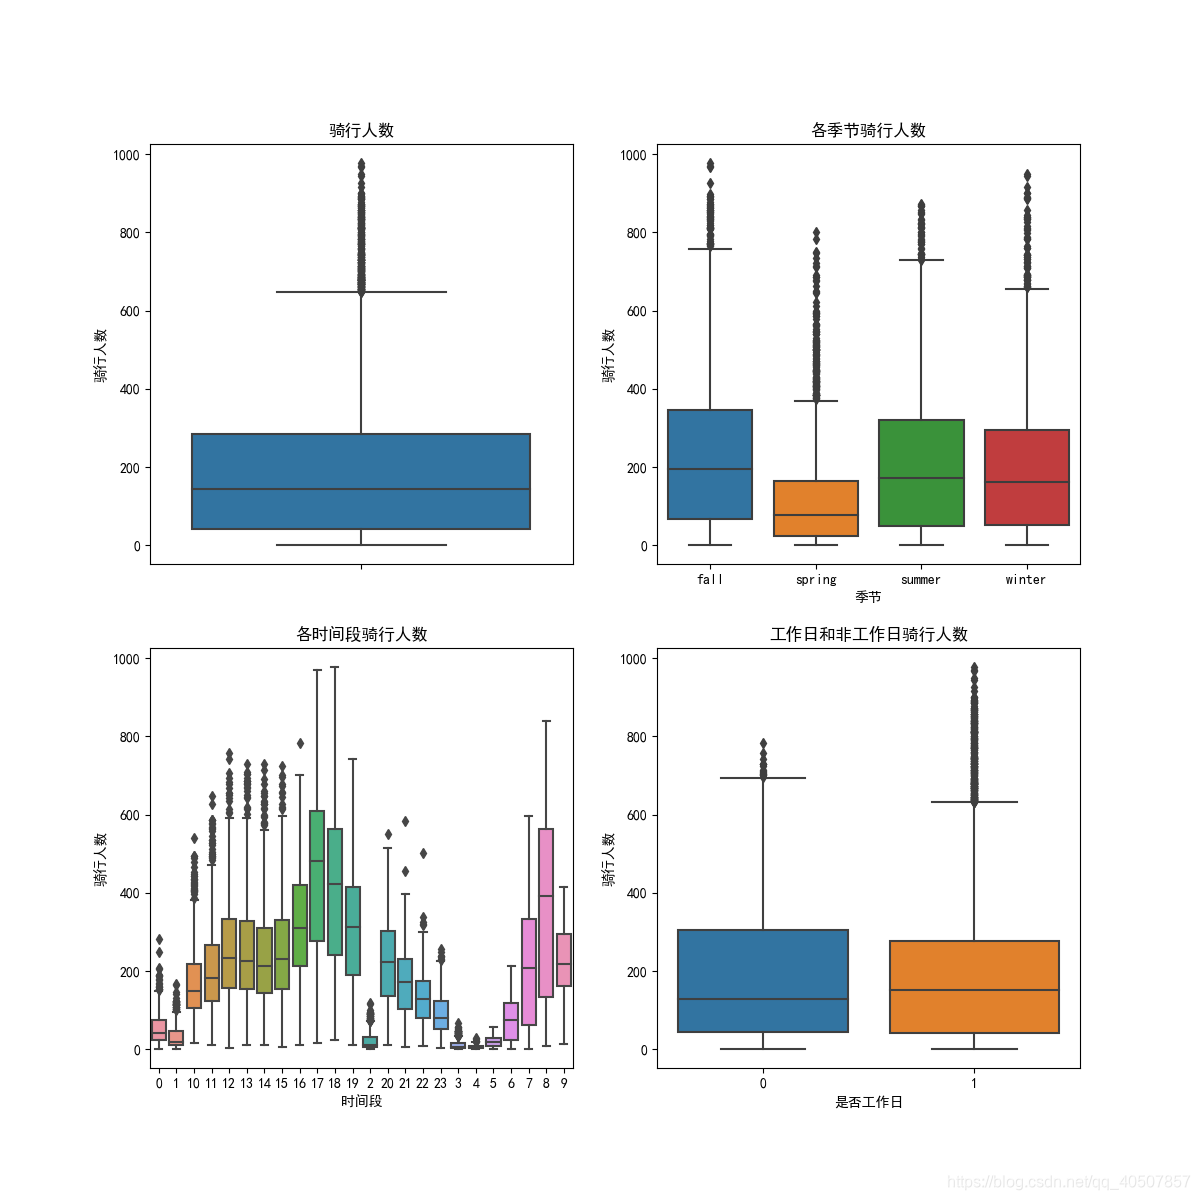
# 2.5数据清洗
# 2.5.1查看数据缺失
print(bikedata.describe())
# 2.5.2查看是否有异常值
fig, axes = plt.subplots(nrows=2, ncols=2)
fig.set_size_inches(12, 12) # 重设大小,单位:英寸
# v垂直 h水平
# 绘制箱型图
sn.boxplot(data=bikedata, y='count', orient='v', ax=axes[0][0])
sn.boxplot(data=bikedata, x='season', y="count", orient='v', ax=axes[0][1])
sn.boxplot(data=bikedata, x='hour', y="count", orient='v', ax=axes[1][0])
sn.boxplot(data=bikedata, x='workingday', y="count", orient='v', ax=axes[1][1])
# 设置横坐标、纵坐标、标题
axes[0][0].set(ylabel="骑行人数", title="骑行人数")
axes[0][1].set(ylabel="骑行人数", xlabel="季节", title="各季节骑行人数")
axes[1][0].set(ylabel="骑行人数", xlabel="时间段", title="各时间段骑行人数")
axes[1][1].set(ylabel="骑行人数", xlabel="是否工作日", title="工作日和非工作日骑行人数")
plt.savefig('collect_and_process_data.png') # 保存图片
plt.show() # 显示图片
# 2.5.3剔除异常数据
print(np.abs(bikedata["count"] - bikedata["count"].mean()))
print(3 * bikedata["count"].std())
print(np.abs(bikedata["count"] - bikedata["count"].mean()) <= (3 * bikedata["count"].std()))
processed_data = bikedata[np.abs(bikedata["count"] - bikedata["count"].mean()) <= (3 * bikedata["count"].std())]
print(processed_data)
processed_data.to_csv('processed_data.csv')
return processed_data
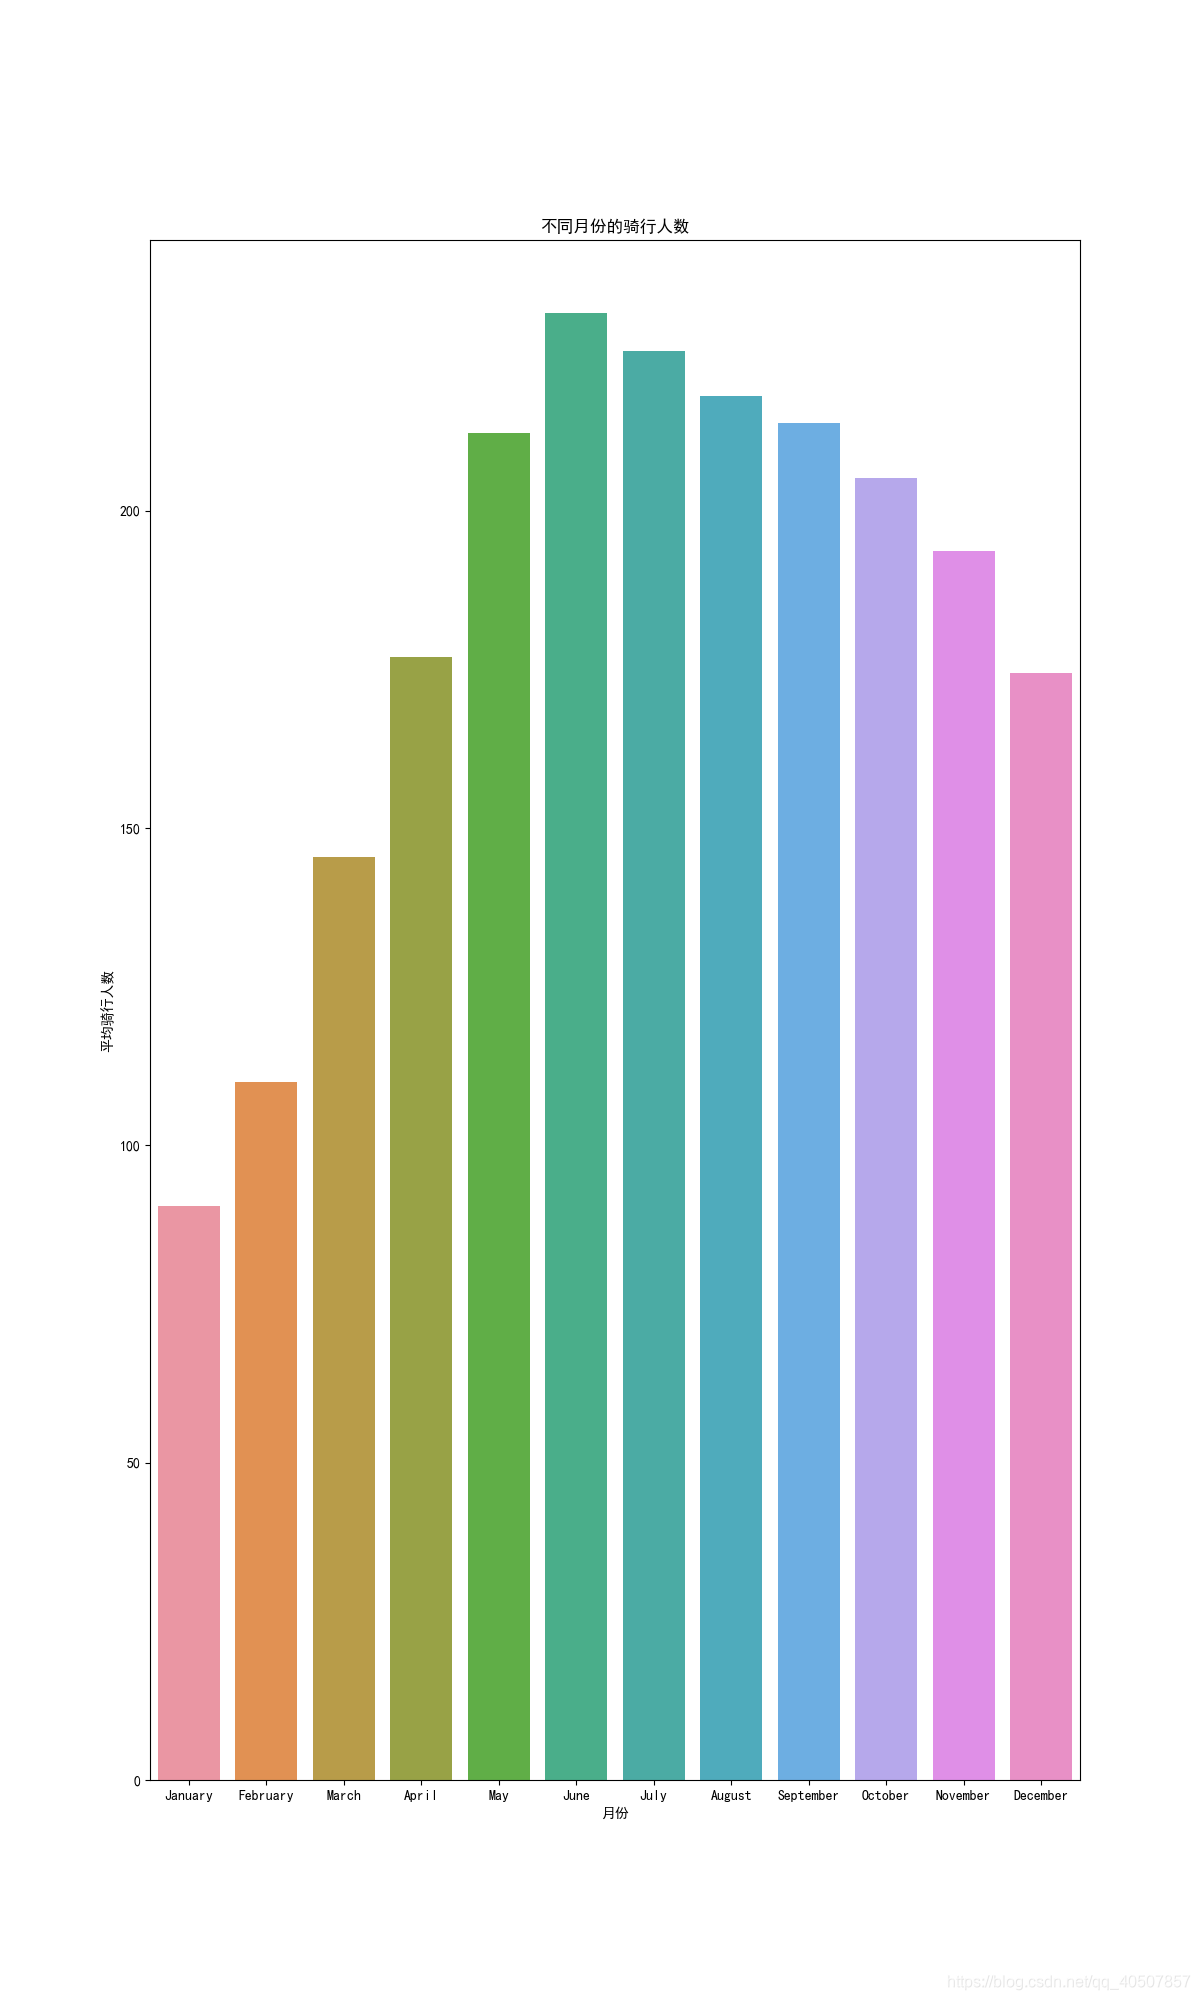
# 3. 数据分析与可视化(不同月份的骑行月份分析)
def Data_Analysis_and_Visualization_month(bikedata):
fig, axes = plt.subplots()
fig.set_size_inches(12, 20)
sortOrder = ["January", "February", "March", "April", "May", "June", "July", "August", "September", "October",
"November", "December"]
# 判断每个月份有几条记录,并按由大到小顺序排序
monthAggregated = pd.DataFrame(bikedata.groupby("month")["count"].mean()).reset_index()
# print(monthAggregated)
monthSorted = monthAggregated.sort_values(by="count", ascending=False) # 按月份从小到大排序
# print(monthSorted)
# 绘制柱状图
sn.barplot(data=monthSorted, x="month", y="count", order=sortOrder)
axes.set(xlabel="月份", ylabel="平均骑行人数", title="不同月份的骑行人数")
plt.savefig('result_month.png')
# plt.show()
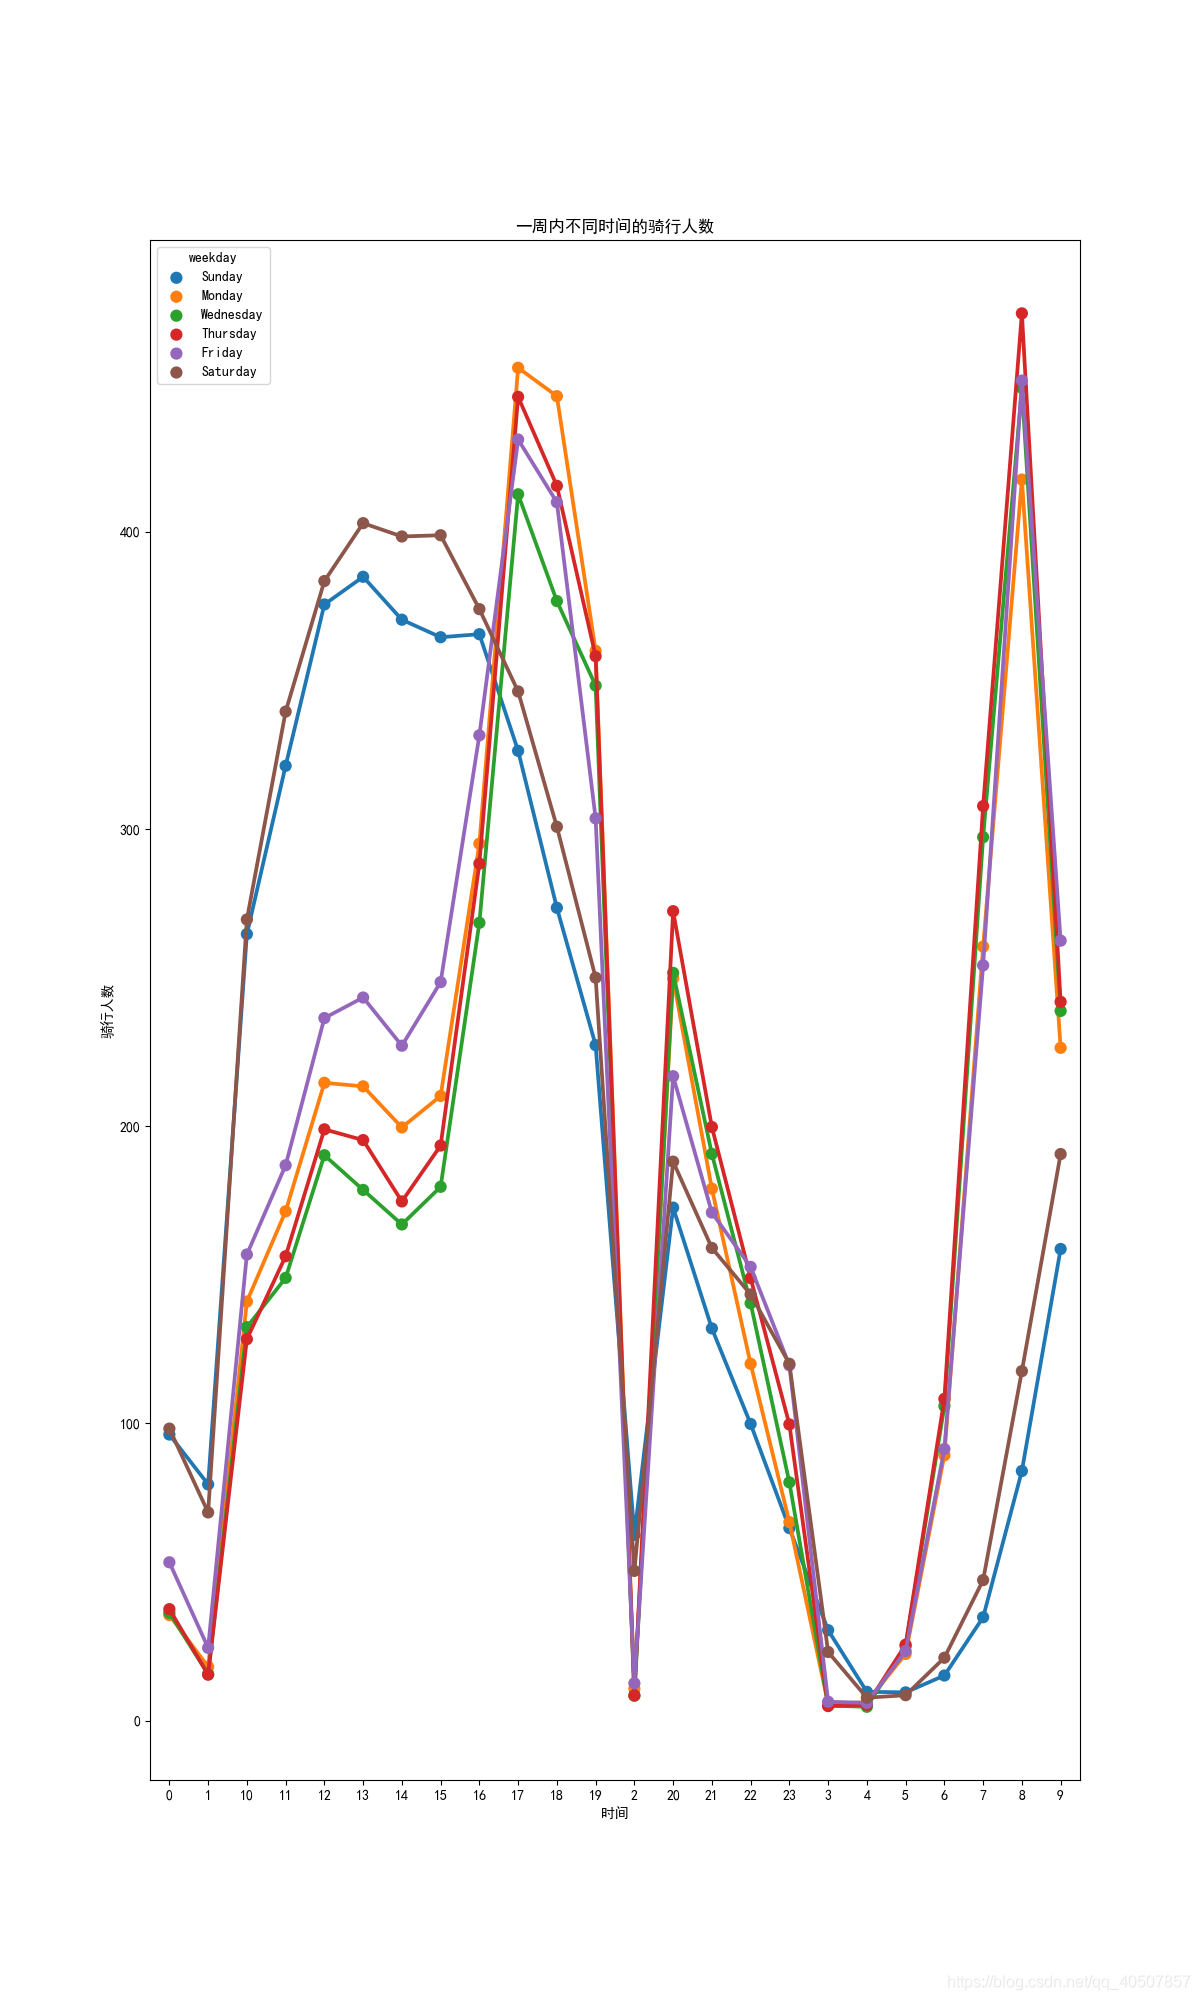
# 4. 数据分析与可视化(不同时间的骑行时间)
def Data_Analysis_and_Visualization_hour(bikedata):
fig, ax = plt.subplots()
fig.set_size_inches(12, 20)
hueOrder = ['Sunday', 'Monday', 'Wednesday', 'Thursday', 'Friday', 'Saturday']
# 一周内不同时间的骑行人数
hourAggregated = pd.DataFrame(bikedata.groupby(['hour', 'weekday'])['count'].mean()).reset_index()
print(hourAggregated)
# 绘制折线图
sn.pointplot(x=hourAggregated['hour'], y=hourAggregated['count'], hue=hourAggregated['weekday'], hue_order=hueOrder,
data=hourAggregated)
ax.set(xlabel='时间', ylabel='骑行人数', title='一周内不同时间的骑行人数')
plt.savefig('result_hour.png')
plt.show()
# 主函数
def main():
# 数据采集/查看和处理
processed_data = collect_and_process_data()
# 数据分析与可视化:月份
Data_Analysis_and_Visualization_month(processed_data)
# 数据分析与可视化:小时
Data_Analysis_and_Visualization_hour(processed_data)
# 主程序
if __name__ == '__main__':
main()
Analysis results
Data viewing
Data analysis and visualization (analysis of riding months)
Data analysis and visualization (travel time analysis)