Python3 data analysis and modeling of actual mining
Data Analysis Introduction to Python
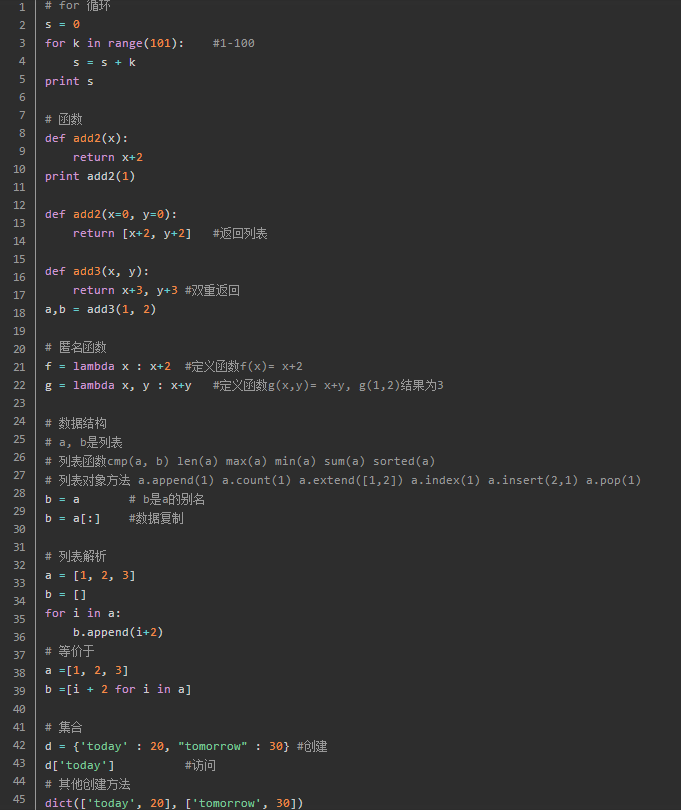
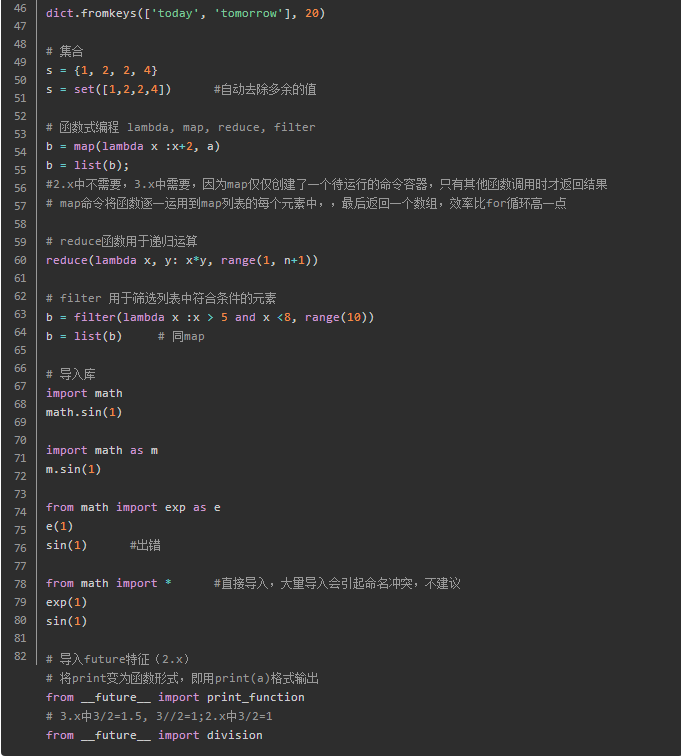
Getting Started with Python
Run: cmd under "python hello.py"
Basic commands:
Third-party libraries
installation
Windows in
pip install numpy
Or download the source
python setup.py install
Pandas default installation can not read and write Excel files, you need to install xlrd and xlwt library to support reading and writing excel
pip install xlrd
pip install xlwt
Exe StatModel can be mounted pip, note that this is dependent on the library and patsy Pandas
Scikit-Learn machine learning is associated libraries, but does not contain artificial neural network
model.fit () # training model, supervision model fit (X, y), unsupervised model fit (X)
# Supervision Model Interface
model.predict (X_new) # predict new samples
model.predict_proba (X_new) # predicted probability
model.score () # higher the score, Fit better
# Unsupervised Model Interface
model.transform () # from high school to the new data " base space "
model.fit_transform () # from the new base learned data, and is switched according to the set-yl
Keras based reinforced Theano depth study library, can be used to build a general neural network, learning model various depths, such as from the encoder, recurrent neural network, recurrent neural network, a convolutional neural network. Theano Python is a library, can achieve efficient decomposition symbol, fast, good stability, GPU acceleration achieved, in the CPU 10 times the intensive data processing, the disadvantage is threshold is too high. Keras speed in Windows will be greatly reduced.
Under Windows: Installing MinGWindows-- installation Theano --- installation Keras-- installation configuration CUDA
Gensim for language processing tasks, such as text similarity calculation, LDA, Word2Vec, it is recommended to run under Windows.
Linux,
sudo apt-get install python-numpy
sudo apt-get install python-scipy
sudo apt-get install python-matplotlib
use
Matplotlib default font is in English, if you want to use Chinese label,
plt.rcParams [ 'font.sans-serif'] = [ 'SimHei']
When you save the image mapping negative number is not displayed correctly:
plt.rcParams['axes.unicode_minus'] = False
Data exploration
Dirty: missing values, outliers, values do not match, the data is repeated
Outlier analysis
- Simple statistic analysis: beyond the reasonable range of values
- 3sigma principle: If the normal distribution, exceeds the abnormal value is defined as three times the standard deviation of the mean; otherwise, can be used to describe how many times away from the average.
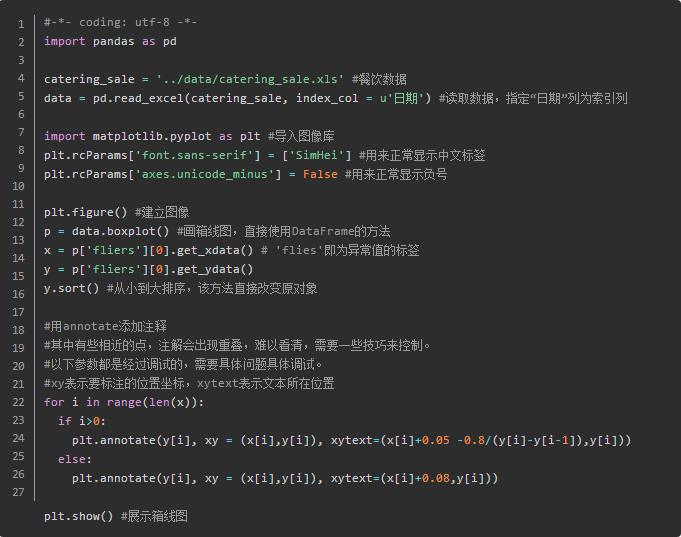
- FIG Box Analysis: outliers defined as less than Q_L-1.5IQR or greater than Q_U + 1.5IQR. Q_L is lower quartile, all the data is less than a quarter of him. Q_U is the upper quartile. IQR called interquartile, IQR = Q_U-Q_L
Distribution Analysis
Quantitative analysis of the data distribution: seeking poor (max-min), and the determined group from the group number, decision points, are listed in the frequency distribution table, plotting frequency distribution histogram.
Distribution analysis of qualitative data: pie or bar charts
Comparative analysis
Statistics Analysis
Measure of central tendency: mean, median, mode
Trends from the metric: poor, standard deviation, coefficient of variation, median four pitch
Coefficient of variation: S represents a standard deviation, x represents the mean

Periodic analysis
Contribution analysis
Also known as the Pareto analysis, the principle is the Pareto Principle, namely the 20/80 law, the same investment in different places will produce different benefits.

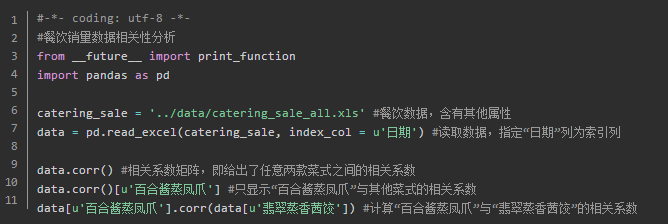
Correlation analysis
Means: Draw scattergram scatterplot matrix to calculate the correlation coefficient
Pearson correlation coefficients: the values required for continuous variables normally distributed.
$$
\begin{cases}
{| R | \ leq 0.3} & \ text {linear correlation does not exist} \
0.3 <| r | \ leq 0.5 & \ text {} related linear low \
0.5 <| r | \ leq 0.8 & \ text {significant linear correlation} \
0.8 <| r | \ leq 1 & \ text {highly linear correlation} \
\end{cases}
$$
The correlation coefficient of r in the range [-1, 1]
Spearman correlation coefficients: do not obey the normal distribution of variables, the correlation between the level of classification variables are available or the coefficient, also known as rank correlation coefficient.
Order of the two variables are in ascending order of sort, rank is obtained. R_i represents the rank x_i, Q_i represents the rank y_i.
The coefficient of determination: square of the correlation coefficient, regression equations used to explain the degree of explanation y.
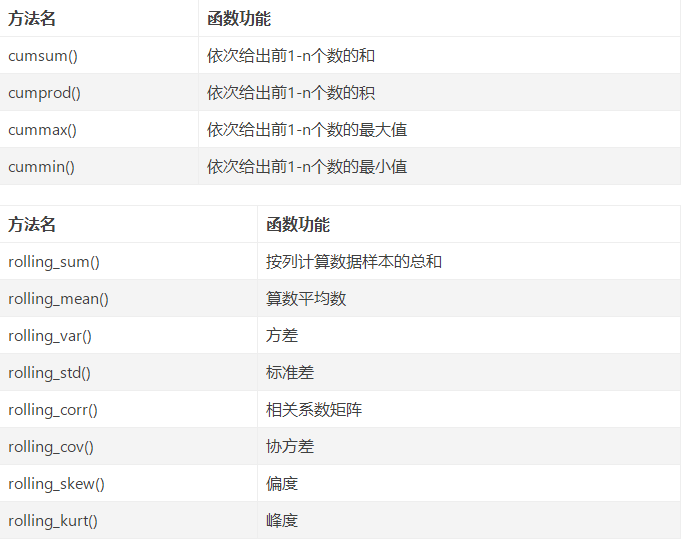
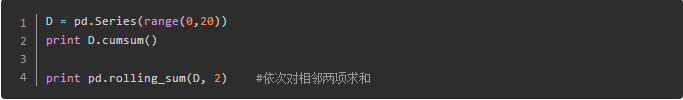
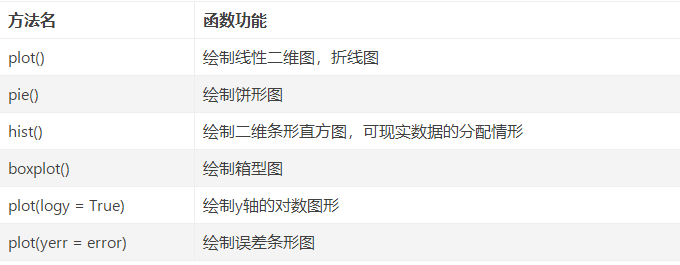
Data exploration function


E-commerce website user behavior analysis and recommendation service
Data extraction: establish a database - Import Data - operating environment database structures Python
data analysis
- Page type analysis
- Clicks analysis
- Page Rank
Data preprocessing
- Data cleansing: Delete Data (middle of the page URL, web site publishing success, Sign-in Assistant page)
- Data changes: the identification page URL and de-emphasis, misclassification manual URL classification and further classification
- Properties Statute: Only select users and user-selected web page data
Model building
Collaborative filtering algorithm based on item: calculating the similarity between the goods, to establish similarity matrix; to user-generated recommendation list based on the similarity of user behavior and historical items.
Similarity measures: cosine, Jaccard coefficient, the correlation coefficient
Revenue Factors Analysis and Prediction Model
data analysis
- Descriptive statistical analysis
- related analysis
Model building
For revenue, value-added tax, business tax, corporate income tax, government funds, personal income tax
- Adaptive-Lasso variable selection model: the removal of unrelated variables
- Gray prediction model were established with the neural network model
Area Analysis positioning data based on the base station
Data preprocessing
- Properties Statute: delete redundant attributes combined time property
- Data transformation: to calculate the residence time per working day, early morning, weekends, daily and other indicators, and standardization.
Model building
- Construction of district clustering model: hierarchical clustering algorithm
- Model: clustering result observed features
Electricity supplier Product Reviews sentiment analysis data
Text collection: octopus collector (crawler tool)
Text preprocessing:
- Text deduplication: automatic evaluation, the evaluation is completely duplicate, copy comments
- Mechanical compression to the words:
- Delete the phrase
Text Comments word: The Python Chinese word package "Jieba" word, the accuracy of more than 97%.
Model building
- Emotional advocacy model: word vector generation; manual annotation and mapping subset of the set of comments; self-training stack network coding