In this article, we will download and process json format files, and use the map tool in pygal to realize data visualization
----------------------------------------------------------------------------------------------------------------------------
general idea:
# 1. Download the world population number data file, extract the data, we choose to analyze the 2010 population number data
# 2. Data processing: convert the data into a format that pygal_maps_world can handle
# 3. Divide the world population into 3 major ranges: 0- 10 million, 10 million-1 billion, greater than 1 billion
# 4. Set the color format of the map: RotateStyle
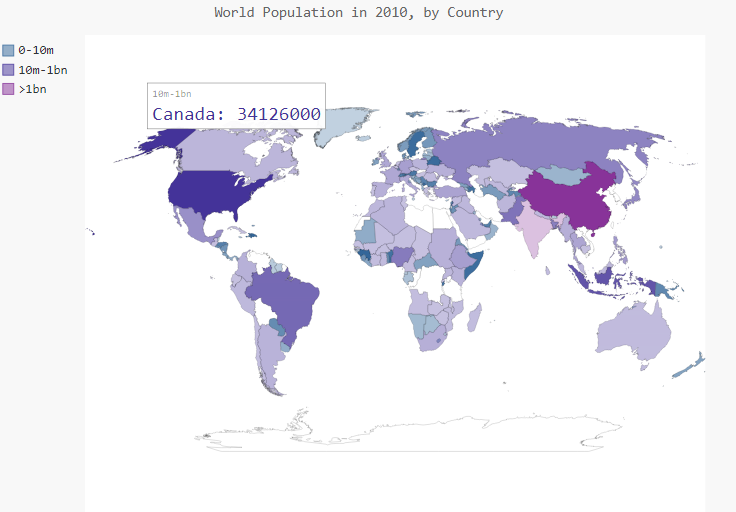
# 5. Generate the world_population.svg file
----------------------------------------------------------------------------------------------------------------------------
1. Download files and extract data
Download world population data file (json format)
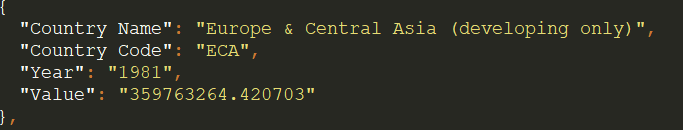
2. Check the json file is a list form, and find that each element is a dictionary, so you can refer to the processing method of the dictionary when reading the data in the process .
The screenshot below is an element in the json file list: 4 key-value pairs
3. Code
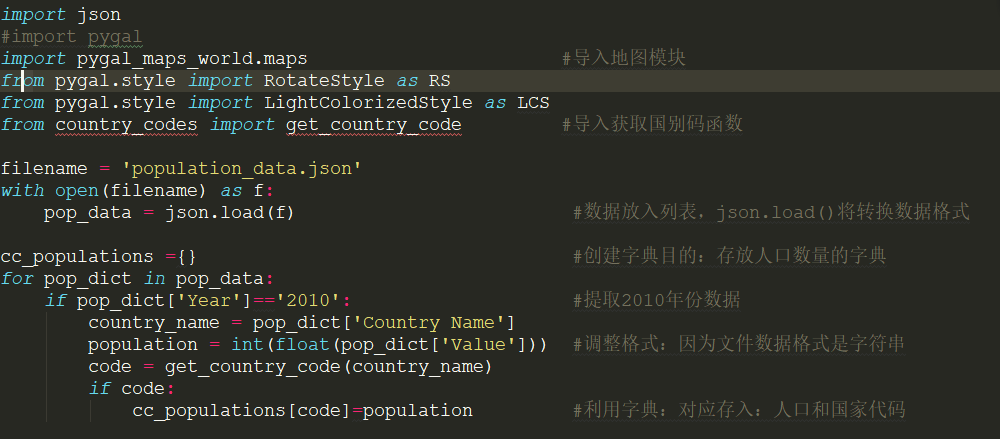
The first part of the code: import the corresponding modules (json, pygal, pygal_maps_world), load the file data into the list, extract the 2010 data, and store the data in the dictionary
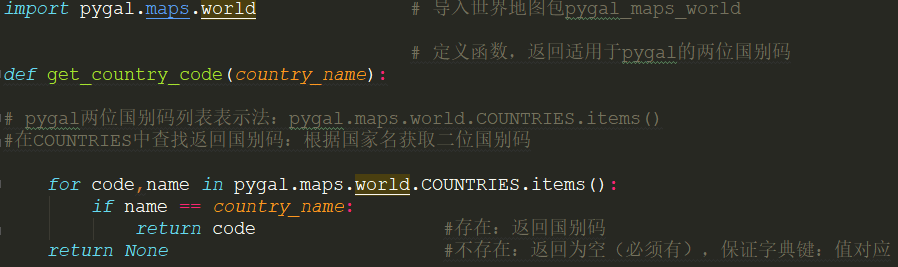
In this regard, you need to pay attention: call the get_country_code () function, get the corresponding country code according to the country, and store the country code corresponding to the country population
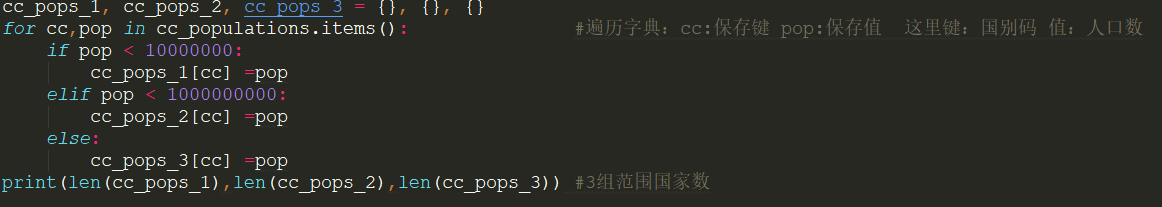
The second part of the code: divide the world's population into 3 major ranges: 0-1 million, 10 million-1 billion, greater than 1 billion, and store them separately.
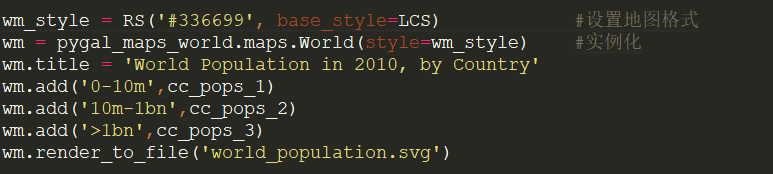
The third part of the code: set the map format color, object instantiation, and add dictionary data to the .svg file
4. Results: