In some cases, you may need to update the display to reflect the dynamic changes in the data graph in a window interface. I am just doing the project encountered such a situation, it is necessary to display a dynamic Gantt chart, just as an example to tell you how to achieve. First of all, directly on the complete code:
import sys
import matplotlib
import datetime

matplotlib.use("Qt5Agg")
from PyQt5 import QtCore
from PyQt5.QtWidgets import QApplication,  QVBoxLayout, QSizePolicy, QWidget
from matplotlib.backends.backend_qt5agg import FigureCanvasQTAgg as FigureCanvas
from matplotlib.figure import Figure
import matplotlib.pyplot as plt


class MyMplCanvas(FigureCanvas):

    def __init__(self, parent=None, width=5, height=4, dpi=100):

        # 配置中文显示
        plt.rcParams['font.family'] = ['SimHei']  # 用来正常显示中文标签
        plt.rcParams['axes.unicode_minus'] = False  # 用来正常显示负号

        self.fig = Figure(figsize=(width, height), dpi=dpi)  # 新建一个figure
        self.axes = self.fig.add_subplot(111)  # 建立一个子图,如果要建立复合图,可以在这里修改

        FigureCanvas.__init__(self, self.fig)
        self.setParent(parent)

        FigureCanvas.setSizePolicy(self,
                                   QSizePolicy.Expanding,
                                   QSizePolicy.Expanding)
        FigureCanvas.updateGeometry(self)

    '''启动显示动态图'''
    def Display_dynamic_gantt(self, *args, **kwargs):
        # 设置一个时间对象
        timer = QtCore.QTimer(self)
        # 连接需要动态刷新的方法函数
        timer.timeout.connect(self.update_figure)
        # 表示每1秒钟刷新一次
        timer.start(1000)

    '''绘制动态图方法函数,可以在这里定义自己的绘图逻辑'''
    def update_figure(self):
        # 每次重新绘制前需要清楚之前绘制的内容
        # 获取当前的系统时间
        now = datetime.datetime.now()
        self.axes.clear()
        l1 = now.second * 1.8
        if l1 > 60:
            l1 = 60
        l2 = now.second * 1.5
        if l2 > 60:
            l2 = 60
        # 画甘特图
        self.axes.barh((1, 2, 3, 4, 5), (0 + now.second, 0 + l1, 0 + now.second, 0 + l2, 0 + now.second), 0.5,
                       (0, 60, 120, 180, 240))
        self.axes.set_yticks(range(1, 6, 1))
        self.axes.set_yticklabels(('a', 'b', 'c', 'd', 'e'))
        self.axes.set_xticks(range(0, 300, 60))
        self.axes.set_xticklabels((u'周一', u'周二', u'周三', u'周四', u'周五'))
        self.draw()


class MatplotlibWidget(QWidget):
    def __init__(self, parent=None):
        super(MatplotlibWidget, self).__init__(parent)
        self.initUi()

    def initUi(self):
        self.layout = QVBoxLayout(self)
        self.mpl = MyMplCanvas(self, width=5, height=4, dpi=100)
        # 初始化显示甘特图
        self.mpl.Display_dynamic_gantt()
        self.layout.addWidget(self.mpl)


if __name__ == '__main__':
    app = QApplication(sys.argv)
    ui = MatplotlibWidget()
    ui.show()
    sys.exit(app.exec_())
Code it, I just pick an important say, primarily to give want to quickly achieve white look, no need to get to know all the code!
First of all, you can copy the entire code as a template (because I am such hee hee), can modify the main part two: Start display dynamic map, dynamic map rendering method functions, the rest can not control, directly that is!
First, the start section display dynamic FIG This section defines a function Display_dynamic_gantt (), is mainly used to display the dynamic graph, wherein there is provided a QTimer objects, this function can be used to update, timer.timeout.connect () is used to connect the function needs to be updated, timer.start (1000) indicates the start of a dynamic update, the update function once per second brackets connected.
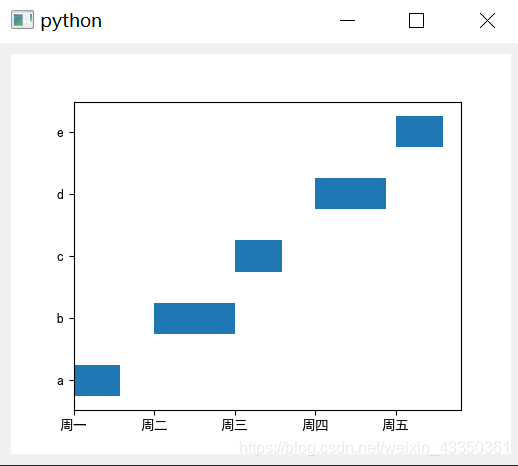
Second method of rendering dynamic map function, this section defines the function to update update_figure (), is plotted as a function of the dynamic Gantt chart. Here I use a datetime method, it can get the current system time, date, minutes and seconds can be, because to achieve update, you have a need to update the condition that each call will have different data, then the easiest the way is to get the system time (some people use the random function can be, but the data obtained is uncertain, so it is not applicable). Next is to call self.axes.clear (), this is very important, because you do not remove the last result before each drawing, charting will be retained until the results can be imagined! Here I get the time in seconds, which can be updated faster. Then draw is part of the chart, here we can draw the graph you want, I have a Gantt chart, for example, specifically how we can look at drawing before I wrote the article popular method of Matplotlib.pyplot . I added to the width of the Gantt chart the number of seconds the system time, so every time after the update function will redraw a Gantt chart, and the width of each is the second time the size of the current system. I also set the bar for a few different speeds, such as l1 is 1.8 times speed, and set the range can not exceed 60.
In short to want to draw the image and set it to update results, the results are as follows, but because it is shot so it is not dynamic, the net effect is the length of each bar will change! Well, this part introduction to this, the next to tell you how to set controls are displayed in the chart ui file!