Previous attempts at Google Chart to data visualization (you can see my previous blog Area Chart cases Google Chart of ), but unfortunately, Google Chart is not integrated into the Salesforce Lightning in the ground Well, Google JavaScript can communicate with Google, and external scripts have references, but Sales force security policy is not allowed to do so, as far as I know, so far there is no solution, so we have to learn under chart.JS, the open source third-party JS library interactive visual components, the key is that it can be used in the assembly Sales force Lightning
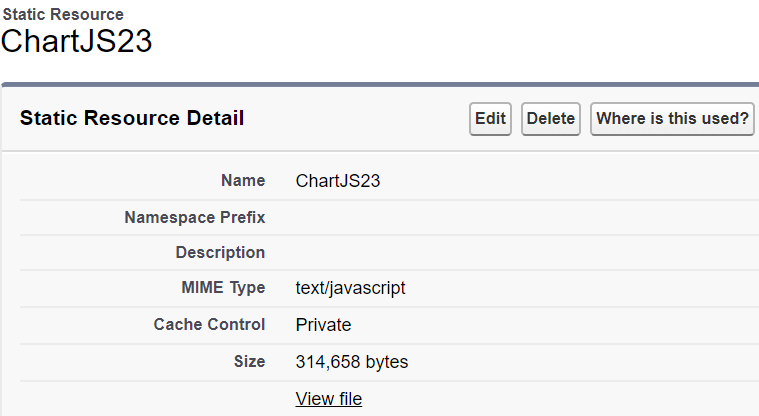
Download chart.js , static resources into Salesforce
Next we create a Lighntning components: ChartDemo
<aura:component controller="GraphController"
                implements="flexipage:availableForAllPageTypes"
                access="global">
    <ltng:require scripts="{!$Resource.ChartJS23}" afterScriptsLoaded="{!c.ctr}"/>
    <div class="slds-col slds-size--1-of-1 slds-small-size--1-of-2 slds-medium-size--3-of-4">
        <canvas aura:id="lineChart" id="lineChart"/>
    </div>
</aura:component>
Corresponding JS Controller as follows:
({
    ctr : function(cmp, event, helper) {
        var temp = [];
        var action = cmp.get("c.getLineChartMap");
        action.setCallback(this, function(response){
            if(response.getState() === 'SUCCESS' && response.getReturnValue()){
                temp = JSON.parse(response.getReturnValue());
                helper.createLineGraph(cmp, temp);
            }
        });
       $A.enqueueAction(action);
    }
})
Helper Controller corresponding follows:
({
    createLineGraph : function(cmp, temp) {
        var label = [];
        var firstValue = [];
        var secondValue = [];
        for(var a=0; a< temp.length; a++){
            console.debug(temp[a]["label"]);
            label.push(temp[a]["label"]);
            firstValue.push(temp[a]["firstValue"]);
            secondValue.push(temp[a]["secondValue"]);
        }
        var el = cmp.find('lineChart ').getElement();
        var ctx = el.getContext('2d');

        new Chart(ctx, {
            type: 'line',
            data: {
                labels: label,
                datasets: [{
                    label: 'USD Sent',
                    data: firstValue,
                    backgroundColor: "rgba(153,255,51,0.4)"
                }, {
                    label: 'USD Recieved',
                    data: secondValue,
                    backgroundColor: "rgba(255,153,0,0.4)"
                }]
            }
        });

    }
})
Finally, the corresponding Apex Controller: GraphController source code, I use the Map analog part of the background check data, to facilitate the demonstration effect
public class GraphController {

    @auraEnabled
    public List<LineChartVar> myLineChartVarList;

    public class LineChartVar {
        string label;
        integer firstValue;
        integer secondValue;

        public LineChartVar(string a, integer b, integer c){
            label = a;
            firstValue = b;
            secondValue = c;
        }
    }
    @auraEnabled
    public static string getLineChartMap(){
        List<LineChartVar> myLineChartVarList = new List <LineChartVar> ();
        myLineChartVarListadd ( new LineChartVar ( '2014', 100, 120 ));
        myLineChartVarListadd ( new LineChartVar ( '2015', 150, 190 ));
        myLineChartVarListadd ( new LineChartVar ( 'the 2016', 170, 200 ));
        myLineChartVarListadd ( new LineChartVar ( '2017', 260, 210 ));
        myLineChartVarListadd ( new LineChartVar ( '2018', 110, 300 ));
        myLineChartVarListadd ( new LineChartVar ( '2019', 370, 150 ));
        myLineChartVarList.add(new LineChartVar('2020', 450, 500));
        return JSON.Serialize(myLineChartVarList);
    }
}
To view this Lightning last assembly, I created a test some Application, this component will be embedded in source code as follows:
<aura:application >
    <c:ChartDemo/>
</aura:application>
Click Review to see the effect of this Application
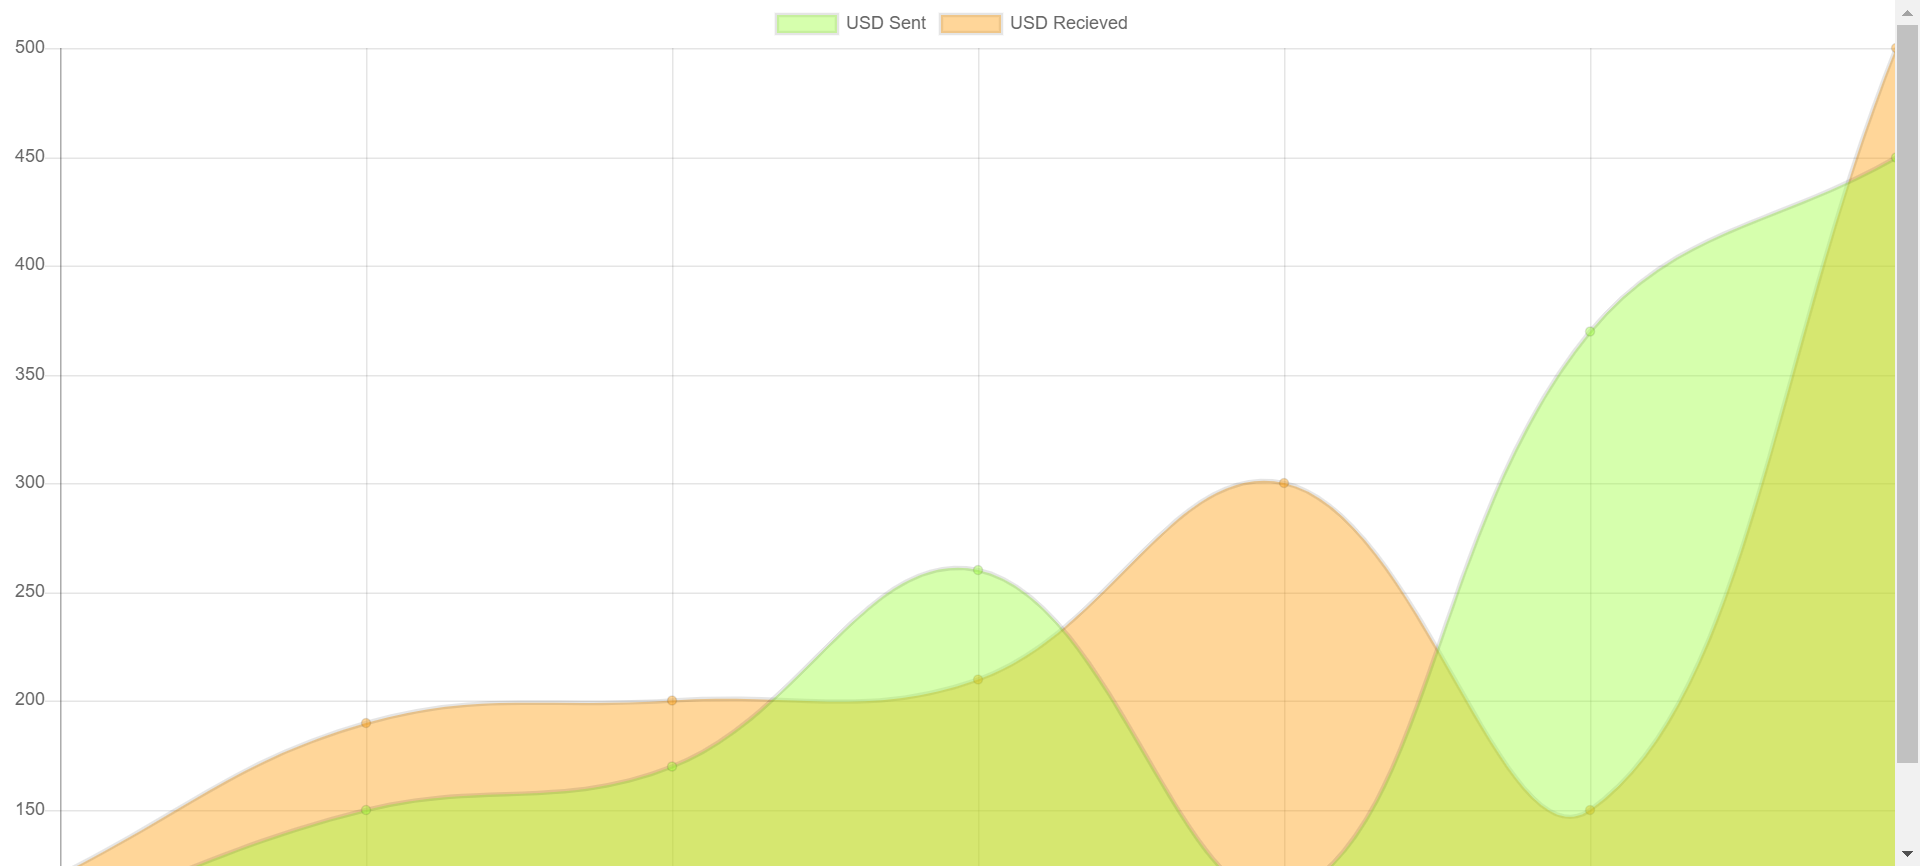
You can see, this generates a table of results is by its very nature JS drew a picture out, then you will find that this image covered the entire page also can not seem to display completely, then how to control this map display various elements of it? By looking Chart.js document , this simple display elements of the chart to do a walkthrough
Carefully read the above code, you will find an icon rendering occurs mainly in Helper Controller, then the same, rendering effect is mainly carried out in Helper Controller icon on the display element
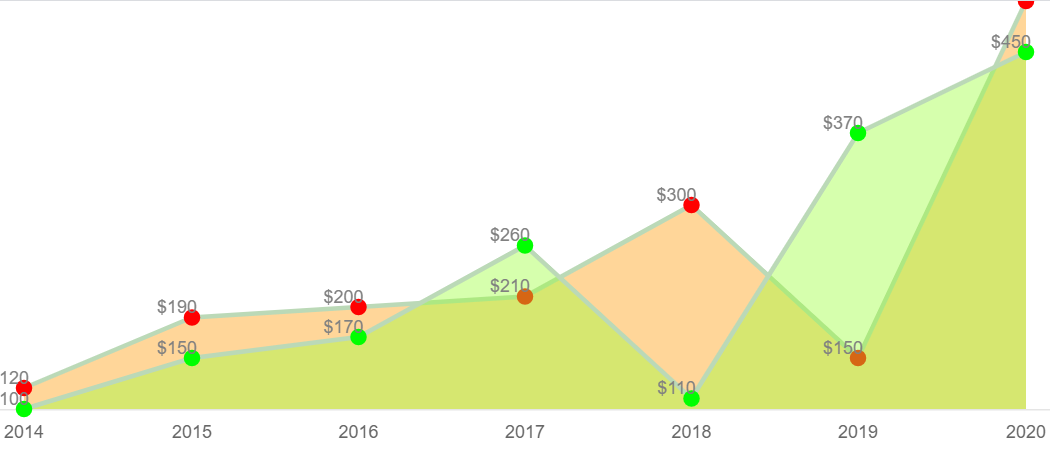
new new the Chart (CTX, {
    type: 'Line' ,
    Data: {
        Labels: label,
        Datasets: [{
            label: 'USD Sent' ,
            Data: firstValue,
            the backgroundColor: "RGBA (153,255,51,0.4)", // fill color
            pointRadius:. 5 ,
            pointStyle: 'Circle' ,
            the borderColor: '# bbd9b7', // polyline color settings
            pointBorderColor: '# 00FF00', // vertex circle color
            pointBackgroundColor: '# 00FF00' // vertex color
        },{
            label:'Recieved USD' ,
            Data: secondValue,
            the backgroundColor: "RGBA (255,153,0,0.4)", // fill color
            pointRadius:. 5 ,
            pointStyle: 'Circle' ,
            the borderColor: '# bbd9b7', // color settings polyline
            pointBorderColor: '# FF0000', // vertex circle color
            pointBackgroundColor: '# FF0000' // vertex color
        }]
    },
    Options: {
        Elements: {
            Line: {Tension: 0} // set the line graph
         } ,
        legend: { display:false }, // set the legend is not displayed
        responsive: false , // responsive and can adjust the settings maintainAspectRatio icon width and height to false
        maintainAspectRatio: false ,
        Scales: {
            xAxes: [{
                GridLines: {the display: false } // hide gridlines
            }],
            yAxes: [{
                gridLines: {the display: to false },
                the display: to false  // hide the axis Y
            }]
        }
        // set the vertex of the display data
        hover: {animationDuration: 0}, // prevent flicker effect when the mouse moves to the apex
        Animation: {
             "DURATION":. 1, // // prevent flicker effect when the mouse is moved to the vertex
            "the onComplete": function () {
                 var = chartInstance the this .Chart,
                  CTX = chartInstance.ctx;
                ctx.fillStyle = 'Gray' ;
                ctx.textAlign = 'Center' ;
                ctx.textBaseline = 'bottom' ;
                 the this .data.datasets.forEach ( function (DataSet, I) {
                  var Meta = chartInstance.controller.getDatasetMeta (I);
                    meta.data.forEach ( function (bar, index) {
                         var Data = '$' + dataset.data [index];
                         // Data: vertex data display, bar._model.x -10: X-axis offset; bar._model.y: Y axis offset
                        ctx.fillText (Data, bar._model.x -10 , bar._model.y);
                    });
                });
          }
       }
    }
});
If the above JS deployed, it will be a preview of the effect of the following components effect, looking very pocket Photo

So how to set the width and height of this figure it? Can be rendered directly in Helper
@ Way: Helper directly in rendering
var EL = cmp.find ( 'linechart' ) .getElement ();
 var CTX = el.getContext ( '2D' );
ctx.canvas.width = '700' ;
CTX. canvas.height = '300' ;

// Second way: cmp in the direct setting the width and height
<canvas aura: id = "lineChart " id = "lineChart" width = "600" height = "300" />
Tips: Note that setting the width and height required to Chart maintainAspectRatio and responsive to False.
This effect will be rendered out of the picture a lot of the right
The above is how Chart.JS the application to Salesforce Lightning is a simple demonstration, any errors can exchange messages