5 types of graphs
- Table
- Line graph(or curve graph)
- Scatter plot(Discrete graph)
- Bar graph
- Pie chart
Table:
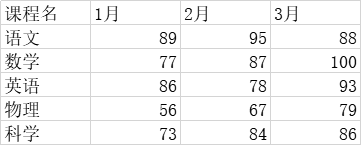
Tables are good for side-by-side comparison of quantitative data. In a table, you underscore(emphasize) the number differences.
Pie chart:

Pie charts illustrate simple distribution patterns.They are used to dramatize relationships among the parts and whole.
Bar chart:


Vertical bars show the changes in quantity over time or , while horizontal bars compare quantities.
Curve fitting

Line graphs use a line to conect the data points, which are used to investigate the possible relationship between two variables that both relate to the same event. The same to curve graphs.
When we merge them into a single whole, we can have the curve fitting.
Once we konw the clear reason why the graph should exist, we will naturally be able to select te right graph type for that reason.
Comparison, trend over time, distribution, relationship are the purposes to make a graph.
To compare data, you can use pie chart, line graph and bar chart.
Pie chart compares parts and the relationship between part and the whole.
Lines compare the trend of two values.
Bars compare the quantitative of different variables.
To show the distribution of a set of values and understand the outliers, you can use line graph, scatter plot and tables.
They will show whether the values are in a certain range or they deviate from others.
Tables are used when less figures and less complicated data were presented.
To understand the trend over time of some variables, you can use line graphs or tables.
Still the same, there should not be too many rows or columns if you use tables.
Line graphs visualize trend much more better.
To establish relationship between 2 or more variables, you can use scatter plot, line graph or tables.
Scatter plot would tell you whether the two variables are related and how the two variables relate to each other.
Line graph would compare the trend differences and tell you how.the trend related to one another.
A quantitative relationship would be very easy to figure out in tables.
Presenting language
Firstly, you should introduce what the graph is about. That is to give the overview of the graph.
Examples:
“The line graph compares 3 kinds of fast food consumption of teenagers in Australia between 1975 and 2000, a period of 25 years.”
Overview:
The pie chart is about…
The bars deal with…
The line graph clearly shows…
The slices of the pie compares…
The graph is divided into…
The table illustrates…
The line graph demonstrates…
Keywords:
Upward trend
increase
go up
rise
take an upward trend
dramatically increase
a sudden increase
dramatic upward trend
go up in incredible amount
steadily increase
Steady trend
level off
stabalize
remain constant
maintain the same level at
remain stable at
move up and down
fluctuate
experience a fluctuating period
Downward trend
decline
decrease
fall
drop
take a downward trend
slightly decrease
gradual fall
severely drop
drastically decline
steep drop
take a dramatic downward trend
Fluctuation
Percentage:
80%——four-fifths
55%——more than half
10%——one in ten
65%-75%——a significant proportion
5%——a very small number
75%-85%——a very large majority
10%-15%——a minority
Comparison:
was far higher than
had the highest
had a much higher
the lowest
were significantly lower
were similar
having the highest
was lightly higher than
had by far the lowest
was one hunderd times smaller than
were about half
was 10 times greater
Comparison & Contrasting:
Similarly,…
By contrast,…
A similar trend can be observed in …
The results for…,however,reveal a markedly different trend.
