使用period_range生成时间序列标签
import numpy as np
import pandas as pd
df = pd.DataFrame({'rate':np.random.randn(10)},index = pd.period_range('2001','2010',freq = 'Y'))print(df.index)
#输出
'''PeriodIndex(['2001', '2002', '2003', '2004', '2005', '2006', '2007', '2008',
'2009', '2010'],
dtype='period[A-DEC]', freq='A-DEC')'''
使用列表生成器生成的时间序列标签
import numpy as np
import pandas as pddf = pd.DataFrame({'rate':np.random.randn(10)},index = list(range(2001,2011)))
print(df.index)#输出
'''Int64Index([2001, 2002, 2003, 2004, 2005, 2006, 2007, 2008, 2009, 2010], dtype='int64')'''
将Periodindex中的时间数据提取出来,并转化成时间数值列表数据,全部代码如下:
import numpy as np
import pandas as pd
import timedf = pd.DataFrame({'rate':np.random.randn(10)},index = pd.period_range('2001','2010',freq = 'Y'))
df.index= df.index.to_timestamp()
ls_year = [time.strftime('%Y',df.index.to_pydatetime()[i].timetuple()) for i in range(len(df.index))]
ls_year = np.array(ls_year).astype(np.int64)
df.index = ls_year
print(df.index)#输出
'''Int64Index([2001, 2002, 2003, 2004, 2005, 2006, 2007, 2008, 2009, 2010], dtype='int64')'''
案列解析
注:代码是在jupyter notebook上运行
事情是酱紫的,在进行boken做折线图时,还是像往常一样进行随机数据和标签的指定,习惯使用正态分布的随机数和period_range生成时间序列标签,代码、生成的数据和图如下:
import numpy as np
import pandas as pd
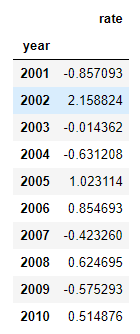
df = pd.DataFrame({'rate':np.random.randn(10)},index = pd.period_range('2001','2010',freq = 'Y'))
df.index.name = 'year'
print(df)from bokeh.plotting import figure,show
from bokeh.io import output_notebook
output_notebook()
from bokeh.models import ColumnDataSource
source = ColumnDataSource(df)p = figure(plot_width = 800, plot_height=440,title = '人口增长',x_axis_label = '年份',y_axis_label = '增长率',x_range = ls_year )
p.line(x = 'year', y = 'rate', source = source)
show(p)
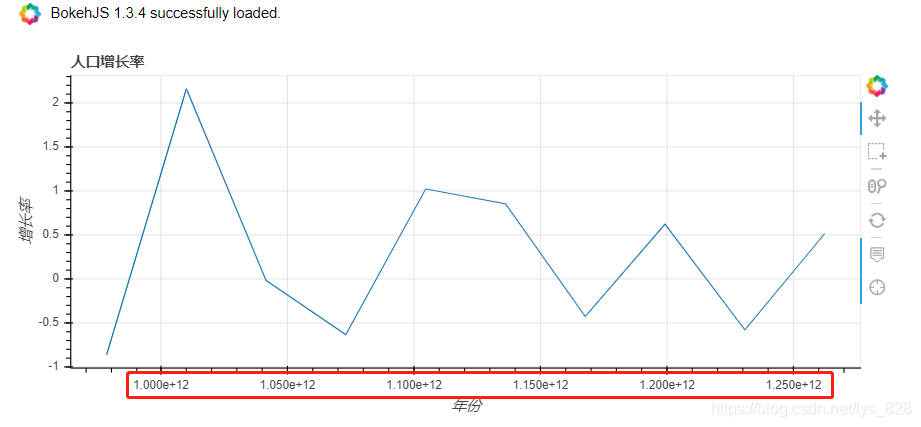
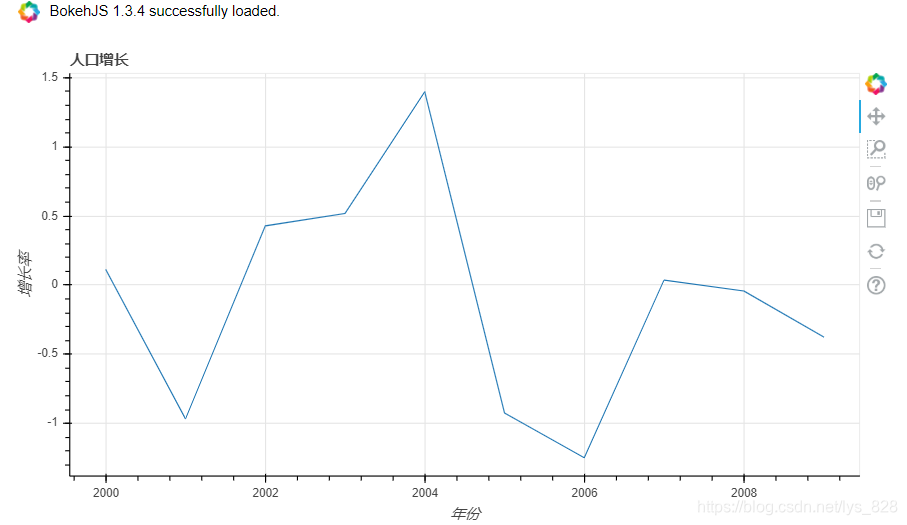
随后利用bokeh作图却发现图形中的x轴的标签数据并不是我想要的年份数据,这就出现问题了。然后尝试不使用period_range生成时间序列标签,而直接使用列表生成器list(range(2000,2010))进行标签时间的赋值,用下面的代码替换第三行的代码,其余代码不变,生成图像如下:
df = pd.DataFrame({'rate':np.random.randn(10)},index = list(range(2000,2010)))
方法
那么这个x轴年份标签数据的解决也就有一个思路 ——> 将period_range生成的PeriodIndex的时间序列数据转化成为时间数值列表数据就可以了
具体操作
首先是将period转化为DatetimeIndex时间戳,这时候就可以再将数据转为datetime格式,利用time库进行时间格式化输出,就可以完成时间数值列表的转换,具体代码如下:
import time
df = pd.DataFrame({'rate':np.random.randn(10)},index = pd.period_range('2001','2010',freq = 'Y'))
df.index= df.index.to_timestamp()#需要先将period数据转化为时间戳
df.index.to_pydatetime() #再将数据转为datetime格式
date = time.strftime('%Y',df.index.to_pydatetime()[0].timetuple()) #这里以第一个数据举例
print(date)#输出结果为‘2001’,type为‘str’
有了这一步之后,就可以进行时间数值列表的转化了,采用遍历循环,对数据的标签长度进行遍历,将上面的0改成i,就可以实现我们的要求了,其中ls_year就是成功将PeriodIndex的时间序列标签转化过来的时间数值列表数据,代码如下:
df = pd.DataFrame({'rate':np.random.randn(10)*10},index = pd.period_range('2001','2010',freq = 'Y'))
df.index= df.index.to_timestamp()
ls_year = [time.strftime('%Y',df.index.to_pydatetime()[i].timetuple()) for i in range(len(df.index))]
df.index = ls_year
df.index.name = 'year'
print(df)#输出的index一列数值是一样的,但是格式却不是一样
全部代码及出图
import numpy as np
import pandas as pd
import timedf = pd.DataFrame({'rate':np.random.randn(10)},index = pd.period_range('2001','2010',freq = 'Y'))
df.index= df.index.to_timestamp()#需要先将period数据转化为时间戳
ls_year = [time.strftime('%Y',df.index.to_pydatetime()[i].timetuple()) for i in range(len(df.index))]
df.index = ls_year
df.index.name = 'year'from bokeh.plotting import figure,show
from bokeh.io import output_notebook
output_notebook()
from bokeh.models import ColumnDataSource
from bokeh.models import HoverToolhover = HoverTool(tooltips=[('年份','@year'),
('增长率','@rate')])source = ColumnDataSource(df)
p = figure(plot_width = 800, plot_height=340,title = '增长率',x_axis_label = '年份',y_axis_label = '增长率',x_range = ls_year,
tools = [hover, 'box_select ,xwheel_zoom, reset,pan,crosshair'])p.line(x = 'year', y = 'rate', source = source)
show(p)