Table of Contents
OpenCV中HoughLines两个点为什么要乘以1000
原理图解
官方文档解释:
A line can be represented as
or in parametric form, as
where
is the perpendicular distance from origin to the line, and
is the angle formed by this perpendicular line and horizontal axis measured in counter-clockwise ( That direction varies on how you represent the coordinate system. This representation is used in OpenCV).
So if line is passing below the origin, it will have a positive rho and angle less than 180. If it is going above the origin, instead of taking angle greater than 180, angle is taken less than 180, and rho is taken negative. Any vertical line will have 0 degree and horizontal lines will have 90 degree.

笔者翻译及补充:
在笛卡尔坐标系中一条线可以表示为y = mx + c,其中斜率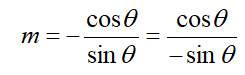 ,截距
,截距
在极坐标系中表示为ρ= xcosθ + ysinθ其中ρ是从原点到直线的垂直距离,θ是由此垂直线逆时针旋转和水平轴形成角度(该方向根据您表示坐标系的方式而变化。OpenCV用的是如下图所示坐标系,x轴向右,y轴向下)
如果线在原点以下通过(即截距c在原点下方),垂线ρ>0,0<θ<180°,如左图
如果它高于原点(即截距c在原点上方),垂线ρ<0,0<θ<180°,如右图
所有垂直线的角度都是0度,水平线为90度。


更多请参考官方文档
OpenCV中HoughLines两个点为什么要乘以1000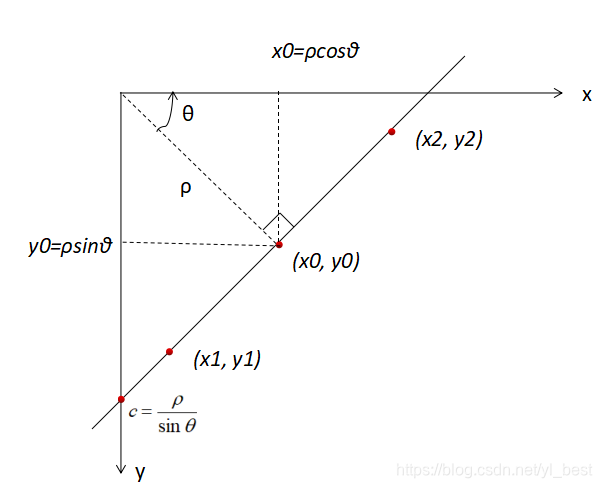
原理:直线的斜率不变
在Python中,返回的lines是一个三维的np.ndarray,shape为(x, 1, 2),
x代表检测到几条直线,最后一维2里面的元素分别是(rho, theta)
它储存了检测到的线条矢量,每一条线由具有两个元素的矢量表示(rho, theta),
这两个值只能是哪条确定直线,而不能确定线段是从哪开始到哪结束。
在图片上画直线需要两个点(x1, y1)和(x2, y2)(平面中两个点可以确定一条直线)
 (你也可以乘以500,800等)
假设x1-x0=1000(-sinθ),那么x1 = x0 + 1000(-sinθ)
假设y1-y0=1000(cosθ),那么y1 = y0 + 1000(cosθ)
同理可得x2 = x0 - 1000(-sinθ),y2 = y0 - 1000(cosθ)
Python代码实现
import cv2
import numpy as np


img = cv2.imread('F:/images/1.jpg')
cv2.imshow('Origin', img)       # 显示图片
gray = cv2.cvtColor(img, cv2.COLOR_BGR2GRAY)
edges = cv2.Canny(gray, 50, 150, apertureSize=3)

lines = cv2.HoughLines(edges, 1, np.pi / 180, 150)
imgCopy = img.copy()
print("lines.shape: ", lines.shape)
print("lines: ", lines)
print("lines[0]:", lines[0])

# 按照官网方法只能画出一条直线
for rho, theta in lines[0]:
    a = np.cos(theta)
    b = np.sin(theta)
    x0 = a * rho
    y0 = b * rho
    x1 = int(x0 + 1000 * (-b))
    y1 = int(y0 + 1000 * (a))
    x2 = int(x0 - 1000 * (-b))
    y2 = int(y0 - 1000 * (a))
    cv2.line(img, (x1, y1), (x2, y2), (255, 0, 255), 1)
    print("rho:{}, theta:{}".format(rho, theta))
    print("(x1,y1):{}".format((x1, y1)))
    print("(x2,y2):{}".format((x2, y2)))
cv2.imwrite('houghlines_old.jpg', img)      # 保存图片

# 正确做法是如此,以下三种方法都可
# # 方法一:在原来的三维数组中迭代
for line in lines:
    rho = line[0][0]  # 第一个元素是距离rho
    theta = line[0][1]  # 第二个元素是角度theta
# # 方法二:在原来的三维数组中迭代
# for i in range(0, lines.shape[0]):
#     rho, theta = lines[i, 0]
# # 方法三:先将三维数组转变为二维,再迭代
# lines = lines[:, 0, :]  # 提取为为二维
# print("new lines", lines)
# for line in lines:
#     rho = line[0]  # 第一个元素是距离rho
#     theta = line[1]  # 第二个元素是角度theta
    a = np.cos(theta)
    b = np.sin(theta)
    x0 = a * rho
    y0 = b * rho
    x1 = int(x0 + 1000 * (-b))
    y1 = int(y0 + 1000 * (a))
    x2 = int(x0 - 1000 * (-b))
    y2 = int(y0 - 1000 * (a))
    cv2.line(imgCopy, (x1, y1), (x2, y2), (0, 0, 255), 1)
cv2.imwrite('houghlines_new.jpg', imgCopy)  # 保存图片

cv2.imshow('Edged', edges)       # 显示图片
cv2.imshow('Hough_Old', img)     # 显示图片
cv2.imshow('Hough_New', imgCopy)    # 显示图片
cv2.waitKey(0)
图片效果
如下:


