问题描述:import matplotlib.pyplot as plt 报错:
ImportError: No module names 'tkinter'
解决方法:
dnf install python3-tkinter
说明:tkinter是内建库,所以这是在Linux下才会遇到的问题,Windows下安装Python是会带着tkinter的。网上有很多其他的解决方法(修改配置文档、重装Python等),我都没有尝试。直接install的方法是在stackoverflow上看到的。
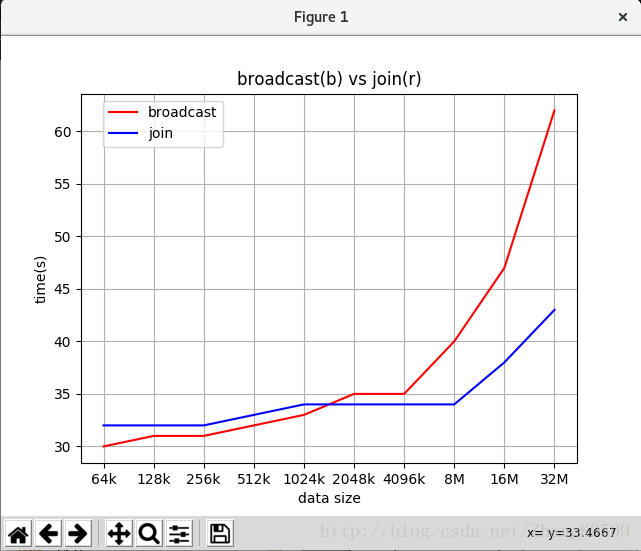
检验实例(在其他博文上看到的,亲测有效):
import matplotlib.pyplot as plt

x1 = [1, 2, 3, 4, 5, 6, 7, 8, 9, 10, 11, 12, 13]
y1 = [30, 31, 31, 32, 33, 35, 35, 40, 47, 62, 99, 186, 480]

x2 = [1, 2, 3, 4, 5, 6, 7, 8, 9, 10, 11, 12, 13, 14]
y2 = [32, 32, 32, 33, 34, 34, 34, 34, 38, 43, 54, 69, 116, 271]

x3 = [1, 2, 3, 4, 5, 6, 7, 8, 9, 10]
y3 = [30, 31, 31, 32, 33, 35, 35, 40, 47, 62]

x4 = [1, 2, 3, 4, 5, 6, 7, 8, 9, 10]
y4 = [32, 32, 32, 33, 34, 34, 34, 34, 38, 43]

group_labels = ['64k', '128k', '256k', '512k', '1024k', '2048k', '4096k',\
    '8M', '16M', '32M', '64M', '128M', '256M', '512M']
plt.title('broadcast(b) vs join(r)')
plt.xlabel('data size')
plt.ylabel('time(s)')

plt.plot(x3, y3, 'r', label='broadcast')
plt.plot(x4, y4, 'b', label='join')
plt.xticks(x3, group_labels, rotation=0)

plt.legend(bbox_to_anchor=[0.3, 1])
plt.grid()
plt.show()
运行结果如图: