2.2. What Is strace?
The strace tool is one of the most powerful problem determination tools available for Linux. It traces the thin layer (the system calls) between a process and the Linux kernel as shown in Figure 2.1. System call tracing is particularly useful as a first investigation tool or for problems that involve a call to the operating system.
strace 工具是 Linux 可用的最强大的问题诊断工具之一。它跟踪进程和 Linux 内核之间的接口 (系统调用), 如图2.1 所示。系统调用跟踪作为第一个调查工具或涉及调用操作系统的问题特别有用。
Figure 2.1. System calls define the layer between user code and the kernel.
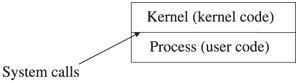
A system call is a special type of function that is run inside the kernel. It provides fair and secure access to system resources such as disk, network, and memory. System calls also provide access to kernel services such as inter-process communication and system information.
系统调用是在内核中运行的特殊类型的函数。它提供了对磁盘、网络和内存等系统资源的公平和安全访问。系统调用还提供对内核服务 (如进程间通信和系统信息) 的访问。
Depending on the hardware platform, a system call may require a gate instruction, a trap instruction, an interrupt instruction, or other mechanism to switch from the user code into the kernel. The actual mechanism is not really important for this discussion but rather that the code is switching from user mode directly into the kernel. It may help to explain this concept by comparing how a function and a system call work.
根据硬件平台, 系统调用可能需要gate指令、trap指令、中断指令或其他机制, 从用户空间切换到内核。对这个讨论,工作机制并不重要, 重要的是代码是从用户空间直接切换到内核。比较函数和系统调用的工作机制, 有助于解释这个概念。
A function call is fairly simple to understand as shown in the following assembly language (bear with me if you are not familiar with IA-32 assembly language):
函数调用很容易理解, 如下面的汇编语言所示 (如果您不熟悉 IA-32 汇编语言, 请与我联系):
080483e8 <_Z3barv>:
80483e8: 55 push %ebp
80483e9: 89 e5 mov %esp,%ebp
80483eb: 83 ec 08 sub $0x8,%esp
80483ee: 83 ec 08 sub $0x8,%esp
80483f1: 68 4e 61 bc 00 push $0xbc614e
80483f6: 6a 61 push $0x61
80483f8: e8 cf ff ff ff call 80483cc <_Z3fooci>
80483fd: 83 c4 10 add $0x10,%esp
8048400: c9 leave
8048401: c3 ret
The call instruction will jump to a function called foo (note: foo is mangled because it was compiled as a C++ function). The flow of execution always remains in the application code and does not require the kernel. The instructions for foo are just as easily examined, and a debugger can follow the call to foo without any issue. All instructions perform a single, specific action that is defined by the underlying hardware.
call指令将跳转到一个名为 foo 的函数 (注意: foo 因编译为 c++ 函数而被改变了)。执行流始终保留在应用程序代码中, 不需要内核参与。foo 的指令也同样容易检查, debugger可以在没有任何问题的情况下调用 foo。所有指令执行由底层硬件定义的单个特定操作。
| Note: In the preceding example, the arguments to function foo are pushed on to the stack by the function bar and are then subsequently used inside of foo. Arguments are passed into functions using a special convention called a procedure calling convention. The procedure calling convention also defines how return values are passed. This ensures that all of the functions for a program are using the same method to store and retrieve arguments when calling a function. 注意: 在前面的示例中, 函数 foo 的参数由函数bar推送到堆栈上, 随后在 foo 中使用。参数通过称为过程调用约定的特殊约定传递到函数中。调用约定的过程还定义了返回值的传递方式。这样可以确保程序的所有函数都使用相同的方法在调用函数时存储和检索参数。 |
| Note: For more information on assembly language and procedure calling conventions, refer to Chapter 5, “The Stack.” 注: 有关汇编语言和过程调用约定的详细信息, 请参阅5章 "堆栈"。 |
A system call is similar in concept to that of a function call but requires switching into the kernel to execute the actual system call instructions. Remember, a function call does not require the kernel. The method used to get into the kernel varies by platform, but on IA-32, the method used is a software interrupt as shown in the following example for the open system call:
系统调用与函数调用的概念类似, 但需要切换到内核以执行实际的系统调用指令。请记住, 函数调用不需要内核。用于进入内核的方法因平台而异, 但在 IA-32 上, 所使用的方法是软中断, 如下面的打开系统调用示例所示:
ion 214% nm /lib/libc.so.6 | egrep ' open$'
000bf9b0 W open
ion 216% objdump -d /lib/libc.so.6 |less
...
000bf9b0 <__libc_open>:
bf9b0: 53 push %ebx
bf9b1: 8b 54 24 10 mov 0x10(%esp,1),%edx
bf9b5: 8b 4c 24 0c mov 0xc(%esp,1),%ecx
bf9b9: 8b 5c 24 08 mov 0x8(%esp,1),%ebx
bf9bd: b8 05 00 00 00 mov $0x5,%eax
bf9c2: cd 80 int $0x80
bf9c4: 5b pop %ebx
bf9c5: 3d 01 f0 ff ff cmp $0xfffff001,%eax
bf9ca: 73 01 jae bf9cd <__libc_open+0x1d>
bf9cc: c3 ret
bf9cd: 53 push %ebx
Notice the interrupt instruction: int $0x80 and the move (mov) instruction directly preceding. The move instruction moves the system call number 5 into the %eax register, and the interrupt instruction switches the current thread of execution into the kernel. This is where the actual instructions are for the open system call. A bit of grepping through the system header files shows that the system call is indeed open.
注意中断指令: int $ 0x80 和移动 (mov) 指令前面。移动指令将编号5的系统调用移动到%eax 寄存器中, 中断指令将当前执行线程切换到内核中。这是用于打开系统调用的实际指令的位置。通过系统头文件的一点 grepping 显示系统调用确实是打开的。
ion 217% egrep open /usr/include/bits/syscall.h
#define SYS_open __NR_open
ion 218% egrep __NR_open /usr/include/asm/unistd.h
#define __NR_open 5
It’s worth noting programs that call the open system call are actually calling a function in the C library that, in turn, interrupts into the kernel to invoke the actual system call. The open function is a thin wrapper around the mechanism to call the open system call.
值得注意的是, 调用 open 系统调用的程序实际上调用 C 库中的一个函数, C库中的函数会中断到内核中调用实际的系统调用。open 函数是调用open系统调用的wrap函数。
From the user-space point of view, the interrupt instruction (int $0x80) is silently executed and performs all of the functionality of the open system call. The contents of any memory addresses or registers that were passed into the system call may change, but from the application’s point of view, it seems as if the single interrupt instruction performed the role of the system call. A normal debugger cannot follow the interrupt into the kernel but will treat it pretty much as any other instruction.
从用户空间的角度来看, 中断指令 (int $ 0x80) 是静默执行的, 并执行open系统调用的所有功能。传递到系统调用中的任何内存地址或寄存器的内容都可能发生更改, 但从应用程序的角度来看, 似乎单个中断指令执行了系统调用的角色。正常的调试器不能跟随中断进入内核, 但会像其他指令一样对待它。
Invoking a system call follows a calling convention called a system call calling convention. For function calls, the calling function and called function need to use the same calling convention. For system calls, the invoking function and the kernel need to follow the same calling convention. A failure to follow the convention of either side of the function or system call will result in unexpected behavior.
调用系统调用遵循称为系统调用约定。对于函数调用, 调用函数和被调用函数需要使用相同的调用约定。对于系统调用, 调用函数和内核需要遵循相同的调用约定。如果不遵循函数或系统调用的任一侧的约定, 将导致意外的行为。
The basic system call calling convention for Linux on IA-32 is simple. The arguments to a system call are stored in the following registries:
IA-32 上 Linux 的基本系统调用约定很简单。系统调用的参数存储在以下注册表中:
| Argument # |
Registry |
| 1 |
EBX |
| 2 |
ECX |
| 3 |
EDX |
| 4 |
ESI |
| 5 |
EDI |
The return value for a system call is stored in the EAX register from within the kernel. In other words, a system call could be represented as:
系统调用的返回值存储在内核中的 EAX 寄存器中。换言之, 系统调用可以表示为:
EAX = syscall(EBX, ECX, EDX, ESI, EDI) ;
If an error occurs, a negative return code will be returned (that is, EAX will be set to a negative value). A zero or positive value indicates the success of a system call.
如果发生错误, 将返回负值 (即, EAX 将被设置为负值)。零值或正值表示系统调用成功。
Going back to the assembly listing for the open call in libc (the C library), it is easy to see the system call calling convention at work:
返回到 libc (C 库) 中打开的调用的程序集列表, 在工作中很容易看到系统调用约定:
bf9b1: 8b 54 24 10 mov 0x10(%esp,1),%edx
bf9b5: 8b 4c 24 0c mov 0xc(%esp,1),%ecx
bf9b9: 8b 5c 24 08 mov 0x8(%esp,1),%ebx
bf9bd: b8 05 00 00 00 mov $0x5,%eax
bf9c2: cd 80 int $0x80
bf9c4: 5b pop %ebx
bf9c5: 3d 01 f0 ff ff cmp $0xfffff001,%eax
bf9ca: 73 01 jae bf9cd <__libc_open+0x1d
The three arguments to the system call are set in registers ebx, ecx, and edx using the first three instructions. The system call number for the open system call is set in EAX and the int $0x80 instruction makes the actual transition into the kernel. After the system call, the EAX register contains the return code. If the return code is negative, the absolute value is the corresponding errno. For example a return code (in EAX) of -2 would mean an errno of 2 or ENOENT.
系统调用的三参数在使用前三指令的寄存器 ebx、ecx 和 edx 中设置。open系统调用的系统调用号设置在 EAX 中, 0x80 指令使实际转换为内核。在系统调用之后, EAX 寄存器包含返回代码。如果返回代码为负值, 则绝对值为相应的 errno。例如, 返回代码 (在EAX)-2 将意味着 errno 2 或 ENOENT。
2.2.1. More Information from the Kernel Side
We have discussed the application side of system calls and the system call mechanism itself. It is worth a quick overview of the kernel side of a system call to complete the picture. This is also a good introduction for how the strace tool works. We’ve already mentioned the int 0x80 instruction, but let’s take a look at how this works in the kernel.
讨论了系统调用的应用程序和系统调用机制本身。快速浏览系统调用的内核实现,对系统调用有个整体的认识,这是非常有用的。这也是对 strace 工具如何工作的一个很好的介绍。我们已经提到了 int 0x80 指令, 让我们来看看它是如何在内核中工作的。
The int $0x80 instruction traps into the kernel and invokes 0x80 in the IDT (interrupt descriptor table). According to include/asm-i386/hw_irq.h, SYSCALL_VECTOR is 0x80, which matches the value after the int instruction.
int $ 0x80 指令trap进入内核, 并调用 0x80 (中断描述符表)。根据include/asm-i386/hw_irq.h, SYSCALL_VECTOR 是 0x80, 这与 int 指令后的值匹配。
#define SYSCALL_VECTOR 0x80
The actual 0x80 entry in the interrupt descriptor table is set in arch/i386/kernel/traps.c with the following code:
中断描述符表中的实际值是0x80, 在arch/i386/kernel/traps. c 有如下代码:
set_system_gate(SYSCALL_VECTOR,&system_call);
This sets entry 0x80 in the interrupt descriptor table to the kernel entry point system_call which is defined in entry.S. Curious readers can take a look at what happens in the kernel when the interrupt is raised by looking at arch/i386/kernel/entry.S in the kernel source. Among other things, this assembly language file includes the support for calling and returning from a system call. Here is a snippet from entry.S that contains the assembly code that is called first by the kernel when the int 0x80 triggered:
在"中断描述符" 表中设置0x80指向内核系统调用。好奇的读者可以通过查看 arch/i386/kernel/entry.S 来查看内核中发生的中断。除此之外, 汇编语言还支持系统调用的调用和返回。下面是entry.S代码段,包含当 int 0x80 触发时内核首先调用的汇编代码:
ENTRY(system_call)
pushl %eax # save orig_eax
SAVE_ALL
GET_CURRENT(%ebx)
testb $0x02,tsk_ptrace(%ebx) # PT_TRACESYS
jne tracesys
cmpl $(NR_syscalls),%eax
jae badsys
...
call *SYMBOL_NAME(sys_call_table)(,%eax,4)
movl %eax,EAX(%esp) # save the return value
| Note: Some of the optional assembly language has been excluded for clarity. 注意: 某些与此无关的汇编语言已被排除以使其清晰。 |
The testb instruction tests to see whether ptrace is turned on. If so, the code immediately jumps to tracesys (explained in the following paragraphs). Otherwise, the code follows the normal code path for system calls. The normal code path then compares the system call number in EAX to the highest numbered system call. If it is larger, then the system call is invalid. Assuming that the system call number is in the valid range, the actual system call is called with the following instruction:
testb 指令查看 ptrace 是否已打开。如果是这样, 代码立即跳转到 tracesys (在下面解释)。否则, 代码将遵循系统调用的正常代码路径。然后, 正常代码路径将 EAX 中的系统调用编号与最高编号的系统调用进行比较。如果它较大, 则系统调用无效。假定系统调用号位于有效范围内, 则使用以下指令,调用实际的系统调用:
call *SYMBOL_NAME(sys_call_table)(,%eax,4)
Notice that this instruction indexes into the system call table (which explains why system calls have numbers). Without a number, it would be very expensive to find the right system call!
The strace tool works with the kernel to stop a program when it enters and when it exits a system call. The strace utility uses a kernel interface called ptrace to change the behavior of a process so that it stops at each system call entry and exit. It also uses ptrace to get information about the stopped process to find the system call, the arguments to the system call, and the return code from the system call.
请注意, 此指令将索引到系统调用表中 (这解释了为什么系统调用具有数字)。没有一个数字, 找到正确的系统调用是非常耗费时间的事! strace 工具与内核配合,在程序进入和退出系统调用时停止它。strace 程序使用名为 ptrace 的内核接口来改变进程的行为, 使其在系统调用入口和退出时停止。它还使用 ptrace 获取有关停止进程的信息, 以查找系统调用、系统调用的参数以及系统调用的返回代码。
The kernel support for ptrace is visible in the system_call code in entry.S (this is from the ENTRY(system_call) example previously):
ptrace 的内核支持在entry.S中的 system_call 代码中可见。(这是前面的ENTRY(system_call) 示例):
testb $0x02,tsk_ptrace(%ebx) # PT_TRACESYS
jne tracesys
The first instruction tests whether ptrace was used to trace system calls for this process (that is, ptrace was used with PT_TRACESYS/PTRACE_SYSCALL). The second instruction jumps to the tracesys function if the conditions from the previous instruction are met. In other words, if system calls are being traced through the ptrace facility for this process, the tracesys function is called instead of the normal system calling code.
第一个指令测试 ptrace 是否用于跟踪这个过程的系统调用 (即, ptrace 与 PT_TRACESYS/PTRACE_SYSCALL 配合使用)。如果满足上一个指令的条件, 则第二个指令跳转到 tracesys 函数。换言之, 如果系统调用是通过 ptrace 设备跟踪此过程, 则调用 tracesys 函数而不是正常的系统调用代码。
tracesys:
movl $-ENOSYS,EAX(%esp)
call SYMBOL_NAME(syscall_trace)
movl ORIG_EAX(%esp),%eax
cmpl $(NR_syscalls),%eax
jae tracesys_exit
call *SYMBOL_NAME(sys_call_table)(,%eax,4)
movl %eax,EAX(%esp) # save the return value
tracesys_exit:
call SYMBOL_NAME(syscall_trace)
jmp ret_from_sys_call
badsys:
movl $-ENOSYS,EAX(%esp)
jmp ret_from_sys_call
The tracesys function immediately sets the EAX to -ENOSYS (this is important for the strace tool). It then calls the syscall_trace function (explained later) to support ptrace. The tracesys function then does some validation of the system call number, calls the actual system call and then traces the exit of the system call. Notice that trace is called twice using exactly the same method [call SYMBOL_NAME(syscall_trace)], once before the system call and once after. The only way to tell the two calls apart is that EAX is set to -ENOSYS in the first trace call.
tracesys 函数立即将 EAX 设置为 ENOSYS (这对 strace 工具很重要)。然后调用 syscall_trace 函数 (稍后解释) 以支持 ptrace。然后, tracesys 函数对系统调用号进行一些验证, 调用实际的系统调用, 然后跟踪系统调用的退出。请注意, 在系统调用之前和之后一次, 使用完全相同的方法 [调用 SYMBOL_NAME (syscall_trace)] 调用两次跟踪。唯一可以区分两个调用的方法是在第一个跟踪调用中 EAX 设置为 ENOSYS。
The strace call is notified whenever a traced program enters or exits a system call. In the syscall_trace function (used for both system call entry and exit), it is easy to see the expected ptrace functionality with the lines highlighted in bold:
当跟踪的程序进入或退出系统调用时, 将通知 strace 调用。在 syscall_trace 函数 (用于系统调用输入和退出) 中, 使用粗体并且突出显示的行很容易看到预期的 ptrace 功能:
Code View: Scroll / Show All
asmlinkage void syscall_trace(void)
{
if ((current->ptrace & (PT_PTRACED|PT_TRACESYS)) !=
(PT_PTRACED|PT_TRACESYS))
return;
/* the 0x80 provides a way for the tracing parent to distinguish between a syscall stop and SIGTRAP delivery */
current->exit_code = SIGTRAP | ((current->ptrace & PT_TRACESYSGOOD)
? 0x80 : 0);
current->state = TASK_STOPPED;
notify_parent(current, SIGCHLD);
schedule();
/*
* this isn't the same as continuing with a signal, but it will do
* for normal use. strace only continues with a signal if the
* stopping signal is not SIGTRAP. -brl
*/
if (current->exit_code) {
send_sig(current->exit_code, current, 1);
current->exit_code = 0;
}
}
The line, current->state = TASK_STOPPED; essentially stops the process/thread. The line, notify_parent(current, SIGCHLD); notifies the parent (in this case, the strace tool) that the traced process has stopped. Notice how simple the code is, and yet it supports stopping a process on system call entry and exit. The kernel is just stopping the process, but it does not actively send any information to the strace tool about the process. Most of the hard work is done by the strace tool.
行 current->state = TASK_STOPPED;实质上停止进程/线程。这行, notify_parent(current, SIGCHLD);通知父进程 (在本例中为 strace 工具) 被跟踪的进程已停止。请注意代码的简单程度, 但它支持在系统调用进入和退出过程中停止进程。内核正在停止进程, 但它不主动向 strace 工具发送有关该进程的任何信息。大部分的工作都是由 strace 工具完成的。
Now that you have a basic understanding of how system calls work and how strace is supported in the kernel, let’s take a look at how to use strace to solve some real problems.
现在, 您已经基本了解了系统调用的工作方式以及内核支持 strace 的方式, 让我们来看看如何使用 strace 来解决一些真正的问题。
The strace tool should be used as a first investigation tool or for problems that are related to the operating system. The phrase “related to the operating system” does not necessarily mean that the operating system is at fault but rather that it is involved in a problem. For example, a program may fail because it cannot open a file or because it cannot allocate memory. Neither is necessarily the fault of the operating system, but the system call trace will clearly show the cause of either problem. Recognizing that a problem is related to the OS becomes easier with experience, but given that strace is also useful as a first investigation tool, this isn’t a problem for those just learning how to use it. Experienced users might use strace either way until they narrow down the scope of a problem.
应用strace 工具开始调查工具或与操作系统相关的问题。"与操作系统相关" 这一短语并不一定意味着操作系统是错误的, 而是涉及到一个问题。例如, 程序可能会失败, 因为它无法打开文件或无法分配内存。两者都不一定是操作系统的故障, 但系统调用跟踪将清楚地显示任何问题的原因。认识到一个问题与操作系统的关系变得更容易, 但考虑到 strace 作为第一个调查工具也是有用的, 对于那些仅仅学习如何使用它的人来说, 这并不是问题。有经验的用户可能会使用 strace, 直到缩小问题的范围。
The strace tool is rarely, if ever, useful for code logic problems because it only provides information about the system calls that were invoked by a process.
strace 工具对于代码逻辑问题很少有用, 因为它只提供有关进程调用的系统调用的信息。
There is another utility called ltrace that provides function-level tracing, but it is rarely used compared to strace. The ltrace tool can display both function calls and system calls, but in many cases, strace is still more useful because:
还有另一个称为 ltrace 的实用程序提供了函数级跟踪, 但与 strace 相比很少使用它。ltrace 工具可以同时显示函数调用和系统调用, 但在许多情况下, strace 仍然更有用, 因为:
- It produces less information without being less useful in most cases.
- 在大多数情况下, 它会产生较少的信息而不减少用处。
- System calls are very standard and have man pages. Not all functions do.
- 系统调用是非常标准的, 并有帮助手册。并非所有函数都有帮助手册。
- Functions are not usually as interesting for problem determination.
- 函数通常并不像对问题的定位那么有趣。
- ltrace relies on dynamic linking to work. Statically linked programs will show no output. Also, calls within the executable object itself will not show up in ltrace.
- ltrace 依赖于工作的动态链接。静态链接的程序将不显示输出。此外, 在可执行对象内的调用也不会显示在 ltrace 中。
The ltrace tool can still be useful for problem determination when more detail is needed, but strace is usually the best tool to start with.
当需要更多详细信息时, ltrace 工具仍可用于问题定位, 但 strace 通常是最佳工具。
Let’s refocus back on the strace tool...
让我们重新关注 strace 工具..。
The following example uses a simple program to show how to use strace. The program attempts to open a file as “read only” and then exits. The program only contains one system call, open:
下面的示例使用一个简单程序来演示如何使用 strace。程序尝试以 "只读" 的状态打开文件, 然后退出。程序只包含一个系统调用, 打开:
#include <sys/types.h>
#include <sys/stat.h>
#include <fcntl.h>
int main( )
{
int fd ;
int i = 0 ;
fd = open( "/tmp/foo", O_RDONLY ) ;
if ( fd < 0 )
i=5;
else
i=2;
return i;
}
There is some trivial code after the call to open, the details of which will not be shown in the strace output because the trivial code does not invoke any system calls. Here is the system call trace output:
在调用打开后有一些琐碎的代码, 其细节将不会显示在 strace 输出中, 因为琐碎代码不调用任何系统调用。以下是系统调用跟踪输出:
Code View: Scroll / Show All
ion 216% gcc main.c -o main
ion 217% strace -o main.strace main
ion 218% cat main.strace
1. execve("./main", ["main"], [/* 64 vars */]) = 0
2. uname({sys="Linux", node="ion", ...}) = 0
3. brk(0) = 0x80494f8
4. mmap2(NULL, 4096, PROT_READ|PROT_WRITE, MAP_PRIVATE|MAP_ANONYMOUS, -1, 0) = 0x40013000
5. open("/etc/ld.so.preload", O_RDONLY) = -1 ENOENT (No such file or directory)
6. open("/lib/i686/mmx/libc.so.6", O_RDONLY) = -1 ENOENT (No such file or directory)
7. stat64("/lib/i686/mmx", 0xbfffe59c) = -1 ENOENT (No such file or directory)
8. open("/lib/i686/libc.so.6", O_RDONLY) = -1 ENOENT (No such file or directory)
9. stat64("/lib/i686", 0xbfffe59c) = -1 ENOENT (No such file or directory)
10.open("/lib/mmx/libc.so.6", O_RDONLY) = -1 ENOENT (No such file or directory)
11.stat64("/lib/mmx", 0xbfffe59c) = -1 ENOENT (No such file or directory)
12.open("/lib/libc.so.6", O_RDONLY) = 3
13.read(3, "\177ELF\1\1\1\0\0\0\0\0\0\0\0\0\3\0\3\0\1\0\0\0\300\205"..., 1024) = 1024
14.fstat64(3, {st_mode=S_IFREG|0755, st_size=1312470, ...}) = 0
15.mmap2(NULL, 1169856, PROT_READ|PROT_EXEC, MAP_PRIVATE, 3, 0) = 0x40014000
16.mprotect(0x40128000, 39360, PROT_NONE) = 0
17.mmap2(0x40128000, 24576, PROT_READ|PROT_WRITE, MAP_PRIVATE|MAP_FIXED, 3, 0x113) = 0x40128000
18.mmap2(0x4012e000, 14784, PROT_READ|PROT_WRITE, MAP_PRIVATE|MAP_FIXED|MAP_ANONYMOUS, -1, 0) = 0x4012e000
19.close(3) = 0
20.open("/tmp/foo", O_RDONLY) = -1 ENOENT (No such file or directory)
21.exit(5) = ?
| Note: The line numbers to the left are not actually part of the strace output and are used for illustration purposes only. 注意: 左边的行号实际上不是 strace 输出的一部分, 仅用于说明。 |
In this strace output, the vast majority of the system calls are actually for process initialization. In fact, the only system call (on line 20) from the actual program code is open(“/tmp/foo”, O_RDONLY). Also notice that there are no system calls from the if statement or any other code in the program because the if statement does not invoke a system call. As mentioned before, system call tracing is rarely useful for code logic problems, but it can be very useful to find a problem that relates to the interaction with the operating system.
在这个 strace 输出中, 绝大多数的系统调用实际上是用于进程初始化的。实际上, 唯一的系统调用 (在20行) ,实际的程序代码是open("/tmp/foo", O_RDONLY)。还应注意, if 语句或程序中的任何其他代码都没有系统调用, 因为 if 语句不调用系统调用。如前所述, 系统调用跟踪对于代码逻辑问题很少有用, 但是找到与操作系统交互相关的问题非常有用。
It takes a bit of practice to understand a system call trace, but a good example can go a long way. For those who are not familiar with the standard system calls, it is quick and easy to read the man pages for the system calls for more information. For example, the first system call in the trace is execve. The man page can be referenced using
了解系统调用跟踪需要一些练习, 但是一个好的例子可以很长的一段路。对于那些不熟悉标准系统调用的人来说, 快速且便捷的方法是阅读系统调用的帮助手册。例如, 跟踪中的第一个系统调用是 execve。可以使用帮助手册
ion 225% man 2 execve
The arguments for a system call in the strace output should match those listed in the man page. The first argument listed in the man page for execve is const char *filename, and the documentation in the man page mentions that this system call executes the program pointed to by filename. The functionality of execve is not the point of this but rather that man pages can be used to help understand strace output for beginners.
strace 输出中的系统调用的参数应与 帮助手册中列出的变量匹配。execve 的手册页中列出的第一个参数是 const 字符 * 文件名, 并且手册页中的文档提到此系统调用执行由文件名指向的程序。execve 的功能不是重点, 重点是可以用来帮助理解初学者的 strace 输出的帮助手册。
Line #1: The execve system call (or one of the exec system calls) is always the first system call in the strace output if strace is used to trace a program off the command line. The strace tool forks, executes the program, and the exec system call actually returns as the first system call in the new process. A successful execve system call will not return in the calling process’ code (because exec creates a new process).
如果 strace 用于从命令行跟踪程序, 则 execve 系统调用 (或一个 exec 系统调用) 始终是 strace 输出中的第一个系统调用。strace fork, 执行程序, 而 exec 系统调用实际返回为新进程中的第一个系统调用。成功的 execve 系统调用不会在调用进程代码中返回 (因为 exec 创建了一个新进程)。
Line #2: The uname system call is being called for some reason—but is not immediately important.
由于某种原因, uname 系统调用被调用, 但并不立即重要。
Line #3: The brk system call is called with an argument of zero to find the current “break point.” This is the beginning of memory management (for example, malloc and free) for the process.
brk 系统调用的参数是零, 以查找当前的 "断点"。这是进程的内存管理 (例如, malloc 和free) 的启点。
Line #4: The mmap call is used to create an anonymous 4KB page. The address of this page is at 0x40013000.
mmap 系统调用用于创建4KB匿名页。本页地址在0x40013000。
Line #5: This line attempts to open the ld.so.preload file. This file contains a list of ELF shared libraries that are to be pre-loaded before a program is able to run. The man page for ld.so may have additional information.
此行尝试打开 ld.so.preload 文件。此文件包含要在程序运行之前预加载的 ELF 共享库的列表。Ld.so的帮助手册可能有额外的信息。
Lines #6 - #12. These lines involve finding and loading the libc library.
这些行涉及查找和加载 libc 库。
Line #13: Loads in the ELF header for the libc library.
在ELF 报头中加载libc 库。
Line #14: Gets more information (including size) for the libc library file.
获取 libc 库文件的更多信息 (包括大小)。
Line #15: This line actually loads (mmaps) the contents of libc into memory at address 0x40014000.
该行实际将 libc 的内容加载到内存中的地址0x40014000 中 mmaps。
Line #16: This removes any protection for a region of memory at 0x40128000 for 39360 bytes.
这将消除对0x40128000 中内存区域的39360字节的任何保护。
Line #17: This line loads the data section at address 0x40128000 for 24576 bytes. The address of 0x40128000 is 0x114000 bytes from the beginning of the memory segment (0x40014000). According to the ELF layout of libc.so.6, the data section starts at 0x114920, but that section must be aligned on 0x1000 boundaries (hence the offset of 0x114000).
此行在地址0x40128000 中加载24576字节数据。0x40128000是从内存段 (0x40014000) 开始的0x114000 字节的地址。根据 libc.so.6 的ELF布局, 数据部分从0x114920 开始, 但该节必须在0x1000 边界 (即0x114000 的偏移量) 上对齐。
Code View: Scroll / Show All
ion 722% readelf -l /lib/libc.so.6
Elf file type is DYN (Shared object file)
Entry point 0x185c0
There are 7 program headers, starting at offset 52
Program Headers:
Type Offset VirtAddr PhysAddr FileSiz MemSiz Flg Align
PHDR 0x000034 0x00000034 0x00000034 0x000e0 0x000e0 R E 0x4
INTERP 0x113610 0x00113610 0x00113610 0x00013 0x00013 R 0x1
[Requesting program interpreter: /lib/ld-linux.so.2]
LOAD 0x000000 0x00000000 0x00000000 0x113918 0x113918 R E 0x1000
LOAD 0x113920 0x00114920 0x00114920 0x04f8c 0x090a0 RW 0x1000
DYNAMIC 0x117ba4 0x00118ba4 0x00118ba4 0x000d8 0x000d8 RW 0x4
NOTE 0x000114 0x00000114 0x00000114 0x00020 0x00020 R 0x4
GNU_EH_FRAME 0x113624 0x00113624 0x00113624 0x002f4 0x002f4 R 0x4
ion 723% readelf -S /lib/libc.so.6
There are 53 section headers, starting at offset 0x11d170:
Section Headers:
[Nr] Name Type Addr Off Size ES Flg Lk Inf Al
...
[16] .data PROGBITS 00114920 113920 0031f8 00 WA 0 0 32
...
[25] .bss NOBITS 001198c0 1188c0 004100 00 WA 0 0 32
...
Line #18: Creates an anonymous memory segment for the bss section (more on this in the ELF chapter). This is a special section of a loaded executable or shared library for uninitialized data. Because the data is not initialized, the storage for it is not included in an ELF object like a shared library (there are no real data values to store). Instead, memory is allocated for the bss section when the library is loaded. One thing worth noting is that part (0x740 bytes) of the bss section is on the last page of the data section. Whenever dealing with memory at the system level, the minimum unit of memory is always a page size, 0x1000 by default on IA-32. The offset of the bss is 0x00114920, which is not on a page size boundary. The next page boundary is at 0x4012e000, which is where the rest of the memory for the bss segment is allocated. Given that the size of the bss is 0x4100 and since 0x740 of the bss is included on the last page of the data section, the rest of the bss segment is 0x39C0 (14784 in decimal) in size and is allocated as expected at 0x4012e000.
为 bss 部分创建一个匿名内存段 (在 ELF 章节中有更多内容)。这是加载的可执行文件或共享库中未初始化数据的特殊部分。由于数据未初始化, 因此它的存储不像共享库这样包含在 ELF 对象中 (没有要存储的实际数据值)。而是在加载库时为 bss 部分分配内存。值得注意的是, "bss" 部分 (0x740 字节) 位于数据节的最后一页上。每当在系统级别处理内存时, 最小内存单位始终是页面大小, 在IA-32系统上,默认大小是 0x1000。bss 的偏移量为 0x00114920, 这个不能在页面大小边界上。下一页边界位于 0x4012e000, 即为 bss 段分配内存的其余部分。考虑到 bss 的大小是0x4100 的, 而且由于0x740 的最后一页中包含了 bss 的内容, 因此, bss 段的其余部分以大小 0x39C0 (14784 十进制), 并按预期在0x4012e000 中分配。
Line #19: Closes the file descriptor for libc.
关闭 libc 的文件描述符。
Line #20: The only system call from the actual program code. This is the same open call from the source code just listed.
来自实际程序代码的唯一系统调用。这是刚刚列出的源代码打开的调用。
Line #21: Exits the process with a return code of 5.
退出进程, 返回代码为5
2.2.4. Same Program Built Statically
Statically built programs do not require any external libraries for program initialization. This means there is no need to find or load any shared libraries, making the program initialization much simpler.
静态生成的程序不需要任何外部库来进行程序初始化。这意味着无需查找或加载任何共享库, 从而使程序初始化变得更加简单。
Code View: Scroll / Show All
ion 230% gcc main.c -o main -static
ion 231% strace main
execve("./main", ["main"], [/* 64 vars */]) = 0
fcntl64(0, F_GETFD) = 0
fcntl64(1, F_GETFD) = 0
fcntl64(2, F_GETFD) = 0
uname({sys="Linux", node="ion", ...}) = 0
geteuid32() = 7903
getuid32() = 7903
getegid32() = 200
getgid32() = 200
brk(0) = 0x80a3ce8
brk(0x80a3d08) = 0x80a3d08
brk(0x80a4000) = 0x80a4000
brk(0x80a5000) = 0x80a5000
open("/tmp/foo", O_RDONLY) = -1 ENOENT (No such file or directory)
_exit(5) = ?
The strace output is quite different when the program is linked statically. There are some other system calls (the purpose of which is not important for this discussion), but note that the program does not load libc or any other library. Also worth nothing is that ltrace will not show any output for this program since it is built statically.
当程序被静态链接时, strace 输出是完全不同的。还有一些其他系统调用 (其目的对此讨论并不重要), 但请注意, 该程序不加载 libc 或任何其他库。也不值得的是, ltrace 不会显示这个程序任何输出, 因为它是静态构建的。
