在《用pandas进行数据清洗(一)(Data Analysis Pandas Data Munging/Wrangling)》中,我们介绍了数据清洗经常用到的一些pandas命令。
接下来看看这份数据的具体清洗步骤:
   Transaction_ID Transaction_Date Product_ID Quantity Unit_Price Total_Price
0               1       2010-08-21          2        1         30          30
1               2       2011-05-26          4        1         40          40
2               3       2011-06-16          3      NaN         32          32
3               4       2012-08-26          2        3         55         165
4               5       2013-06-06          4        1        124         124
5               1       2010-08-21          2        1         30          30
6               7       2013-12-30
7               8       2014-04-24          2        2        NaN         NaN
8               9       2015-04-24          4        3         60        1800
9              10       2016-05-08          4        4          9          36
1,查看数据的行列数:
print(transactions.shape)
(10, 6)
数据一共有10行6列。
2,查看数据的数据类型:
print(transactions.dtypes)
Transaction_ID               int64
Transaction_Date    datetime64[ns]
Product_ID                  object
Quantity                    object
Unit_Price                  object
Total_Price                 object
Transaction_ID列是整数,Transaction_Date列是时间序列,其余几列都是object。
3,以上两步也可以用info()命令替代:
RangeIndex: 10 entries, 0 to 9
Data columns (total 6 columns):
Transaction_ID      10 non-null int64
Transaction_Date    10 non-null datetime64[ns]
Product_ID          10 non-null object
Quantity            9 non-null object
Unit_Price          9 non-null object
Total_Price         9 non-null object
dtypes: datetime64[ns](1), int64(1), object(4)
memory usage: 560.0+ bytes
None
RangeIndex: 10 entries 表示一共有10行记录,Data columns (total 6 columns) 表示一共有6列,接下去显示的是每列非空数值的个数以及类型。
4,查看是哪几行,哪几列有缺失值,以及一共有多少行多少列有缺失值:
print("哪几行有缺失值:")
print(transactions.apply(lambda x: sum(x.isnull()),axis=1))
哪几行有缺失值:
0    0
1    0
2    1
3    0
4    0
5    0
6    0
7    2
8    0
9    0
print("哪几列有缺失值:")
print(transactions.apply(lambda x: sum(x.isnull()),axis=0))
哪几列有缺失值:
Transaction_ID      0
Transaction_Date    0
Product_ID          0
Quantity            1
Unit_Price          1
Total_Price         1
print("一共有多少行有缺失值:")
print(len(transactions.apply(lambda x: sum(x.isnull()),axis=1).nonzero()[0]))
一共有多少行有缺失值:
2
print("一共有多少列有缺失值:")
print(len(transactions.apply(lambda x: sum(x.isnull()),axis=0).nonzero()[0]))
一共有多少列有缺失值:
3
需要注意的是,此数据集中有一些有空格的地方,也应视为缺失值,因此需要把空格处转换为NaN显示:
transactions=transactions.applymap(lambda x: np.NaN if str(x).isspace() else x)
现在数据集显示如下:
   Transaction_ID Transaction_Date  Product_ID  Quantity  Unit_Price  \
0               1       2010-08-21         2.0       1.0        30.0
1               2       2011-05-26         4.0       1.0        40.0
2               3       2011-06-16         3.0       NaN        32.0
3               4       2012-08-26         2.0       3.0        55.0
4               5       2013-06-06         4.0       1.0       124.0
5               1       2010-08-21         2.0       1.0        30.0
6               7       2013-12-30         NaN       NaN         NaN
7               8       2014-04-24         2.0       2.0         NaN
8               9       2015-04-24         4.0       3.0        60.0
9              10       2016-05-08         4.0       4.0         9.0

   Total_Price
0         30.0
1         40.0
2         32.0
3        165.0
4        124.0
5         30.0
6          NaN
7          NaN
8       1800.0
9         36.0
5,去除缺失值:
transactions.dropna(inplace=True)
6,当然,我们也可以选择不去除缺失值,而是进行填充,这种方法适用于数据量少的情况下,这里选择向后填充:
transactions.fillna(method='backfill',inplace=True)
现在数据集如下:
   Transaction_ID Transaction_Date  Product_ID  Quantity  Unit_Price  \
0               1       2010-08-21         2.0       1.0        30.0
1               2       2011-05-26         4.0       1.0        40.0
2               3       2011-06-16         3.0       3.0        32.0
3               4       2012-08-26         2.0       3.0        55.0
4               5       2013-06-06         4.0       1.0       124.0
5               1       2010-08-21         2.0       1.0        30.0
6               7       2013-12-30         2.0       2.0        60.0
7               8       2014-04-24         2.0       2.0        60.0
8               9       2015-04-24         4.0       3.0        60.0
9              10       2016-05-08         4.0       4.0         9.0

   Total_Price
0         30.0
1         40.0
2         32.0
3        165.0
4        124.0
5         30.0
6       1800.0
7       1800.0
8       1800.0
9         36.0
7,现在来试一下用均值填充:
transactions.fillna(transactions.mean(),inplace=True)
现在数据集如下:
   Transaction_ID Transaction_Date  Product_ID  Quantity  Unit_Price  \
0               1       2010-08-21         2.0       1.0        30.0
1               2       2011-05-26         4.0       1.0        40.0
2               3       2011-06-16         3.0       2.0        32.0
3               4       2012-08-26         2.0       3.0        55.0
4               5       2013-06-06         4.0       1.0       124.0
5               1       2010-08-21         2.0       1.0        30.0
6               7       2013-12-30         3.0       2.0        47.5
7               8       2014-04-24         2.0       2.0        47.5
8               9       2015-04-24         4.0       3.0        60.0
9              10       2016-05-08         4.0       4.0         9.0

   Total_Price
0       30.000
1       40.000
2       32.000
3      165.000
4      124.000
5       30.000
6      282.125
7      282.125
8     1800.000
9       36.000
*注意:如果数据集里有异常值,应先去除异常值,再用均值填充。
8,再试一下用插值法进行填充,默认是线性插值法,适用于列数据呈线性关系的时候:
transactions.interpolate(inplace=True)
显然这里不符合要求,因此不显示更新的数据集了。仅作演示之用。
9,显示有重复值的行:
print(transactions.duplicated())
0    False
1    False
2    False
3    False
4    False
5     True
6    False
7    False
8    False
9    False
显示索引为5的这一行有重复值。
10,去除重复值:
transactions.drop_duplicates(inplace=True)
11,这里选择用均值填充缺失值,现在需要查找异常值,先用describe()方法显示数值型数据的整体情况:
print(transactions.describe())
       Transaction_ID  Product_ID  Quantity  Unit_Price  Total_Price
count        9.000000    9.000000  9.000000    9.000000     9.000000
mean         5.444444    3.111111  2.111111   49.444444   310.138889
std          3.205897    0.927961  1.054093   31.850672   567.993712
min          1.000000    2.000000  1.000000    9.000000    30.000000
25%          3.000000    2.000000  1.000000   32.000000    36.000000
50%          5.000000    3.000000  2.000000   47.500000   124.000000
75%          8.000000    4.000000  3.000000   55.000000   282.125000
max         10.000000    4.000000  4.000000  124.000000  1800.000000
查看Quantity, Unit_Price,Total_Price的最大最小值后发现,Quantity没什么问题,Unit_Price和Total_Price的最大值有些异常,用最大的Quantity乘以Unit_Price得到的是496,远低于1800,因此确定Total_Price有异常值。而Unit_Price的最大值不能确定有没有问题,在查看数据集后,发现没什么问题,故保留。
12,用掩码查找异常值,在数据上下限范围之外的数值即为异常值(数据上限通常是Q3+1.5*IQR,数据下限通常是Q1-1.5*IQR):
IQR=transactions.describe().loc['75%','Total_Price']-transactions.describe().loc['25%','Total_Price']
upper_extreme=transactions.describe().loc['75%','Total_Price']+1.5*IQR
lower_extreme=transactions.describe().loc['25%','Total_Price']-1.5*IQR
print(transactions.loc[((transactions['Total_Price']>upper_extreme) | (transactions['Total_Price']<lower_extreme))])
   Transaction_ID Transaction_Date  Product_ID  Quantity  Unit_Price  \
8               9       2015-04-24         4.0       3.0        60.0

   Total_Price
8       1800.0
先计算出Total_Price的IQR,据此再计算出它的上下限,查找出有异常值的行。
13,用箱线图查找异常值:
import matplotlib.pyplot as plt
fig,ax=plt.subplots()

ax.boxplot(transactions['Total_Price'])
plt.shaow()
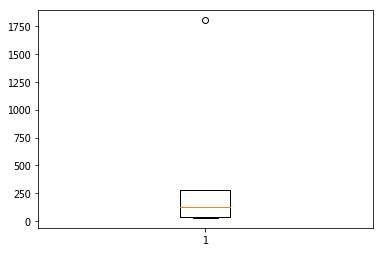
显示Total_Price这一列有异常值(圆点)。
14,处理异常值,查看数据集后发现有异常值这一行是Total_Price多加了一个0,故用180替代1800:
transactions.replace(1800,180,inplace=True)
现在数据集如下:
   Transaction_ID Transaction_Date  Product_ID  Quantity  Unit_Price  \
0               1       2010-08-21         2.0       1.0        30.0
1               2       2011-05-26         4.0       1.0        40.0
2               3       2011-06-16         3.0       2.0        32.0
3               4       2012-08-26         2.0       3.0        55.0
4               5       2013-06-06         4.0       1.0       124.0
6               7       2013-12-30         3.0       2.0        47.5
7               8       2014-04-24         2.0       2.0        47.5
8               9       2015-04-24         4.0       3.0        60.0
9              10       2016-05-08         4.0       4.0         9.0

   Total_Price
0       30.000
1       40.000
2       32.000
3      165.000
4      124.000
6      282.125
7      282.125
8      180.000
9       36.000
这个数据集的清洗工作到此为止,因为该数据集非常简单,因此只能用作演示。现实中的数据集要比这个复杂很多,其清洗内容还包括数据类型的转换,数据格式的转换,添加特征等等。