There isn’t a lot of info on debugging an annotation processor using IntelliJ IDEA available on the internet, and what’s there is scattered and sometimes incorrect.
Most of the approaches use mvnDebug, ant, gradle, or some other external tool. The one tutorial that describes how debug IJ’s javac directly, is unavailable (archive.org link here) and outdated.
Here’s how to do this in 2018. You have three options:
Option 1: Attach mode, using built-in IDEA feature
1. Create a Remote Run Configuration
Choose mode Attach and a port of your liking, e.g. 8000.
Make sure your annotation processor’s source module is selected where it says Search sources using module’s classpath
2. Make sure the build process uses your port
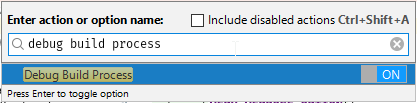
Invoke Ctrl+Shift+A > Edit Custom VM Options…
Now add `-Dcompiler.process.debug.port=8000`, save, and restart IDEA.
3. Enable “Debug build process”
You’ll need to repeat this step every time you restart IDEA.
4. Try it out
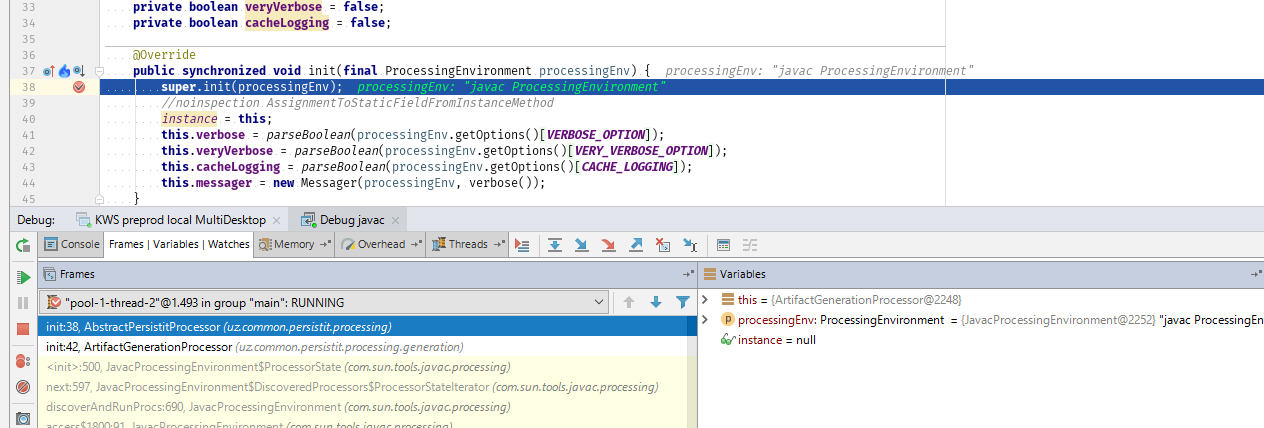
First, set a break point in your annotation processor’s code (the method overriding AbstractProcessor#init is an excellent choice).

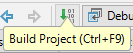
Next, compile some code that will trigger your annotation processor.
The build process will pause, allowing you to attach the debugger:

Now start the Run configuration you added. javac will resume compilation.

Et voila, IDEA should now stop at the break point you’ve set.
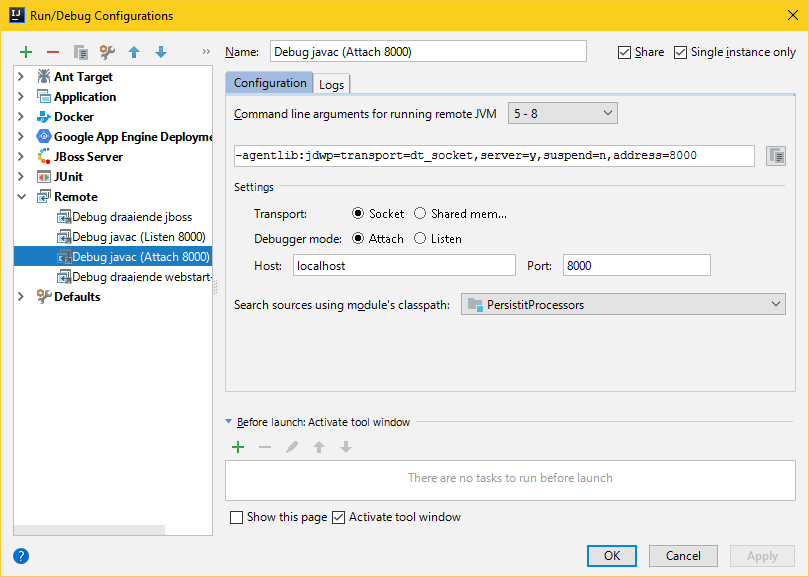
Option 2: Attach mode, using custom settings
1. Create a Remote Run Configuration
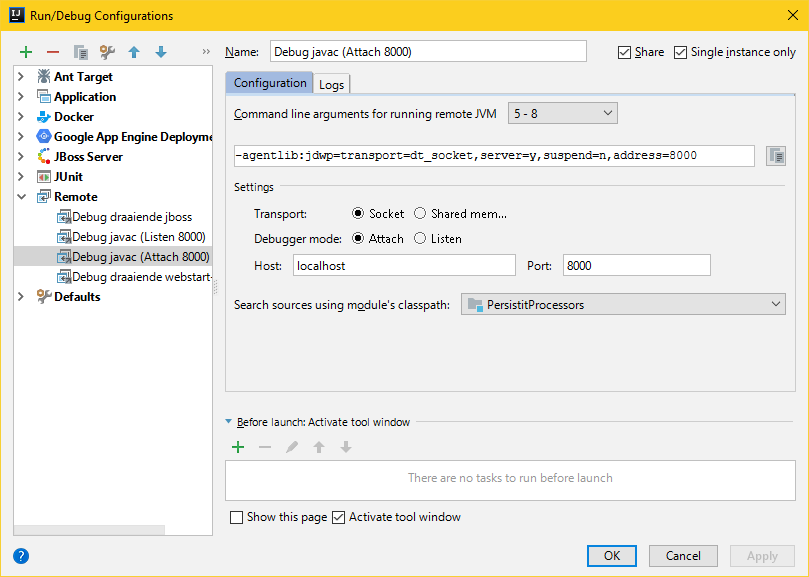
Choose mode Attach and a port of your liking, e.g. 8000.
Make sure your annotation processor’s source module is selected where it says Search sources using module’s classpath
Now copy the text IJ is showing at the top: -agentlib:…
2. Configure the Shared build process VM options
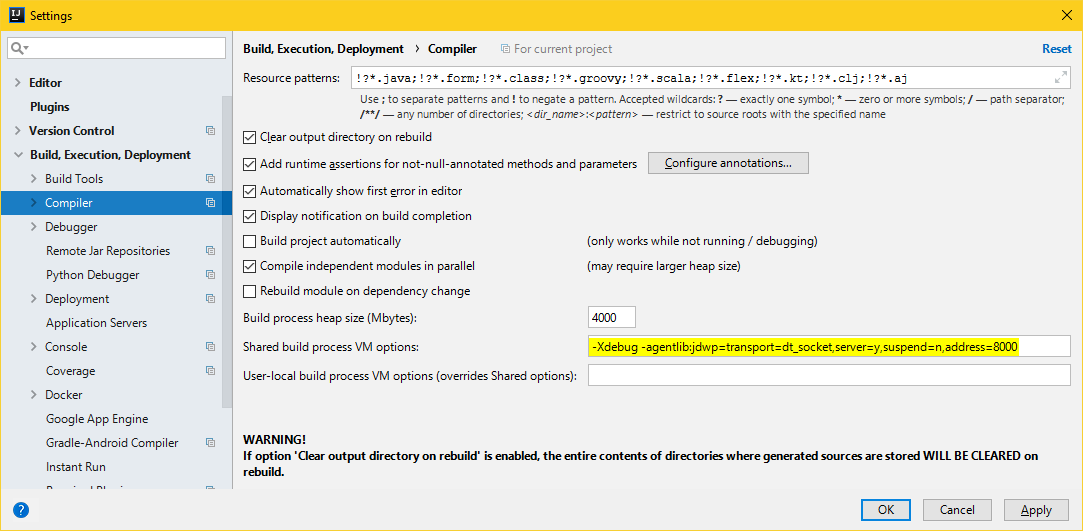
Add…
-Xdebug -agentlib:jdwp=transport=dt_socket,server=y,suspend=n,address=8000
… to the Shared build process VM options. This differs from previous ways you can find on the internet. You do not need `-Xdebug -Xrunjdwp:…` or `-Xdebug -runjdwp:…`. The one and only correct format is:
-Xdebug [the string you copied earlier]
Also, make sure to uncheck Use compiler from module target JDK when possible. If you check this, IDEA will fork a separate javac, instead of using the shared build process.
4. Try it out
First, set a break point in your annotation processor’s code (the method overriding AbstractProcessor#init is an excellent choice).
Next, compile some code that will trigger your annotation processor.
The build process will not pause, so you will need to try starting the Run configuration repeatedly, until the debugger attaches. `suspend=y` might help here, but I have not tried this yet.
Et voila, IDEA should now stop at the break point you’ve set.
Option 3: Listen mode
1. Create a Remote Run Configuration
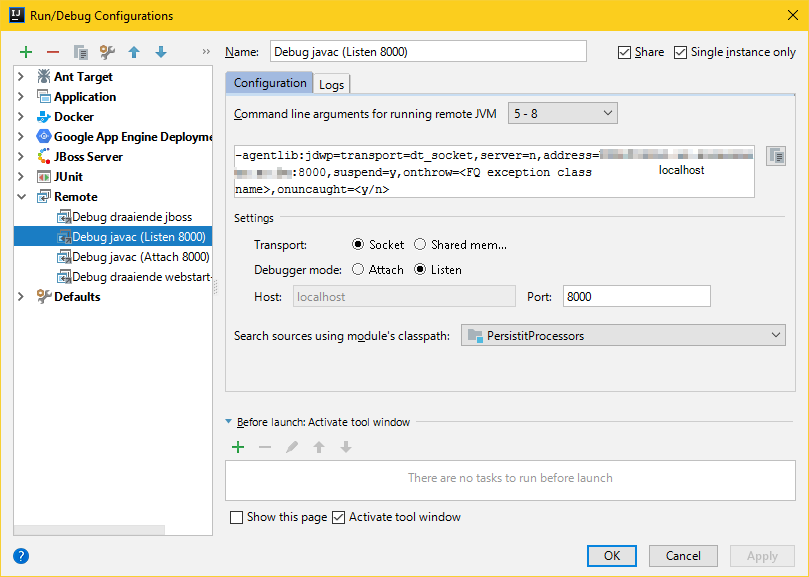
Choose mode Listen and a port of your liking, e.g. 8000.
Make sure your annotation processor’s source module is selected where it says Search sources using module’s classpath
Now copy the text IJ is showing at the top: -agentlib:…
2. Configure the javac command line parameters
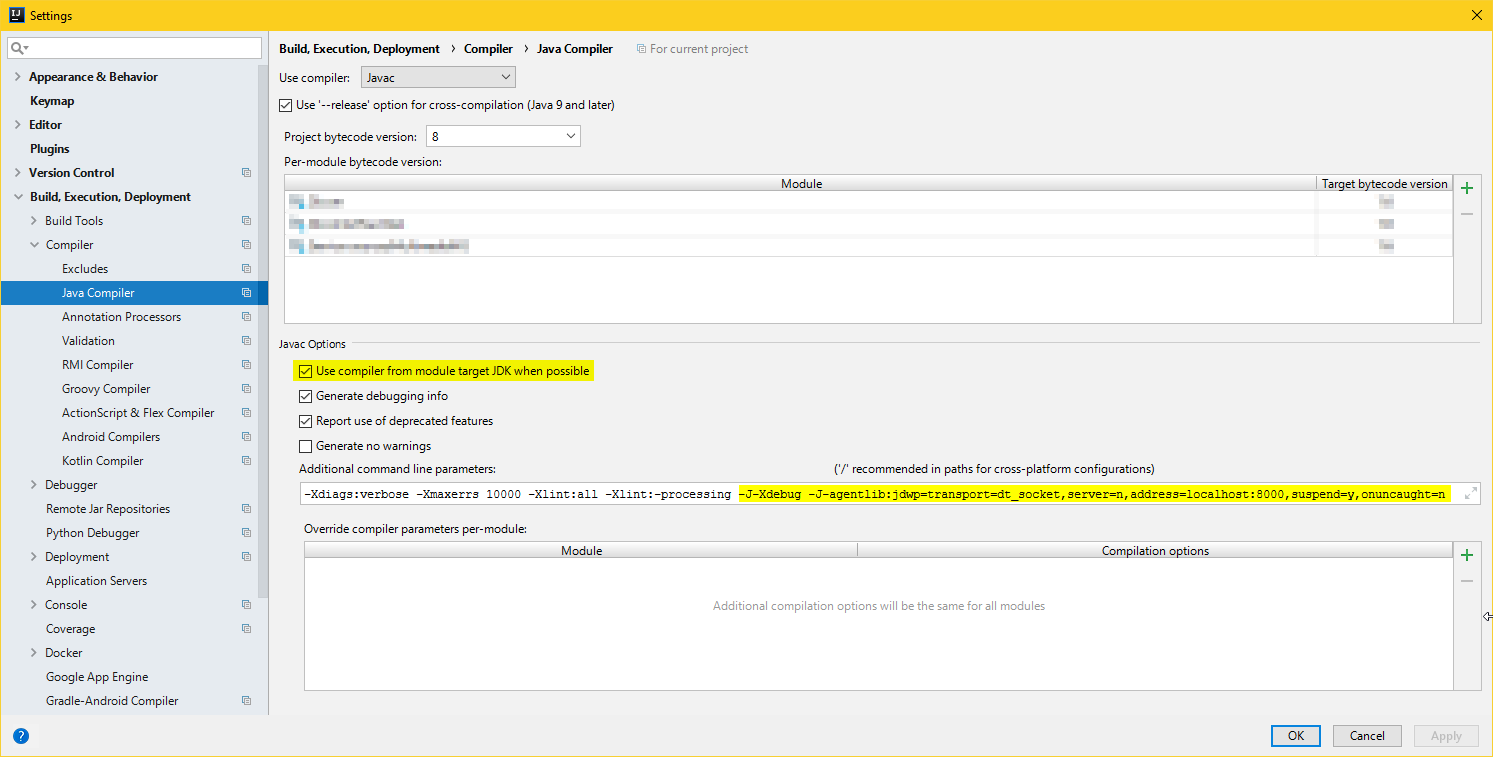
Two things are important here:
2.a. Add Additional command line parameters
Add…
-J-Xdebug -J-agentlib:jdwp=transport=dt_socket,server=n,address=localhost:8000,suspend=y,onuncaught=n
… to the Additional command line parameters.
This differs from previous ways you can find on the internet. You do not need `-J-Xdebug -J-Xrunjdwp:…` or `-J-Xdebug -J-runjdwp:…`. The one and only correct format is:
-J-Xdebug -J[the string you copied earlier]
To figure out what to use for `onthrow=` or `onuncaught=`, refer to the documentation here.
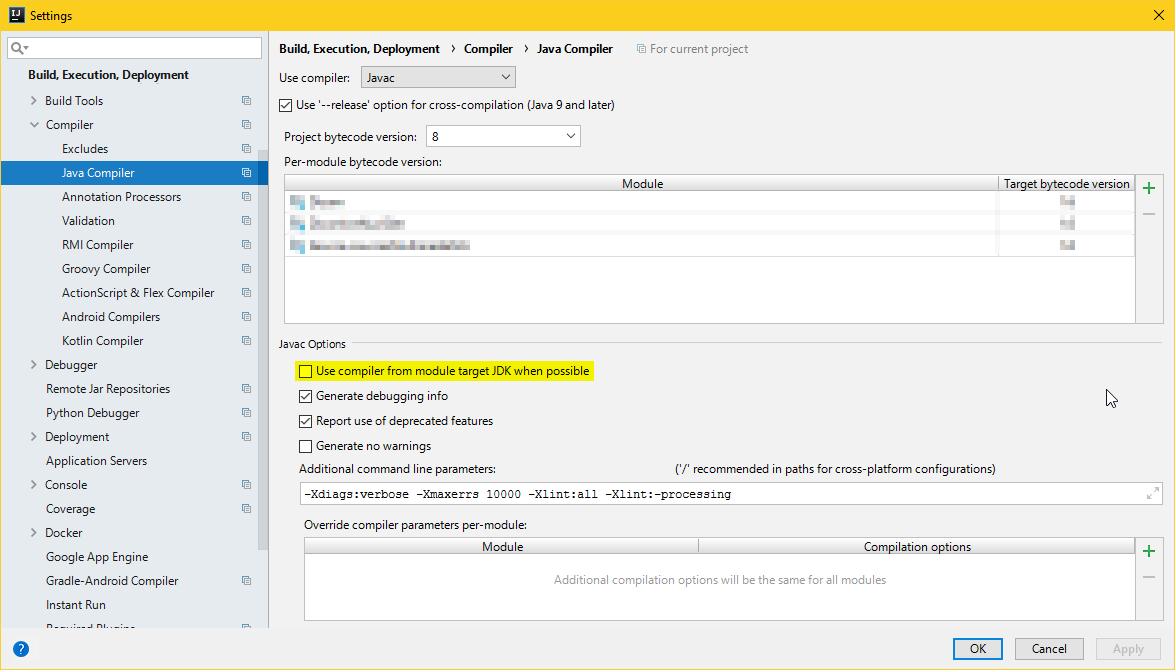
2.b. Check Use compiler from module target JDK when possible
This makes sure that IJ forks a javac process to compile (“forked” mode), instead of using the shared (“in-process” mode).
Me nerding out: in the source, we can see that `if(!shouldForkJavac)`, `vmOptions` (i.e. the Additional command line parameters starting with -J) are ignored.
3. Try it out
First, set a break point somewhere in your annotation processor’s code (your method overriding AbstractProcessor#init is an excellent choice).
Then start the Run configuration you added. IDEA will sit tight, waiting for javac to connect.

Next, compile some code that will trigger your annotation processor.
Et voila, IJ should now stop at the break point you set:
Notes
Some things to be aware of:
- You cannot have annotation processing enabled for your annotation processor source module. IJ bails when you try this. To work around this, create a second profile in Settings > Compiler > Annotation Processors with processing disabled, and only add your annotation processor source module.
Which option to choose? This depends.
- Option 1 is likely the best for most people. It allows for easily switching debugging on and off, but does not allow changing any of the connection parameters.
- Option 2 can be useful if you want to change some connection parameters, but you’ll need to manually try and attach the debugger multiple times.
- Option 3 is only really useful if you need Use compiler from module target JDK when possible to be on, for some reason.