PURPOSE.
We evaluate how deep learning can be applied to extract novel information such as refractive error from retinal fundus imaging.
我们评估了深度学习如何应用于从视网膜眼底成像中提取新的信息,如屈光不正。
METHODS.
Retinal fundus images used in this study were 45- and 30-degree field of view images from the UK Biobank and Age-Related Eye Disease Study (AREDS) clinical trials, respectively. Refractive error was measured by autorefraction in UK Biobank and subjective refraction in AREDS. We trained a deep learning algorithm to predict refractive error from a total of 226,870 images and validated it on 24,007 UK Biobank and 15,750 AREDS images. Our model used the ‘‘attention’’ method to identify features that are correlated with refractive error
本研究使用的视网膜眼底图像分别来自英国生物银行和年龄相关眼病研究(AREDS)临床试验的45度和30度视野图像。用英国生物库的自折射法和AREDS的主观折射法测量屈光不正。我们训练了一种深度学习算法来预测总共226,870幅图像的屈光误差,并在24,007幅UK Biobank和15,750幅AREDS图像上进行了验证。我们的模型使用'attention'理论来识别与屈光误差相关的特征。
RESULTS. The resulting algorithm had a mean absolute error (MAE) of 0.56 diopters (95% confidence interval [CI]: 0.55–0.56) for estimating spherical equivalent on the UK Biobank data set and 0.91 diopters (95% CI: 0.89–0.93) for the AREDS data set. The baseline expected MAE (obtained by simply predicting the mean of this population) was 1.81 diopters (95% CI:1.79–1.84) for UK Biobank and 1.63 (95% CI: 1.60–1.67) for AREDS.
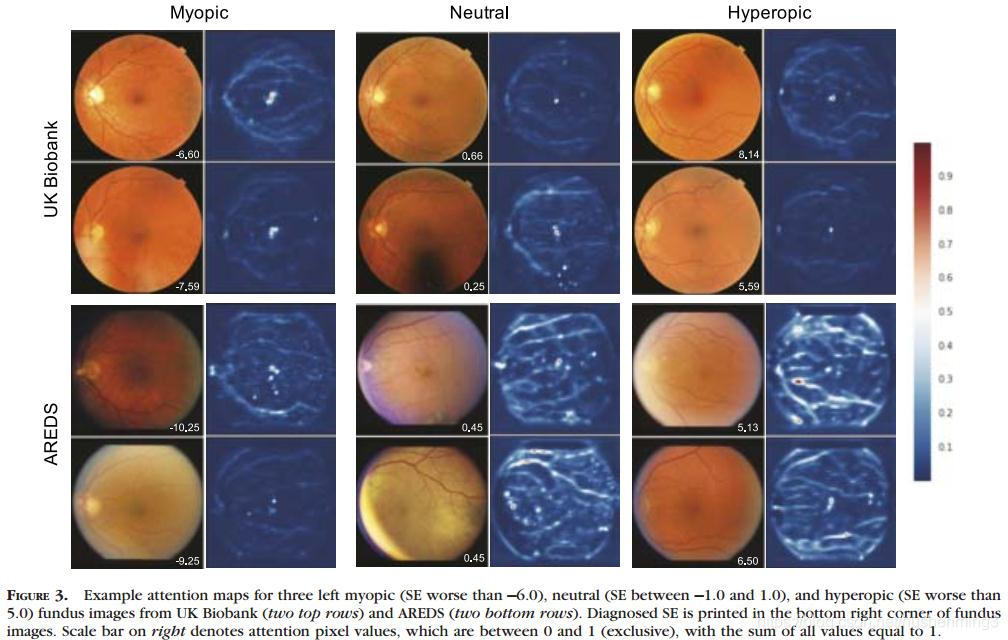
Attention maps suggested that the foveal region was one of the most important areas used by the algorithm to make this prediction, though other regions also contribute to the prediction.
Attention maps表明,虽然其他区域也对预测有贡献,但中心凹区域是算法用于预测的最重要区域之一。
CONCLUSIONS.
To our knowledge, the ability to estimate refractive error with high accuracy from retinal fundus photos has not been previously known and demonstrates that deep learning can be applied to make novel predictions from medical images
据我们所知,从眼底照片中高精度估计屈光不正的能力以前还不为人知,这表明深度学习可以应用于从医学图像中做出新的预测
Uncorrected refractive error is one of the most common causes of visual impairment worldwide.The refractive error of the eye is determined by several factors. Axial ametropia, which is ametropia related to ocular length, is considered to be the main source of spherical refractive error. An eye with an optical system too powerful for its axial length is regarded as ‘‘myopic,’’ whereas the eye that is too weak is known as ‘‘hypermetropic.’’ The crystalline lens and curvature of the cornea balance the optical system of the eye and also contribute to both spherical refractive error and astigmatic properties of the eye.
屈光不正是引起视力损害的最常见原因之一。眼睛的屈光不正是由几个因素决定的。轴向屈光不正是与眼长有关的屈光不正,是造成球屈光不正的主要原因。如果一只眼睛的光学系统的轴向长度太大,就会被认为是近视,而如果眼睛太弱,就会被认为是远视。晶状体和角膜曲率平衡了眼睛的光学系统,也导致了眼球的球形屈光不正和散光特性。
The prevalence of refractive error is increasing, particularly myopic errors in Western and Asian populations.Although
largely treatable with prescription spectacles or contact lenses,the vast majority of those affected by refractive error live in
low-income countries with minimal access to eye care and therefore may not receive even this noninvasive treatment
屈光不正的患病率正在增加,特别是在西方和亚洲人口近视问题。尽管大多数屈光不正患者可以通过配戴处方眼镜或隐形眼镜进行治疗,在低收入国家,绝大多数受屈光不正影响的患者生活,几乎得不到眼科护理,因此甚至可能无法接受这种非侵入性治疗
Novel and portable instruments, such as smartphone attachments to image the fundus or apps to measure visual
acuity,offer a low-cost method of screening and diagnosing eye disease in the developing world. They have shown promise
in the assessment of diabetic retinopathy and the optic nerve but are limited by their requirement for expert graders to
interpret the images
在发展中国家,新型和便携的仪器,如用于眼底成像的智能手机附件或用于测量视力的应用程序,提供了一种低成本的筛查和诊断眼疾的方法。他们已经在糖尿病视网膜病变和视神经的评估中显示出希望,但是他们要求专家评分来解释图像,这限制了他们的研究
Artificial intelligence (AI) has shown promising results in the diagnosis and interpretation of medical imaging. In particular a
form of AI known as deep learning allows systems to learn predictive features directly from the images from a large data
set of labeled examples without specifying rules or features explicitly.Recent applications of deep learning to medical imaging have produced systems with performance rivaling medical experts for detecting a variety of diseases, including melanoma, diabetic retinopathy, and breast cancer lymph node metastases.Deep learning can also characterize signals that medical experts cannot typically extract from images alone, such as age, gender, blood pressure, and other cardiovascular health factors. Despite the high accuracy of the algorithms produced by deep learning, the number of free parameters of the system makes it difficult to understand exactly which predictive features have been learned by the system. The ability to infer human interpretable features from a trained convolutional neural network is critical not only for building trust in the system, but it also enables more targeted hypothesis generation for understanding the underlying mechanism of disease. In fact, much of the previous work in ophthalmic research and clinical practice has relied heavily on a sophisticated process of guess and test: first generate rules or hypotheses of what features are most predictive of a desired outcome and then test these assumptions. With deep learning, one can first ask the network to predict the outcome of interest and then apply attention techniques to identify the regions of the image that is most predictive for the outcome of interest.
人工智能(AI)在医学影像的诊断和解释方面已显示出良好的应用前景。特别是一种被称为“深度学习”的人工智能形式,它允许系统直接从带有大量标记的示例的图像中学习预测特性,而无需显式地指定规则或特性。近年来,深度学习在医学成像方面的应用产生了一系列系统,其性能可与医学专家媲美,用于检测多种疾病,包括黑色素瘤、糖尿病视网膜病变和乳腺癌淋巴结转移。深度学习还可以表征医学专家通常无法单独从图像中提取的信号,比如年龄、性别、血压和其他心血管健康因素。尽管深度学习产生的算法精度较高,但是系统自由参数的数量使得系统很难准确地理解学习了哪些预测特征。从训练有素的卷积神经网络中推断人类可解释特征的能力,不仅对于建立对系统的信任至关重要,而且对于理解疾病的潜在机制,还能够生成更有针对性的假设。事实上,以往眼科研究和临床实践中的许多工作都严重依赖于一个复杂的猜测和测试过程:首先生成规则或假设,哪些特征最能预测预期的结果,然后测试这些假设。通过深度学习,我们可以首先要求网络预测结果,然后应用attention技术来识别图像中最能预测结果的区域。
In this study, a deep learning model was trained to predict the refractive error from fundus images using two different data sets.Refractive error, particularly axial ametropia, is associated with characteristic changes in the fundus, including the relative
geometry and size of features at the retina due to the curvature of the eye. This has been well studied, particularly in myopic eyes that have a longer axial length.Attention techniques were used to visualize and identify new image features associated with the ability to make predictions. This method may help us interpret the model to understand which retinal landmarks may contribute to the etiology of ametropia.
在本研究中,我们使用两个不同的数据集,训练一个深度学习模型来预测眼底图像的屈光误差。屈光不正,特别是轴向屈光不正,与眼底的特征变化有关,包括由于眼睛弯曲而引起的视网膜的相对几何形状和特征大小。这一点已经得到了很好的研究,尤其是在眼轴长度较长的近视患者中。Attention 技术被用来可视化和识别与预测能力相关的新图像特征。这种方法可以帮助我们解释模型,以了解哪些视网膜标志可能有助于失弛欠症的病因学。
METHODS
Data Sets
We used two data sets in this study: UK Biobank and Age Related Eye Disease Study (AREDS). UK Biobank is an ongoing
observational study that recruited 500,000 participants between 40 and 69 years old across the United Kingdom between
2006 and 2010. Each participant completed lifestyle questionnaires, underwent a series of health measurements, provided
biological samples,18 and were followed up for health outcomes. Approximately 70,000 participants underwent ophthalmologic examination, which included an assessment of refractive error using an autorefraction device (RC5000;Tomey Corp., Nagoya, Japan) as well as paired nonmydriatric optical coherence tomography (OCT) and 45-degree retinal fundus imaging using a three-dimensional OCT device (OCT-1000 Mark 2; Topcon Corp., Tokyo, Japan). Participants who had undergone any eye surgery, including bilateral cataract surgery, were excluded from participating in the ophthalmologic exams because this meant their primary refractive error status could not be determined
The AREDS was a clinical trial in the United States that investigated the natural history and risk factors of age-related macular degeneration and cataracts. The trial enrolled participants between 1992 and 1998 and continued clinical follow up until 2001 at 11 retinal specialty clinics. The study was approved by an independent data and safety monitoring committee and by the institutional review board for each clinical center. A total of 4757 participants aged 55 to 80 years at enrollment were followed for a median of 6.5 years.As a part of an ophthalmologic exam, the participants underwent subjective refraction as well as color fundus photography at baseline and at subsequent visits. Briefly, the protocol for refraction involved retinoscopy and then further refinement with subjective refraction. Thirty-degree–field color fundus photographs were acquired with a fundus camera (Zeiss FF series; Carl Zeiss, Oberkochen, Germany) using a reading center–approved transparency film.For each visit in which refraction was performed, the corresponding macula-centered photos were used in this study
A summary metric for refractive error, known as the spherical equivalent (SE), can be calculated using the formula spherical power þ 0.5*cylindrical power. SE was available for both the UK Biobank and AREDS data set, but spherical power
and cylindrical power were only available in the UK Biobank data set.
屈光不正的汇总指标,称为球面等效(SE),可以使用公式计算球面þ0.5 *柱镜。SE对于英国Biobank数据集和AREDS数据集均可用,但球形和柱镜仅在英国Biobank数据集可用。
Each data set was split into a development set and a clinical validation set, which was not accessed during model development (Table 1). The division of development and clinical validation sets was done by subject.
Development of the Algorithm
A deep neural network model is a sequence of mathematical operations, often with millions of parameters (weights),
applied to input, such as pixel values in an image. Deep learning is the process of learning the right parameter values
(‘‘training’’) such that this function performs a given task, such as generating a prediction from the pixel values in a retinal
fundus photograph. TensorFlow,an open-source software library for deep learning, was used in the training and evaluation of the models
深度神经网络模型是一系列数学运算,通常有数百万个参数(权重)应用于输入,比如图像中的像素值。深度学习是学习正确的参数值(训练)的过程,使该函数执行给定的任务,例如从视网膜眼底照片中的像素值生成预测。TensorFlow是一个用于深度学习的开源软件库,用于模型的培训和评估
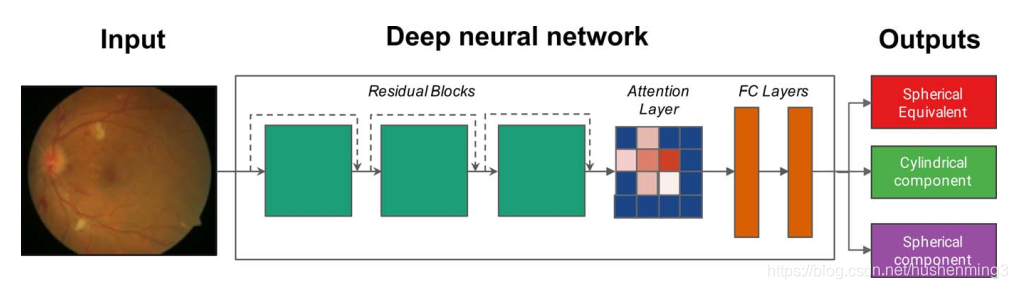
The development data set was divided into two parts: a ‘‘train’’ set and a ‘‘tune’’ set. The tune set is also commonly called the ‘‘validation’’ set, but to avoid confusion with a clinical validation set (which consists of data on which the model did not train), we called it the tune set. The train, tune,and clinical validation data sets were divided by subject.During the training process, the parameters of the neural network were initially set to random values. Then for each image, the prediction given by the model was compared to the known label from the training set and parameters of the model were then modified slightly to decrease the error on that image. This process, known as stochastic gradient descent, was repeated for every image in the training set until the model ‘‘learned’’ how to accurately compute the label from the pixel intensities of the image for all images in the training set. The tuning data set was a random subset of the development data set that was not used to train the model parameters, but rather was used as a small evaluation data set for tuning the model.This tuning set comprised 10% of the UK Biobank data set and 11% of the AREDS data set. With appropriate tuning and sufficient data, the resulting model was able to predict the labels (e.g., refractive error) on new images. In this study, we designed a deep neural network that combines a ResNet16 and a soft-attention architecture (Fig. 1). Briefly, the network consists of layers to reduce the size of the input image, three residual blocks16 to learn predictive image features, a soft attention layer to select the most informative features, and
two fully connected layers to learn interactions between the selected features
开发数据集分成两部分:一组训练数据集和一组优化数据集。优化组也通常称为验证集,但是为了避免混淆与临床验证(其中的数据没有经过训练),我们称之为调整设置。训练,优化和临床验证数据集是主观划分的。在训练过程中,神经网络的参数初始设置为随机值。然后对每幅图像,将模型给出的预测结果与训练集中的已知标签进行比较,并对模型参数进行微调,以减小对图像的误差。这一过程,称为随机梯度下降法,重复了每一个图像在模型训练集,直到学会了如何准确地计算标签图像的像素强度的训练集的所有图像。调优数据集随机开发数据集的子集,并不是用来训练模型参数,而是被用作小评价数据集优化模型。该优化集占英国Biobank数据集的10%,AREDS数据集的11%。通过适当的优化和充足的数据,得到的模型能够预测新图像上的标签(如屈光误差)。在这项研究中,我们设计了一个深层神经网络结合ResNet16和soft-attention架构(图1)。简单地说,网络包含一层用于减少输入图像的大小,三个残差blocks16学习预测图像特性,soft attention层选择最有益的特性,两个全连接层学习交互特性。
Prior to training, we applied an image-quality filter algorithm to exclude images of poor quality, which excluded approximate 12% ofthe UK Biobank data set. Because the vast majority of the AREDS images were of good quality, we did not exclude any of the AREDS images. The image-quality algorithm was a convolutional neural net trained on 300 manually labeled images to predict image quality in addition to other labels to increase model stability. The model was tuned to exclude images that were of very poor quality (e.g., completely over- or underexposed). Examples of excluded images are in Supplementary Figure S1. Aggregate analyses of the excluded images are in Supplementary Table S1.We preprocessed the images for training and validation and trained the neural network following the same procedure as in Gulshan et al.11 We trained separate models to predict spherical power, cylindrical power, and SE (Fig. 1)
在训练前,我们使用图像质量滤波算法剔除了质量较差的图像,约12%的英国Biobank数据集被排除在外。由于绝大多数的AREDS图像质量较好,所以我们没有排除任何一幅AREDS图像。图像质量算法是一种训练了300幅人工标注图像的卷积神经网络,在对图像质量进行预测的同时,增加模型的稳定性。该模型被调整以排除质量非常差的图像(例如,完全过度或曝光不足)。排除图像的例子见补充图S1。排除图像的汇总分析见补充表S1。我们对图像进行预处理,进行训练和验证,并按照Gulshan et al.11等人的步骤训练神经网络(图1)。
We used an early stopping criteria based on performance on the tuning data set to help avoid overfitting and to terminate training when the model performance, such as mean absolute error (MAE), on a tuning data set stopped improving. To further improve results, we averaged the results of 10 neural network models that were trained on the same data (ensembling).
我们使用了一个基于调优数据集性能的早期停止标准,以帮助避免过度拟合,并在调优数据集上的模型性能(如平均绝对误差(MAE))停止改进时终止训练。为了进一步改进结果,我们对10个神经网络模型在相同数据(集成)上的训练结果进行平均。
Network Architecture
Our network consists of a residual network (ResNet) to learn predictive image features, a soft-attention layer to select and understand the most important image features, and fully connected layers to learn interactions between the selected features.
我们的网络由学习预测图像特征的残差网络(ResNet)、选择和理解最重要图像特征的soft-attention层和学习所选特征之间相互作用的全连通层组成。
Specifically, the residual network consists of one convolutional layer, followed by three residual blocks with four, five,and two residual units, respectively. Each residual unit has a bottleneck architecture composed of three convolutional layers. Such a residual architecture enables deeper networks (in our case 34 layers), thereby learning more abstract features and having higher prediction accuracy.16 Of importance, skipconnections enable the network to bypass certain residual units and reuse features from different abstraction levels and resolutions, which enables the following attention layer to access more precisely localized predictive image features. The output of the residual network is a convolutional feature map A, with Ai,j being the learned features for each spatial location (i, j).
具体来说,残差网络由一个卷积层组成,然后是三个残差块,分别为4、5和2个残差单元。每个剩余单元都有一个由三个卷积层组成的瓶颈结构。这样的残差架构支持更深层次的网络(在我们的例子中是34层),从而学习更抽象的特性,并具有更高的预测精度。重要的是,skipconnections使网络能够绕过某些剩余单元,重用来自不同抽象级别和分辨率的特性,从而使下面的注意层能够访问更精确的局部预测图像特性。剩余网络的输出是卷积feature map a, Ai,j是每个空间位置(i, j)的学习特征。
The following soft-attention layer predicts for each location (i, j) scalar weights wi,j, which indicate the importance of certain image regions and thereby enable understanding which image features, for example, the fovea in retina images, are most predictive. We generated individual attention maps by visualizing the predicted feature weights wi,j as a heat map. We also generated aggregated attention maps by averaging predicted attention weights over multiple images. The output of the soft-attention layer is a single feature vector obtained by averaging Ai,j weighted by wi,j The soft-attention layer is followed by two fully connected layers and an output layer,which predicts the SE, as well as the spherical and cylindrical component (Fig. 1).
下面的soft-attention层对每个位置(i, j)的标量权值wi,j进行预测,wi,j表示特定图像区域的重要性,从而能够理解哪些图像特征,例如视网膜图像中的中央凹,是最具预测性的。我们通过将预测的特征权重wi,j可视化为热图,生成了个体attention maps。我们还通过对多个图像的平均预测注意力权重来生成聚合的attention maps。soft-attention层的输出为单个特征向量,由Ai、j加权后的wi、j平均得到,soft-attention层之后是两个完全连通的层和一个输出层,预测SE,以及球和柱分量(图1)。
Evaluating the Algorithm
We optimized for minimizing the MAE to evaluate model performance for predicting refractive error. We also calculated the R2 value, but this was not used to select the operating points for model performance. In addition, to further characterize the performance of the algorithms, we examined how frequently the algorithms’ predictions fell within a given error margin (see Statistical Analysis section).
为了评估模型预测屈光误差的性能,我们优化了最小模量。我们还计算了R2值,但这并不是用来选择模型性能的作用点。
此外,为了进一步描述算法的性能,我们研究了算法预测落在给定误差范围内的频率(参见统计分析部分)。
Statistical Analysis
To assess the statistical significance of these results, we used the nonparametric bootstrap procedure: from the validation set of N instances, we sampled N instances with replacement and evaluated the model on this sample. By repeating this sampling and evaluation 2000 times, we obtained a distribution of the performance metric (e.g., MAE) and reported the 2.5 and 97.5 percentiles as 95% confidence intervals (CIs). We compared the algorithms’ MAE to baseline accuracy, which was generated by calculating the MAE of the actual refractive error and the average refractive error.
为了评估这些结果的统计意义,我们使用了非参数自举过程:从N个实例的验证集中,抽取N个实例进行替换,并在此样本上对模型进行评估。通过重复这个抽样和评估2000次,我们得到了性能指标(例如MAE)的分布,并将2.5和97.5个百分位数报告为95%置信区间(CIs)。通过计算实际折光误差和平均折光误差的平均折光误差,将该算法与基线精度进行了比较。
To further assess statistical significance, we performed hypothesis testing using a 1-tailed binomial test for the frequency of the model’s prediction lying within several error margins for each prediction. The baseline accuracy (corresponding to the null hypothesis) was obtained by sliding a window of size equal to the error bounds (e.g., size 1 for 60.5) across the population histogram and taking the maximum of the summed histogram counts. This provided the maximum possible random accuracy (by guessing the center of thesliding window containing the maximum probability mass)
为了进一步评估统计显著性,我们使用1-tailed二项检验对模型s预测的频率进行假设检验,该频率位于每个预测的几个误差范围内。基线精度(对应于零假设)是通过在总体直方图上滑动一个大小等于误差界限的窗口(例如,大小为60.5的窗口为1),并取直方图总数的最大值来获得的。这提供了最大可能的随机精度(通过猜测包含最大概率质量的窗口中心)
Attention Maps
To visualize the most predictive eye features, we integrated a soft-attention layer into our network architecture. The layer takes as input image features learned by the preceding layers,predicts for each feature a weight that indicates its importance for making a prediction, and outputs the weighted average of image features. We generated individual attention maps of images by visualizing the predicted feature weights as a heat map. We also generated aggregated attention maps by averaging predicted attention weights over multiple images
为了可视化最具预测性的眼部特征,我们在网络架构中集成了一个soft-attention层。该层将前一层学习到的图像特征作为输入,对每个特征预测一个权值,表示其对预测的重要性,输出图像特征的加权平均。通过将预测的特征权重可视化为热图,我们生成了图像的个体注意图。我们还通过对多个图像的平均预测注意力权重来生成聚合的attention maps
RESULTS
The baseline characteristics of the UK Biobank and AREDS cohorts are summarized in Table 1. Participants in the UK Biobank data set were imaged once. Subjects in the AREDS data set were imaged multiple times during the course of the trial.The subjects in the AREDS study were on average older than those in UK Biobank (mean age: 73.8 years in AREDS versus 56.8 years in UK Biobank). Hypermetropia was more common in the AREDS data set. The distribution of sex and ethnicity were similar in the two groups.
表1总结了英国Biobank和AREDS的基线特征。英国生物银行数据集的参与者只接受了一次成像。AREDS数据集中的受试者在试验过程中多次成像。AREDS研究对象的平均年龄高于英国生物银行(平均年龄:73.8岁,而英国生物银行为56.8岁)。在AREDS数据集中,远视更为常见。两组患者的性别和种族分布相似。
Table 2 summarizes the performance of the model on the clinical validation sets from UK Biobank and AREDS. The model was trained jointly on both the UK Biobank and AREDS data sets to predict the SE of the refractive error. Both UK Biobank and AREDS data sets reported SE, but the individual spherical and cylindrical components were available only in the UK Biobank data set. The MAE of the model on UK Biobank clinical validation data was 0.56 diopter (D) (95% CI: 0.55–0.56) and 0.91 D (95% CI: 0.89–0.93) on the AREDS clinical validation data set (see Table 2). The distribution of the predicted versus actual values for both data sets are visualized in Figure 2. The model’s predicted values were within 1 D of the actual values 86% of the time for the UK Biobank clinical validation set versus 50% for baseline accuracy. For AREDS, the model’s prediction was within 1 D 65% of the time versus 45% for baseline. The difference between the model and baseline were significant at all margins of error (Supplementary TableS1).
总结了该模型在英国生物银行和AREDS的临床验证集上的性能。该模型在英国生物库和AREDS数据集上联合训练,以预测屈光误差的SE。英国生物库和AREDS”数据集报道,但独立的球形和柱镜组件只能在英国生物库数据集。模型的美英国生物库临床验证数据是0.56屈光度(D)(95%置信区间:0.55—0.56)和0.91 D(95%置信区间:0.89—0.93)AREDS临床验证数据集(见表2)。预测的结果与实际值的分布数据集都是显示在图2。在英国生物银行临床验证集中,模型s预测值有86%的时间在实际值的1天内,而基线准确度只有50%。对于AREDS,模型s的预测有65%的时间在1 D内,而基线为45%。模型与基线之间的差异在所有误差范围内都是显著的。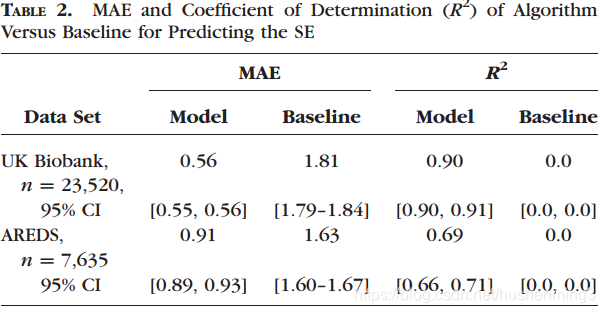
We further trained separate models to predict the components of SE, spherical power, and cylindrical power, using the UK Biobank data set because these values were not available in the AREDS data set. The model trained to predict the spherical component from retinal fundus images was quite accurate, with an MAE of 0.63 D (95% CI: 0.63, 0.64), and R2 of 0.88(95% CI: 0.88, 0.89). In comparison, the model trained to predict cylindrical power was not very accurate, with an MAE of 0.43 (95% CI: 0.42, 0.43) and R2 of 0.05 (95% CI: 0.04, 0.05)(see Supplementary Table S2)
我们进一步训练独立模型预测的组件球镜度和柱镜度,使用英国生物库的数据集,因为这些值没有可用的AREDS训练数据集。该模型预测球镜度从视网膜眼底图像相当准确,MAE 0.63 D(95%置信区间CI: 0.63, 0.64),和R2为0.88 (95% CI: 0.88, 0.89)。
相比之下,用于预测柱镜度的模型并不十分准确,MAE为0.43 (95% CI: 0.42, 0.43), R2为0.05 (95% CI: 0.04, 0.05)(补充表S2)。
Attention maps were generated to visualize the regions on the fundus that were most important for the refractive error prediction. Representative examples of attention maps at different categories of severities of refractive error (myopia,hyperopia) are shown in Figure 3. For every image, the macula was a prominent feature that was highlighted. In addition,diffuse signals such as retinal vessels and cracks in retinal pigment were also highlighted. There was not an obvious difference in the heat maps for different severities of refractive error. We averaged and merged the attention maps for 1000 images at different severities of refractive error and found that these observations also generalized across many images (Supplementary Figs. S2 and S3). To ensure that the attention heat maps involved the fovea and not simply the center of the image, we also automatically aligned the images on the fovea and attained the same result (Supplementary Fig. S4). Given the importance of the fovea in the model predictions, we also
investigated the effect that eye disease may have on the accuracy of predictions. The UK Biobank data set contained mostly healthy eyes and so could not be used for this analysis.Using the AREDS data set, we subdivided the subject population based upon whether or not the subject had cataract surgery and/or AMD. We found a small but significant improvement in the accuracy of the model when we excluded subjects who had cataract surgery and/or AMD from theanalysis (Supplementary Table S3)
生成Attention maps以可视化眼底对屈光误差预测最重要的区域。图3显示了不同类型屈光不正严重程度(近视、远视)的Attention maps的代表性例子。对于每一张图像,黄斑都是一个突出的特征。此外,弥漫性信号,如视网膜血管和视网膜色素的裂缝也被强调。不同屈光误差严重程度的热图无明显差异。我们平均并合并了1000幅不同屈光误差严重程度的图像的Attention maps,发现这些观察结果也适用于许多图像(补充图)。S2和S3)。为了确保Attention maps涉及到中央凹而不仅仅是图像的中心,我们还自动对齐了中央凹上的图像,得到了相同的结果(补充图S4)。鉴于中央凹在模型预测中的重要性,我们还研究了眼病可能对预测准确性的影响。英国生物银行的数据集主要包含健康的眼睛,因此不能用于这项分析。使用AREDS数据集,我们根据受试者是否接受白内障手术和/或AMD对受试者进行细分。当我们将白内障手术和/或AMD患者排除在分析之外时,我们发现模型的准确性有了微小但显著的提高(补充表S3)。
DISCUSSION
In this study, we have shown that deep learning models can be trained to predict refractive error from retinal fundus images with high accuracy, a surprising result given that this was not a prediction task thought to be possible from retinal fundus images. Both individual and mean attention maps, which highlight features predictive for refractive error, show a clear focus of attention to the fovea for all refractive errors. While attention maps show anatomical correlates for the prediction of interest, they do not establish causation. This is a general limitation of existing attention techniques. In addition, we averaged a large set of attention maps to examine them in aggregate. Because it is possible that predictive anatomical features might vary in their location in the images, it is possible these activations averaged out in the mean attention map.However, these maps may be a way to generate hypotheses in anonbiased manner to further research into the pathophysiology of refractive error.
在本研究中,我们已经证明深度学习模型可以训练来预测视网膜眼底图像的屈光不正,具有很高的准确性,这是一个令人惊讶的结果,因为这不是一个被认为是可能的视网膜眼底图像预测任务。个体和平均attention maps都突出了预测屈光不正的特征,显示了所有屈光不正对中心凹的清晰注意焦点。虽然attention maps显示了预测兴趣的解剖学相关性,但它们没有建立因果关系。这是现有attention maps技巧的一般限制。此外,我们平均了一组很大的attention maps,以便对它们进行总体检查。由于预测解剖特征在图像中的位置可能不同,这些活动可能在平均attention maps中平均出来。然而,这些图谱可能是一种产生无偏假设的方法,以进一步研究屈光不正的病理生理学。
For example, the consistent focus on the fovea shown in the attention maps may be an avenue for further myopia research.Given that fundus images are generally centered on the fovea,perhaps this result is associated with the spatial relationship between the fovea and the other retinal landmarks. However, it is also possible that the appearance of the fovea itself holds information about refractive error. In pathological myopia, the fundus may display characteristic clinical signs that involve the macula. However, to the best of our knowledge, other than in pathological myopia, there is no prior literature exploring the relationship between the foveal architecture imaged using a fundus camera and refractive error or axial length. Previous work with higher resolution using OCT has shown some evidence for anatomical difference in the retinal thickness or contour at the fovea with varying refractive error. Although
there is some evidence for greater spacing of foveal cone photoreceptors in myopic eyes, this is unlikely to be resolved in retinal fundus images. One hypothesis may be that there is a variation in the reflectance or focus of the fovea with varying refractive error when imaged using a fundus camera. When visualized using an ophthalmoscope, the foveal light reflex becomes dimmer and less conspicuous with increasing age or presence of macular disease. However, the ‘‘brightness’’ of this reflex and its relationship with refractive error has not been studied. Another hypothesis may be that there is a relationship between color or macular pigment at the fovea and refractive error; however Czepita et al. found no association. The density of pigment is usually derived using psychophysical techniques, but fundus photographs captured using blue and green illumination have shown promise in evaluating density.
例如,在attention maps中对中央凹的持续关注可能是进一步研究近视的一个途径。考虑到眼底图像一般以中央凹为中心,这一结果可能与中央凹与其他视网膜地标之间的空间关系有关。然而,也有可能中央凹的出现本身就含有折射误差的信息。病理性近视的眼底可表现出特征性的临床征象,包括黄斑。然而,就我们所知,除了病理性近视,还没有其他文献探讨使用眼底照相机拍摄的凹部结构与屈光不正或轴向长度之间的关系。以往的OCT分辨率较高的工作已经显示出视网膜厚度或中央凹轮廓的解剖学差异的一些证据,具有不同的屈光误差。虽然有证据表明近视眼中央凹锥体光感受器间距更大,但这在视网膜眼底图像中不太可能得到解决。一种假设可能是,当使用眼底照相机成像时,中央凹的反射率或焦点会随着折射误差的变化而变化。当用检眼镜观察时,随着年龄的增长或黄斑病变的出现,中央凹的光反射变得更暗,不那么明显。然而,这种反射的亮度及其与屈光不正的关系尚未得到研究。另一种假说可能是中央凹的颜色或黄斑色素与屈光不正有关;然而,Czepita等人没有发现任何关联。色素的密度通常是通过心理物理技术得到的,但使用蓝色和绿色光照拍摄的眼底照片在评估密度方面显示出了希望。
Additional future work should include data sets from even more diverse populations, such as different ethnicities, ages,and comorbidities. The model was trained and validated on a combination of two data sets. It would be more desirable to have a third data set that was taken in a completely different setting for additional validation. In addition, the UK Biobank data set excluded patients who had prior eye surgery. Additional work could include adding these patients back in to the data to see its effects on model performance
未来更多的工作应该包括来自更加多样化的人群的数据集,例如不同的种族、年龄和共病。该模型在两个数据集的组合上进行了训练和验证。更可取的做法是在完全不同的设置中使用第三个数据集进行额外验证。此外,英国生物银行的数据集排除了之前做过眼科手术的患者。额外的工作可能包括将这些患者重新添加到数据中,以查看其对模型性能的影响
Portable fundus cameras such as PEEK are becoming less expensive and more common for screening and diagnosis of
eye disease, particularly in the developing world. With further validation, it may be possible to use these increasingly abundant fundus images to efficiently screen for individuals with uncorrected refractive error who would benefit from a formal refraction assessment. However, currently, autorefraction is no more difficult to perform than fundus photography, so the findings of this study are unlikely to change the role of autorefraction in most clinical settings.
像PEEK这样的便携式眼底照相机越来越便宜,在眼科疾病的筛查和诊断中也越来越普遍,尤其是在发展中国家。随着进一步的验证,有可能使用这些日益丰富的眼底图像来有效地筛选那些将受益于正式屈光评估的屈光不正的个体。然而,目前自体屈光并不比眼底摄影困难,因此本研究的结果不太可能改变自体屈光在大多数临床环境中的作用。
Nevertheless, the methods and results of this article represent new approaches to biological and ophthalmologic research. The development of highly accurate automated classification algorithms can aid in research that involves large-scale retrospective data sets. For example, this algorithm could help in epidemiologic research of myopia from large fundus image data sets that do not have refractive error labels.The attention map results produced by this study may aid in deeper understanding of the biology and pathophysiology of myopia. Lastly, the process used in this study—leveraging deep learning to first directly predict the outcome or phenotype of interest and then attention techniques to localize the most predictive features—could be a method that can be applied to catalyze scientific research broadly in medicine and biology.
然而,本文的方法和结果为生物和眼科研究提供了新的途径。高精度自动分类算法的开发可以帮助涉及大规模回溯数据集的研究。例如,该算法可以帮助从没有屈光误差标签的大眼底图像数据集进行近视流行病学研究。本研究得到的attention map结果有助于加深对近视生物学和病理生理学的认识。最后,本研究利用深度学习的过程,首先直接预测结果或兴趣的表现型,然后使用注意力技术来定位最具预测性的特征,这可能是一种方法,可以广泛应用于催化医学和生物学的科学研究。