
开始时主机状态
APL知识链接:
https://www.zabbix.com/documentation/4.0/zh/manual/api/reference/host/create
建立脚本:
![]()
一:寻找zabbix-server主机的物理号,后面编写脚本是需要用到
[root@server1 ~]# vim zabbix-api

curl -s -XPOST -H "Content-Type: application/json-rpc" -d '
{
    "jsonrpc": "2.0",
    "method": "user.login",
    "params": {
        "user": "Admin",
        "password": "zabbix"
    },
    "id": 1,
    "auth": null
}' http://172.25.36.1/zabbix/api_jsonrpc.php | python -m json.tool
查询结果:
[root@server1 ~]# ./zabbix-api
{
    "id": 1,
    "jsonrpc": "2.0",
    "result": "893000ebca1ec1ba00995f4e14072149"
}
二:索引主机:
curl -s -XPOST -H "Content-Type:application/json-rpc" -d '
{
    "jsonrpc": "2.0",
    "method": "host.get",
    "params": {
        "output": [
            "hostid",
            "host"
        ],
        "selectInterfaces": [
            "interfaceid",
            "ip"
        ]
    },
    "id": 2,
    "auth": "893000ebca1ec1ba00995f4e14072149"
}' http://172.25.36.1/zabbix/api_jsonrpc.php | python -m json.tool

查询结果:
[root@server1 ~]# ./zabbix-api
{
    "id": 2,
    "jsonrpc": "2.0",
    "result": [
        {
            "host": "Zabbix server",
            "hostid": "10084",
            "interfaces": [
                {
                    "interfaceid": "1",
                    "ip": "127.0.0.1"
                }
            ]
        },
        {
            "host": "server2",
            "hostid": "10264",
            "interfaces": [
                {
                    "interfaceid": "3",
                    "ip": "172.25.36.2"
                }
            ]
        },
        {
            "host": "server3",
            "hostid": "10265",
            "interfaces": [
                {
                    "interfaceid": "4",
                    "ip": "172.25.36.3"
                }
            ]
        }
    ]
}
三:删除主机:
curl -s -XPOST -H "Content-Type:application/json-rpc" -d '
{
    "jsonrpc": "2.0",
    "method": "host.delete",
    "params": [
        "10266"
    ],
    "id": 2,
    "auth": "893000ebca1ec1ba00995f4e14072149"
}' http://172.25.36.1/zabbix/api_jsonrpc.php | python -m json.tool
执行结果:
[root@server1 ~]# ./zabbix-api
{
    "id": 2,
    "jsonrpc": "2.0",
    "result": {
        "hostids": [
            "10266"
        ]
    }
}
浏览器上查看,server3没有了
四:创建主机:
记住要把之前作的自动创建,自动注册关闭。否则在你没有创建之前,就自己创建主机了
curl -s -XPOST -H "Content-Type:application/json-rpc" -d '
{
    "jsonrpc": "2.0",
    "method": "host.create",
    "params": {
        "host": "server3",
        "interfaces": [
            {
                "type": 1,
                "main": 1,
                "useip": 1,
                "ip": "172.25.36.3",
                "dns": "",
                "port": "10050"
            }
        ],
	 "groups": [
            {
                "groupid": "2"
            }
        ],
        "templates": [
	    {
                "templateid": "10001"
            }
        ]

    },
    "id": 2,
    "auth": "893000ebca1ec1ba00995f4e14072149"
}' http://172.25.36.1/zabbix/api_jsonrpc.php | python -m json.tool
执行结果:
[root@server1 ~]# ./zabbix-api
{
    "id": 2,
    "jsonrpc": "2.0",
    "result": {
        "hostids": [
            "10266"
        ]
    }
}
此时查看server3主机已经被添加上去
zxbbixj监控httpd服务:
zabbix自带httpd监控模板


此时发现监控着server2上的httpd服务

zabbix监控nginx服务:
因为zabbix不带监控nginx服务的模板,需要自己创建模板
1:server3安装nginx,关闭日志,编译安装
[root@server3 ~]# tar zxf nginx-1.15.8.tar.gz
[root@server3 ~]# yum install -y gcc make pcre-devel zlib-devel

[root@server3 ~]# cd nginx-1.15.8
[root@server3 nginx-1.15.8]# vim auto/cc/gcc   ##关闭debug日志

# debug
#CFLAGS="$CFLAGS -g"

[root@server3 nginx-1.15.8]# ./configure --prefix=/usr/local/nginx --with-http_stub_status_module

[root@server3 ~]# make && make install
2:编辑nginx配置文件,并重新启动
[root@server3 nginx-1.15.8]# vim /usr/local/nginx/conf/nginx.conf


        location /status {
                stub_status on;   ##编译时添加的模板
                access_log off;   ##关闭日志
                allow 127.0.0.1;  ##访问权限访,只允许本机访问
                deny all;
        }
[root@server3 nginx-1.15.8]# /usr/local/nginx/sbin/nginx -t
nginx: the configuration file /usr/local/nginx/conf/nginx.conf syntax is ok
nginx: configuration file /usr/local/nginx/conf/nginx.conf test is successful
[root@server3 nginx-1.15.8]# /usr/local/nginx/sbin/nginx    ##启动nginx服务
3、测试,访问本机
[root@server3 nginx-1.15.8]# curl http://127.0.0.1/status
Active connections: 1
server accepts handled requests
 1 1 1
Reading: 0 Writing: 1 Waiting: 0
[root@server3 nginx-1.15.8]# curl http://127.0.0.1/status
Active connections: 1
server accepts handled requests
 2 2 2
Reading: 0 Writing: 1 Waiting: 0
[root@server3 nginx-1.15.8]# curl http://127.0.0.1/status
Active connections: 1
server accepts handled requests
 3 3 3
Reading: 0 Writing: 1 Waiting: 0
4:查看nginx服务是否搭建完成,

但是只能看到nginx主页,不能查看到服务,因为之前设置了只允许server3主机进行访问

5:整个服务的流程

6:编写脚本:

脚本内容
![]()
7:重新开启server3上zabbix-agent服务:
![]()
8:server1测试
[root@server1 4.0]# yum install -y zabbix-get-4.0.5-1.el7.x86_64.rpm

[root@server1 4.0]# zabbix_get -s 172.25.36.3 -p 10050 -k "nginx.active"
1
9:web界面,添加模板:


添加图形:

添加监控项:


10:添加字体:
在互联网上获取字体:
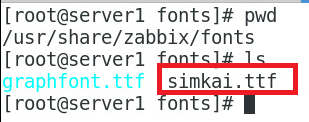
修改配置文件:


此时再查看:

添加监控项:
 添加文件:
添加文件:
![]()
重新启动服务:
server1上进行检测:
[root@server1 include]# zabbix_get -s 172.25.36.3 -p 10050 -k "nginx.active"
35
添加监控项

添加图形:


此时就能显示监控到了

测试:并发访问
[root@foundation38 4.0]# ab -c 100 -n 1000 http://172.25.36.3/index.html
监控上明显有个上升的趋势:

zabbix监控mysql数据库:
1:用zabbix监控服务自带的监控数据库的模块


查看配置文件(不需要做修改),建立目录,编辑文件


重新开启服务:
![]()


但是对于数据库来说,这些监控项还是太少了,一般都使用第三方模块对数据库进行监控
1:安装插件
[root@server1 ~]# rpm -ivh percona-zabbix-templates-1.1.8-1.noarch.rpm
warning: percona-zabbix-templates-1.1.8-1.noarch.rpm: Header V4 DSA/SHA1 Signature, key ID cd2efd2a: NOKEY
Preparing...                          ################################# [100%]
Updating / installing...
   1:percona-zabbix-templates-1.1.8-1 ################################# [100%]

Scripts are installed to /var/lib/zabbix/percona/scripts
Templates are installed to /var/lib/zabbix/percona/templates
2:复制文件
[root@server1 ~]# cd /var/lib/zabbix/percona/scripts/
[root@server1 scripts]# ls
get_mysql_stats_wrapper.sh  ss_get_mysql_stats.php
[root@server1 scripts]# cd ../templates/
[root@server1 templates]# ls
userparameter_percona_mysql.conf
zabbix_agent_template_percona_mysql_server_ht_2.0.9-sver1.1.8.xml
[root@server1 templates]# cp userparameter_percona_mysql.conf /etc/zabbix/zabbix_agentd.d/
3:修改配置文件
[root@server1 templates]# vim userparameter_percona_mysql.conf  ##查看,未做修改

[root@server1 scripts]# vim ss_get_mysql_stats.php.cnf
<?php
$mysql_user = 'root';
$mysql_pass = 'westos';
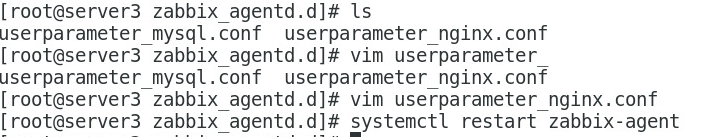
4:重新开启服务
[root@server1 scripts]# systemctl restart zabbix-agent

[root@server1 scripts]# cd /etc/zabbix/zabbix_agentd.d/
[root@server1 zabbix_agentd.d]# ls
userparameter_mysql.conf  userparameter_percona_mysql.conf

[root@server1 zabbix_agentd.d]# /var/lib/zabbix/percona/scripts/get_mysql_stats_wrapper.sh gg
19
5:查看监控项

6:导入文件:


导入文件:


此时查看到有191个监控项,基本能够满足生产环境的需求了
给zabbix server主机添加模板:


更新完之后,监控项变多

