MapServer Tutorial——MapServer7.2.1教程学习——第一节用例实践:Example1.5 Adding a raster layer
一、前言
MapServer不仅支持矢量数据(point, lines, polygons, and annotations),同时也支持栅格数据。通过GDAL库,MapServer可以输入输出多种类型的栅格数据。
在4.x版本前,MapServer输出栅格数据仅限于单个图层、灰度图像或伪彩色图像。
当前版本支持RGB图像和多光谱图像(多层级multi-layer)。此示例演示如何选择使用多光谱数据时要显示的图层。官网地址:https://www.mapserver.org/tutorial/example1-5.html
注意 在使用RGB和多光谱图像时,可能会出现明显的性能问题。
因为MapServer5.x后使用AGG或GD2.x来生成输出的图像,它还支持RGB(24位或真彩色)输出。因此,除了8位(灰度图像或伪彩色图像)png8之外,现在还可以使用png(真颜色)进行输出。此示例使用PNG作为ImageType。
注意 与RGB输入一样,与PNG8相比,使用PNG时可能会出现明显的性能问题。
MapServer实际上也可以使用gdal生成输出图像,但这是另一个主题。如果您想了解更多信息,请查看mapfile引用中的outputformat对象。
二、创建站点Example1.5 Adding a raster layer
1.文件准备
在cmd中输入:cd /d E:\SvnWorkspace\LY_WEB_GIS\branches\Documents\ms4w-mapserver-for-wimdows\release-1911-x64-gdal-2-3-3-mapserver-7-2-1\apps
在cmd中输入:md Example1.5
在cmd中输入:cd Example1.5
在cmd中输入:md data
在cmd中输入:md logs
在cmd中输入:md fonts
在cmd中输入:md symbols
在cmd中输入:cd.>web.config
在cmd中输入:cd.>example1_5.map
在cmd中输入:cd data
在cmd中输入:md raster
修改web.config的内容如下
<?xml version="1.0" encoding="UTF-8"?>
<configuration>
    <system.webServer>
        <handlers>
            <add name="MapServerFastCgi" path="*" verb="*" type="" modules="FastCgiModule"
        scriptProcessor="E:\SvnWorkspace\LY_WEB_GIS\branches\Documents\ms4w-mapserver-for-wimdows\release-1911-x64-gdal-2-3-3-mapserver-7-2-1\bin\mapserv.exe"
        resourceType="Unspecified" requireAccess="Script" allowPathInfo="false" preCondition=""  />
        </handlers>
        <caching enabled="true" enableKernelCache="true" />
    </system.webServer>
</configuration>
将 app\tutorial\fonts 中的所有内容拷贝到 app\Example1.5\fonts 文件夹中(字体文件)
将 app\tutorial\data 中的 states_ugl.dbf、states_ugl.shp、states_ugl.shx 拷贝到 app\Example1.5\data 文件夹中(数据文件)
将 app\tutorial\symbols 中的 symbols35.sym 拷贝到 app\Example1.5\symbols 文件夹中(符号文件)
将 app\tutorial\data\raster 中的 mod09a12003161_ugl_ll_8bit.tif、mod09a12003161_ugl_ll_idxa.tif 拷贝到 app\Example1.5\data\raster 文件夹中(图层数据文件)
2.在IIS中创建站点Example1.5
应用程序池名称:Example1.5;站点端口:8015
3.给应用程序池读写log文件夹权限
在cmd中输入:icacls "E:\SvnWorkspace\LY_WEB_GIS\branches\Documents\ms4w-mapserver-for-wimdows\release-1911-x64-gdal-2-3-3-mapserver-7-2-1\apps\Example1.5\logs" /grant "IIS AppPool\Example1.5":(OI)(CI)RW
4.修改example1_5.map文件
# The annotated map file (sort of)
# Created by Pericles S. Nacionales for the MapServer tutorial
# 20050408
#
# MapServer map file uses the pound sign (#) to denote the start of a line
# comment--each line that needs to be commented has to be prepended with a "#".
#
# Map files begin with MAP keyword to signify the start of the map object.
# Well, the entire map file is THE map object.  Enclosed between MAP and END
# at the very bottom of this map file, are keyword/value pairs and other
# objects.
MAP
  IMAGETYPE      PNG
  EXTENT         -97.238976 41.619778 -82.122902 49.385620
  SIZE           400 300
  SHAPEPATH      "./data"
  IMAGECOLOR     255 255 255
  FONTSET        "./fonts/fonts.list"
  SYMBOLSET      "./symbols/symbols35.sym"

  # Layer objects are defined beneath the map object.  You need at least one
          # layer defined in your map file before you can display a map...  You can
  # define as many layers as you'd like although a limit is typically hard-coded
  # in map.h in the MapServer source.  The default limit is set at 100.  You'd
  # have to have a very specialized application to need more than 100 layers in
  # your application.
  #
  # Start of LAYER DEFINITIONS ---------------------------------------------
  LAYER # States polygon layer begins here
    NAME         states
    DATA         states_ugl
    STATUS       OFF
    TYPE         POLYGON

    # CLASSITEM defines the non-spatial attribute that you will be using to
    # separate a layer into classes.  This attribute will be in the DBF file
    # of your shapefile (it will be different for each data format).  In this
    # example the shapefile states_ugl has an associated database
    # (states_ugl.dbf) that contains an attribute called "CLASS".  You will be
    # using two values in the CLASS attribute to separate the classes (also
    # called themes) used in this layer--land and water.  CLASSITEM is used in
    # association with the EXPRESSION parameter in the CLASS object.  See below.
    CLASSITEM    "CLASS"

    # The class object is defined within the layer object.  You can define as
    # many classes as you need (well, there are limits as with layers, but it's
    # senseless to define more than ten on a "normal" layer.  There are
    # situations, however, where you might have to do it.)
    CLASS
      NAME 'States'
      EXPRESSION 'land'

      # There are styles in a class, just like there are classes in a layer,
      # just like there are layers in a map.  You can define multiple styles in
      # a class just as you can define multiple classes in a layer and multiple
      # layers in a map.
      STYLE
        COLOR      232 232 232
      END
    END
  END # States polygon layer ends here

  # In addition to vector data (shapefiles are vector data), MapServer supports
  # a host of raster formats.  In GIS world, one of the most common raster
  # formats is GeoTIFF, a TIFF image with geospatial headers.  MapServer also
  # supports JPEG, PNG, GIF, and other common formats.  Other raster formats
  # supported by MapServer include ESRI Arc/Info grid, HDF and HDF-EOS, NetCDF,
  # Generic raster binaries, OGC Web Map Service (WMS) layers, etc.  Pretty much
  # any raster format you can think of is probably supported, thanks to the
  # impressive Geospatial Data Abstraction Library (GDAL, pronounced "GOODALL"
  # or GOODLE?).  More information on GDAL is available at http://www.gdal.org.
  #
  # MapServer 4.x can read and display bitmapped (like GIFs), RGB/A (true
  # color), and multispectral (images with more than 3 bands, like raw LandSat
  # images) rasters.
  LAYER # MODIS raster layer begins here
    NAME         modis
    DATA         "raster/mod09a12003161_ugl_ll_8bit.tif"
    STATUS       OFF
    TYPE         RASTER
    PROCESSING   "BANDS=1,2,3"
    OFFSITE      71 74 65
  END # MODIS raster layer ends here

  LAYER # States line layer begins here
    NAME         states_line
    DATA         states_ugl
    STATUS       OFF
    TYPE         LINE

    CLASSITEM    "CLASS"
    CLASS
      NAME       'State Boundary'
      EXPRESSION 'land'
      STYLE
        SYMBOL     'line5'
        COLOR      64 64 64
        SIZE       1
      END
    END
  END # States line layer ends here

  # Labels can be defined in its own layer.  This is useful if, say, you want
  # to label a polygon layer that's covered by another layer.  By keeping the
  # label separate from the polygon and placing it near the bottom of the map
  # file (so its drawn on, or near the, top), you can still see the label even
  # though you might not be able to see the polygon.  It is also a good
  # alternate to point symbols.
  #
  # A label layer is actually defined with ANNOTATION type (This is derived from
  # points, Node IDs for lines, or polygon IDs).
  LAYER # States label layer begins here
    NAME         states_label
    DATA         states_ugl
    STATUS       OFF
    TYPE         POLYGON           #ANNOTATION 此类型的LAYER已经被移除。此处需要表达的是标签,请查看上一章《MapServer Tutorial——MapServer7.2.1教程学习——第一节用例实践:Example 1.4 Labeling the Map》
                      #LAYER 官网:https://www.mapserver.org/mapfile/layer.html ,定位到 TYPE 对象处查看。

    CLASSITEM    "CLASS"

    # Just like CLASSITEM, LABELITEM defines the database attribute that you
    # will be using to draw labels.  In this case, the values of the attribute
    # "STATE" will be used to label the states polygons.
    LABELITEM    "STATE"

    CLASS
      EXPRESSION 'land'
      STYLE
        COLOR      -1 -1 -1
      END

      # There can be labels in a class, just like there are classes in a layer,
      # just like there are layers in a map.  You can define multiple labels in
      # a class just as you can define multiple classes in a layer and multiple
      # layers in a map.
      # MapServer has a very flexible labeling system.  With that flexibility
      # comes complexity, specially when using truetype fonts.  Please read
      # through the LABEL section of the MapServer map file documentation at
      # http://www.mapserver.org/mapfile for more information.
      LABEL
        COLOR 132 31 31
        #SHADOWCOLOR 218 218 218 # deprecated, use STYLE and GEOMTRANSFORM
        #SHADOWSIZE 2 2          # deprecated, use STYLE and GEOMTRANSFORM
        TYPE TRUETYPE
        FONT arial-bold
        SIZE 12
        ANTIALIAS TRUE
        POSITION CL
        PARTIALS FALSE
        MINDISTANCE 300
        BUFFER 4
      END # end of label
    END # end of class
  END # States label layer ends here
  # End of LAYER DEFINITIONS -------------------------------
  DEBUG 5
  CONFIG "MS_ERRORFILE" "logs\ms.log"
END # All map files must come to an end just as all other things must come to...
5.浏览查看
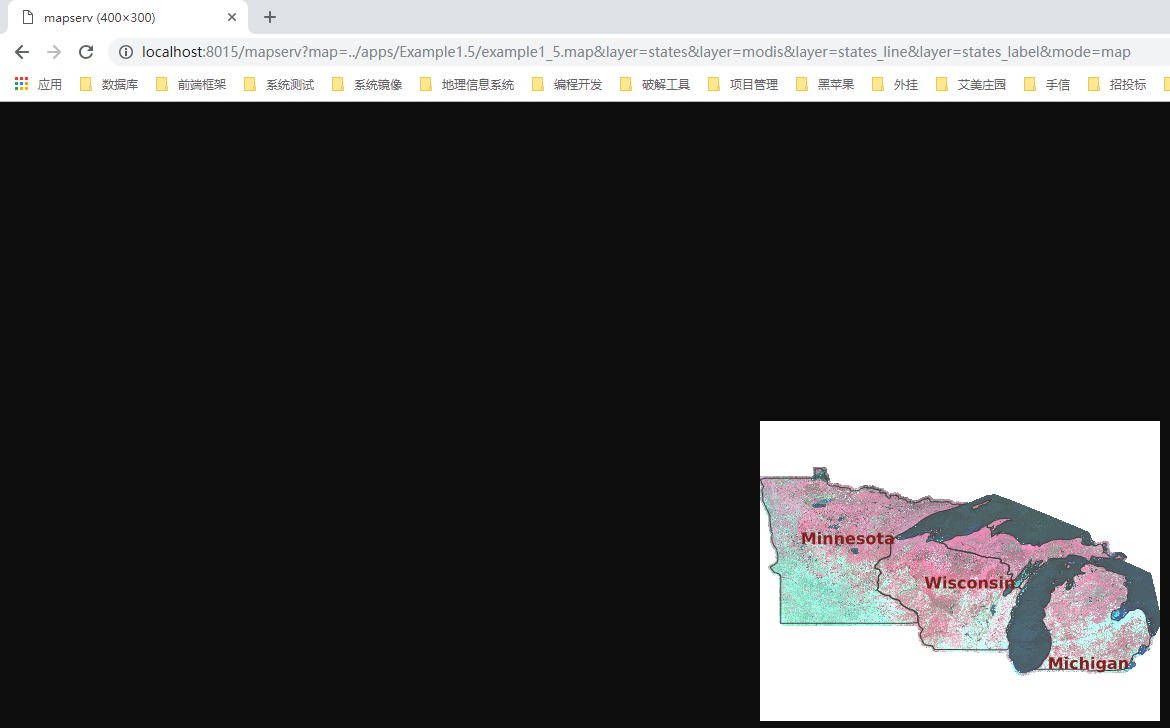
在浏览器中输入:http://localhost:8015/mapserv?map=../apps/Example1.5/example1_5.map&layer=states&layer=modis&layer=states_line&layer=states_label&mode=map
三、MapFile文件解析
1.文件结构
                                             MAP
             LAYER #1-------------LAYER #2----|----LAYER #3--------LAYER #4
          (states)              (modis)       (states_line)   (states_label)
             |                                     |               |
(land) CLASS-|-CLASS (water)                       |-CLASS         |-CLASS
          |     |                                     |               |
    STYLE-|     |-STYLE                               |-STYLE   STYLE-|-LABEL
当前案例分为四个图层:
-
-
- tsates用来展示几何区域
- modis展示tiff图像文件,栅格数据
- states_line展示的是CLASSITEM=CLASS,EXPRESSION=land 的线条数据,其中线条符号为 line5
-
# 12
Symbol
NAME 'line5'
Type VECTOR
TRANSPARENT 0
Points
1 0
0 1
0 1
1 0
END
END

#line的数据类型为 VECTOR 矢量数据,详情请看:https://www.mapserver.org/mapfile/symbology/construction.html中 Symbols of TYPE vector and ellipse
#同时,请查看:https://www.mapserver.org/mapfile/symbol.html
#此处可以理解为构建了一个矢量区域,有个坐标系,点(1,0)、(0,1)、(0,1)、(1,0)画了一个矩形,然而此矩形看起来没有宽度,长为 2 的开方(三角形勾股定理)
#同时,将这个矢量矩形(看起来就是短的线)中心基于 dbf 数据中 CLASS = land 的 POLYGON 中的点数据来展示,这样看起来就给 land 外面画了一个线。
2.对象参数解释
IMAGETYPE
MapServer生成输出数据的格式。在cmd中输入:mapserv -v 查看。值PNG是值输出24位PNG或真色PNG。
SYMBOLSET
SYMBOL集合的文件位置。可以使绝对路径,也可以是和mapfile(example1_5.map)的相对路径。字符集位置。可以先了解一下SYMBOL,资料如下:
SYMBOL的讲解:https://www.mapserver.org/mapfile/symbol.html
创建字符集文件:https://www.mapserver.org/mapfile/symbology/construction.html
DATA raster/mod09a12003161_ugl_ll_8bit.tif
在NAME为modis的图层中,添加的是一个GeoTIFF图层数据。MapServer支持矢量数据和栅格数据。这个图层为栅格类型。这个图层是通过GDAL的库来完成支持的。MapSeerver上不同的栅格支持和生成请查看:https://www.mapserver.org/input/raster.html#raster
modis数据了解请进:https://modis.gsfc.nasa.gov/
TYPE RASTER
在NAME为modis的图层中,当前LAYER的数据类型。此处使用的是RASTER。同时在LAYER中,MapServer还支持POLYGON,LINE,POINT,LABEL中支持ANNOTATION等。
PROCESSING "BANDS=1,2,3"
这个位置我觉得很难理解。查了相关资料。大概意思是,MapServer调用GDAL库来处理tiff图像,并输出显示。
PROCESSING表示进程。根据进程值来决定调用那个库。请查看:https://www.mapserver.org/mapfile/layer.html 中PROCESSING 段落。
BANDS表示波段,GDAL源码中通过RasterIO来读取波段数据。
TIFF文件时位图,在windows中的存储格式为BGR,然后MapServer根据参数调用时,对参数做了调整顺序的相关处理。1,2,3表示Red,Green和blue三种波段选择。
具体的我也不大清楚,总之尝试后,发现1,2,3在浏览器中显示的是和直接看到tiff相差不远,只是灰色的底色变成白色的。
同时也请查看:https://www.mapserver.org/input/raster.html 中 BANDS=red_or_grey[,green,blue[,alpha]] 处的解释。
OFFSITE
设置当前LAYER层的背景颜值组成。(Sets the color index to treat as transparent for raster layers.)
告诉MapServer按照像素值渲染背景(或忽略)。
想了半天没弄懂,最后乱改这个值也没发现什么。知道读到or ignore之后。忽略,这个tif文件正好背景颜色值RGB是:71 74 65 ,是否设置OFFSITE值和背景颜色值一样时,做忽略处理。
但是在设置为其他颜色值时,却还是显示当前tif文件的背景颜色。这就十分尴尬了,是否是因为当前tif文件有背景颜色,然后将OFFSITE设置的颜色给覆盖了。
颜色组成分多种形式,当前案例是:Indexed Color Image(伪彩色图像)。还有:RGB、RGBA等。
四、RGB vs Indexed Color Image 真彩色和伪彩色的对比
1.关于伪彩色,可以查看:https://en.wikipedia.org/wiki/Indexed_color
2.修改mapfile的相关配置,将
DATA "raster/mod09a12003161_ugl_ll_8bit.tif"
STATUS DEFAULT
TYPE RASTER
PROCESSING "BANDS=1,2,3"
OFFSITE 71 74 65
修改为
DATA "raster/mod09a12003161_ugl_ll_idxa.tif"
STATUS DEFAULT
TYPE RASTER
OFFSITE 70 74 66
看看效果
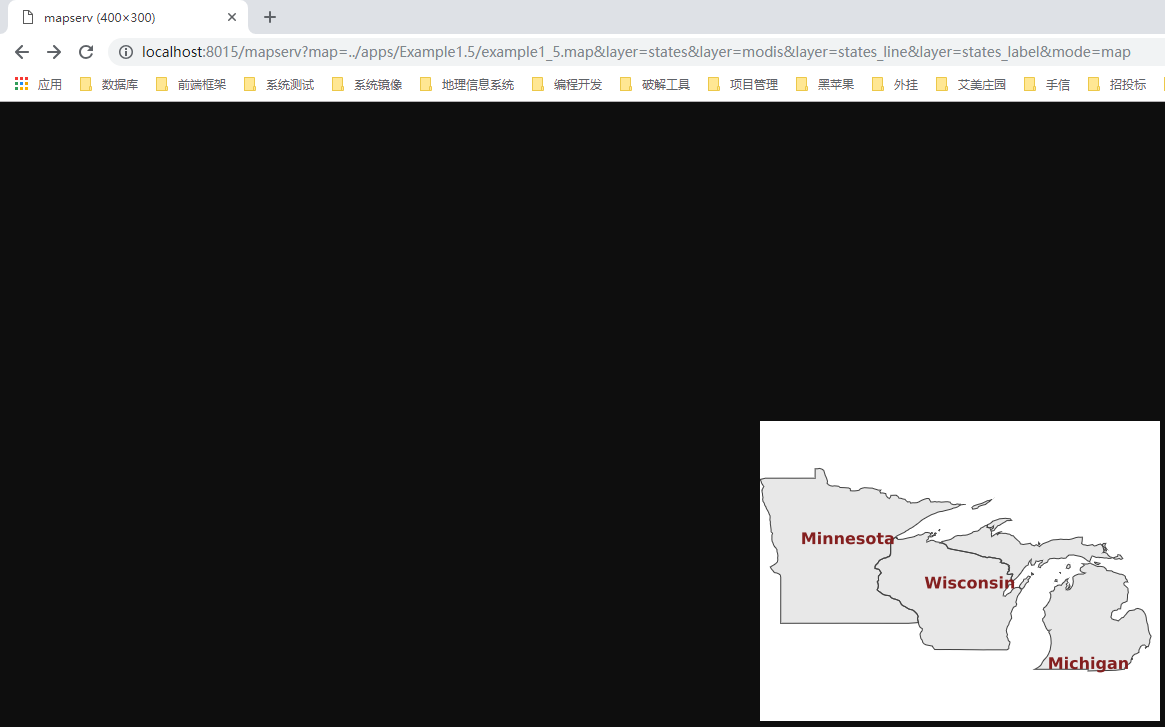
显示的效果已经改变。去掉GDAL的程序处理后,也不显示背景色了。
五、后记
感觉模拟样例做一个很简单,但是弄清楚相关的mapfile对象却很头痛,涉及的知识点太多,不理解的位置太多。比如:OFFSITE就不动。继续深入学习,相信随着了解的越来越多,就会知道其作用。