- 爬取大学信息并
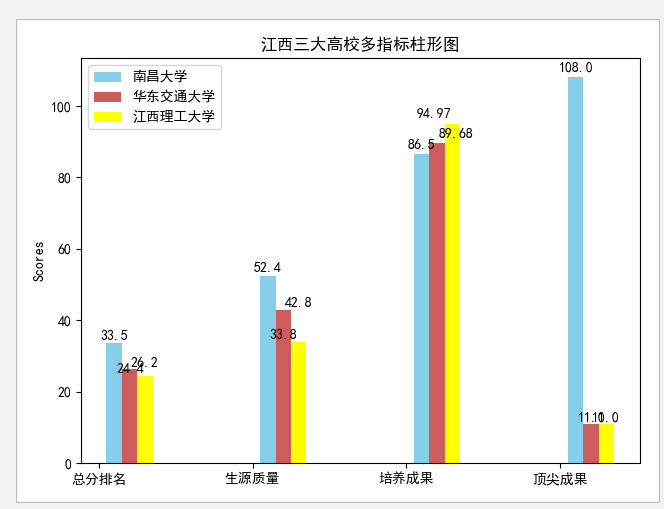
- 通过matplotlib与numpy绘制多指标柱形图
- 就某一因素绘制饼图并突出其中一个对象(本例中为江西理工大学)
  1 # -*- coding:utf-8 -*-
  2 # author:zxy
  3 # date:2018-12-24
  4 # update:2018-12-27
  5
  6 from bs4 import BeautifulSoup
  7 import requests
  8 import matplotlib.pyplot as plt
  9 import numpy as np
 10
 11
 12 class colleges():
 13     def __init__(self):
 14         self.url1='http://www.zuihaodaxue.com/zuihaodaxuepaiming2018.html'
 15         self.url2= 'http://www.zuihaodaxue.com/biyeshengjiuyelv2018.html'
 16         self.url3 = 'http://www.zuihaodaxue.com/dingjianchengguopaiming2018.html'
 17         self.HEADERS = {
 18     'User-Agent': 'Mozilla/5.0 (Windows NT 6.1; Win64; x64) '
 19                   'AppleWebKit/537.36 (KHTML, like Gecko)'
 20             ' Chrome/67.0.3396.99 Safari/537.36'
 21 }
 22         self.university={}
 23
 24     def parse_html1(self):
 25         request = requests.get(url=self.url1, headers=self.HEADERS)
 26         request.encoding = 'utf-8'
 27         soup = BeautifulSoup(request.text, 'lxml')
 28         trs = soup.find_all('tr', {'class': "alt"})
 29         for tr in trs:
 30             tds = tr.find_all('td')
 31             uName = tds[1].string
 32             uRank = tds[0].string
 33             uProvince = tds[2].string
 34             uGrades = tds[3].string
 35             studentQuality = tds[4].string
 36
 37             if uProvince=="江西" and uName!="宜春学院" and  uName!="九江学院":
 38                 c = []
 39                 c.append(uRank)
 40                 c.append(str(uName))
 41                 c.append(uProvince)
 42                 c.append(uGrades)
 43                 c.append(studentQuality)
 44                 self.university[uName]=c
 45
 46     def parse_html2(self):
 47         request = requests.get(url=self.url2, headers=self.HEADERS)
 48         request.encoding = 'utf-8'
 49         soup = BeautifulSoup(request.text, 'lxml')
 50         trs = soup.find_all('tr', {'class': "alt"})
 51         for tr in trs:
 52             tds = tr.find_all('td')
 53             uName = tds[1].string
 54             employmentRate = tds[3].string
 55
 56             for key in self.university:
 57                 if key==uName:
 58                     tmp=self.university[uName]
 59                     tmp.append(employmentRate)
 60
 61     def parse_html3(self):
 62         request = requests.get(url=self.url3, headers=self.HEADERS)
 63         request.encoding = 'utf-8'
 64
 65         soup = BeautifulSoup(request.text, 'lxml')
 66         trs = soup.find_all('tr', {'class': "alt"})
 67         for tr in trs:
 68             tds = tr.find_all('td')
 69             uName = tds[1].string
 70             papers = tds[3].string
 71
 72             for key in self.university:
 73                 if key == uName:
 74                     # print(uName,results)
 75                     tmp = self.university[uName]
 76                     tmp.append(papers)
 77         # print(uRank,uName,uProvince,uGrades,studentQuality,employmentRate,papers)
 78         # print(self.university)
 79
 80     def _problem_reaults_print(self):
 81         for key in self.university:
 82             c=self.university[key]
 83             print(c)
 84
 85
 86     def _draw_bar(self):
 87         plt.rcParams['font.sans-serif'] = ['SimHei']
 88         plt.rcParams['font.family'] = 'sans-serif'
 89         plt.rcParams['axes.unicode_minus'] = False
 90         nanchang=[]
 91         huadong=[]
 92         ligong=[]
 93         # print(uName,uRank,uGrades,studentQuality)
 94         for key in self.university:
 95             info = self.university[key]
 96             if info[1]=='南昌大学':
 97                 nanchang.extend(info[3:])
 98                 print("="*30)
 99                 print(nanchang)
100             elif info[1]== "华东交通大学":
101                 huadong.extend(info[3:])
102                 print("=" * 30)
103                 print(huadong)
104             elif info[1]=="江西理工大学":
105                 ligong.extend(info[3:])
106                 print("=" * 30)
107                 print(ligong)
108
109
110         nanchang_means= (33.5,52.4,86.5,108)
111         huadong_means =(26.2,42.8,89.68,11)
112         ligong_means = (24.4,33.8,94.97,11)
113
114         ind = np.arange(len(nanchang_means))
115         width = 0.10
116
117         fig, ax = plt.subplots()
118         rects1 = ax.bar(ind + width, nanchang_means, width,
119                         color='SkyBlue', label='南昌大学')
120         rects2 = ax.bar(ind + width*2, huadong_means, width,
121                         color='IndianRed', label='华东交通大学')
122         rects3 = ax.bar(ind + width* 3, ligong_means, width,
123                         color='yellow', label='江西理工大学')
124
125         ax.set_ylabel('Scores')
126         ax.set_title('江西三大高校多指标柱形图')
127         ax.set_xticks(ind)
128         ax.set_xticklabels(('总分排名', '生源质量', '培养成果', '顶尖成果'))
129         ax.legend()
130
131         def autolabel(rects, xpos='center'):
132
133             xpos = xpos.lower()  # normalize the case of the parameter
134             ha = {'center': 'center', 'right': 'left', 'left': 'right'}
135             offset = {'center': 0.5, 'right': 0.57, 'left': 0.43}  # x_txt = x + w*off
136
137             for rect in rects:
138                 height = rect.get_height()
139                 ax.text(rect.get_x() + rect.get_width() * offset[xpos], 1.01 * height,
140                         '{}'.format(height), ha=ha[xpos], va='bottom')
141
142         autolabel(rects1, "center")
143         autolabel(rects2, "right")
144         autolabel(rects3,'left')
145
146         plt.show()
147
148
149     def _draw_pie(self):
150         label = []
151         sizes = []
152         for key in self.university:
153             info=self.university[key]
154             name=str(info[1]) #str 南昌大学
155             label.append(name)
156             if len(info)<6:
157                 sizes.append(1)#
158             else:
159                 sizes.append(info[-1])
160
161         labels=tuple(label)
162         # print(label)
163         # print(sizes)
164         plt.rcParams['font.sans-serif'] = ['SimHei']
165         plt.rcParams['font.family'] = 'sans-serif'
166         # 解决负号'-'显示为方块的问题
167         plt.rcParams['axes.unicode_minus'] = False
168
169         plt.title("江西各高校的顶尖成果(被引论文数量)饼图")
170         explode = (0, 0,0,0,0, 0.1,0,0,0,0,0,0,0,0,0)
171         fig1, ax1 = plt.subplots()
172         ax1.pie(sizes, explode=explode, labels=labels, autopct='%1.1f%%',
173                 shadow=True, startangle=90)
174         ax1.axis('equal')
175         plt.show()
176
177
178     def run(self):
179         self.parse_html1()
180         self.parse_html2()
181         self.parse_html3()
182         self._problem_reaults_print()
183         self._draw_bar()
184         self._draw_pie()
185
186
187 if __name__ == '__main__':
188     c=colleges()
189     # c.run()
结果如下图所示