王家林人工智能AI第13课:使用Logistic Regression在Social Network上销售汽车并进行可视化性能评估老师微信13928463918


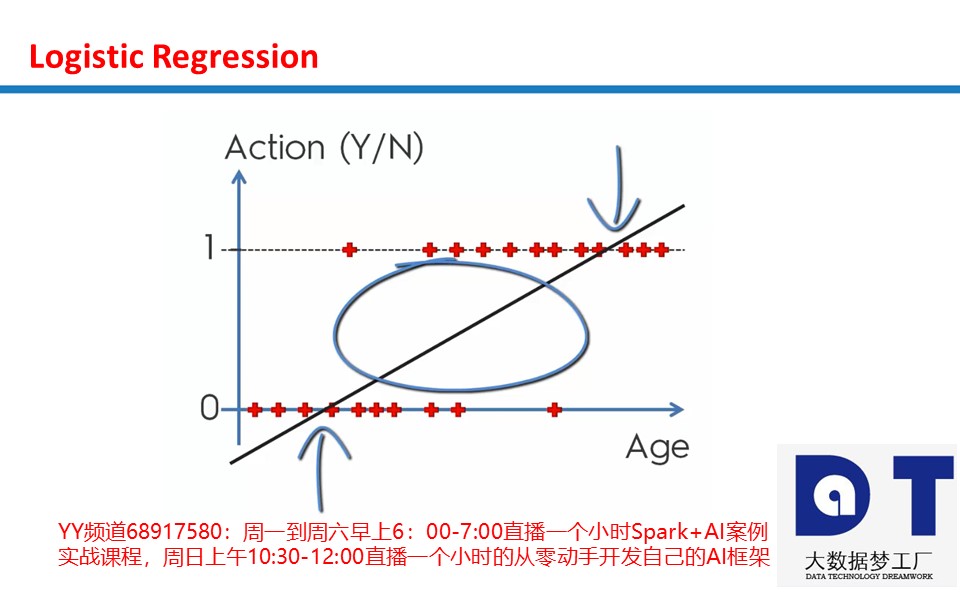
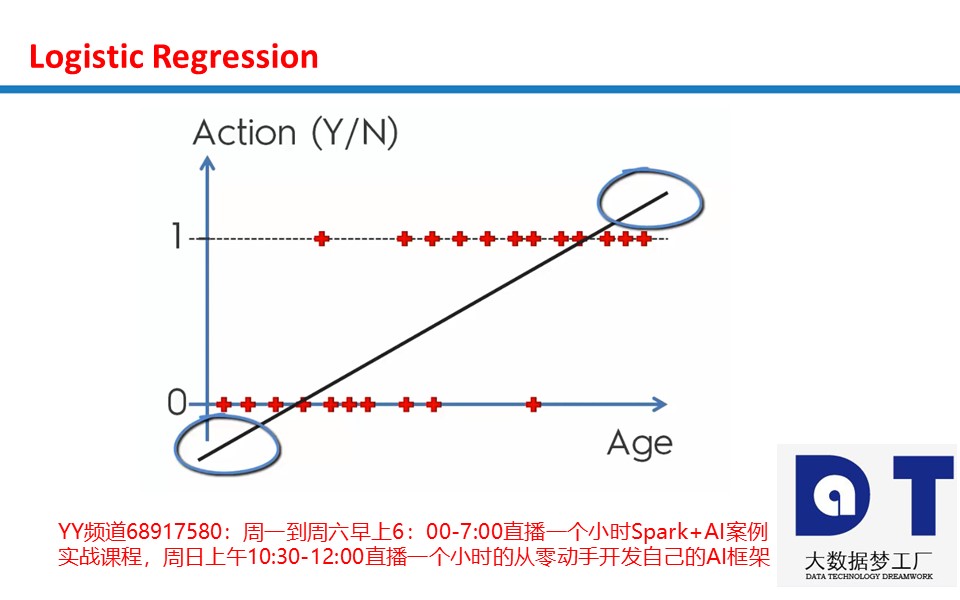
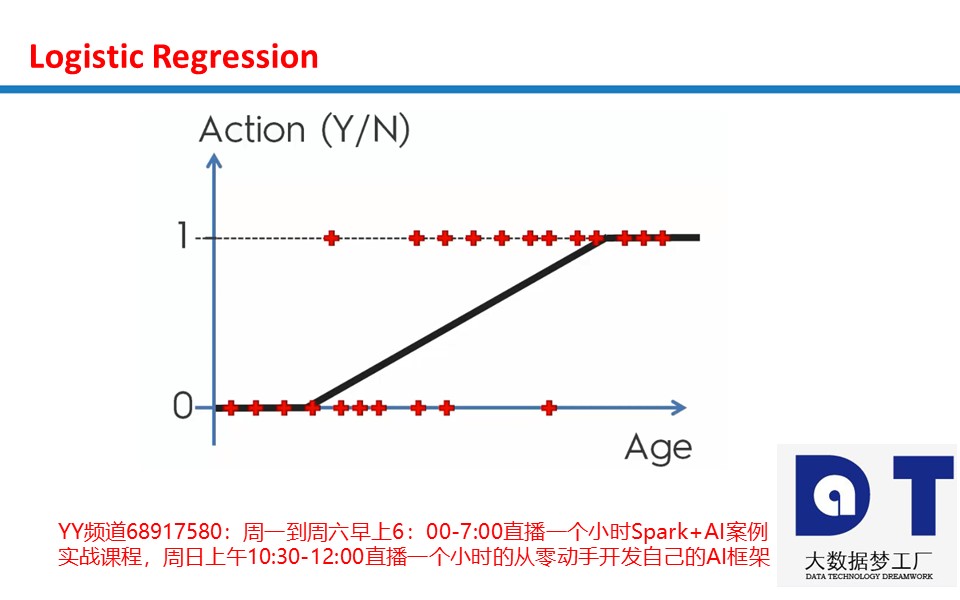

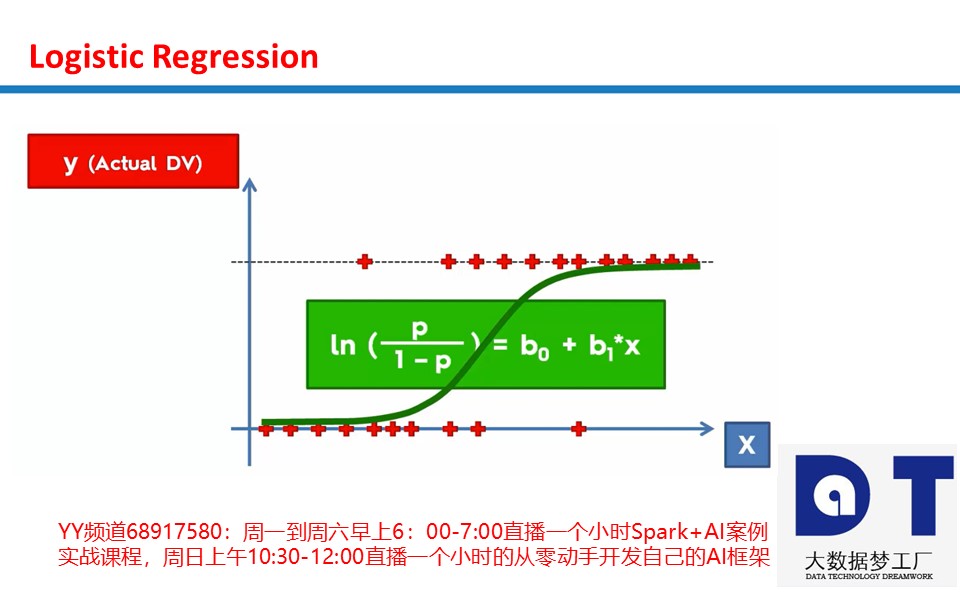
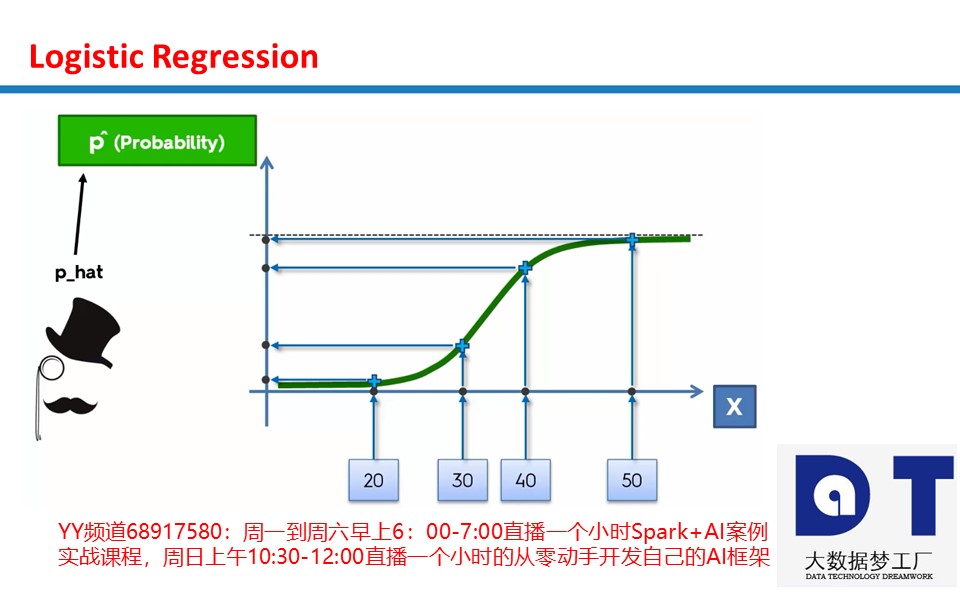
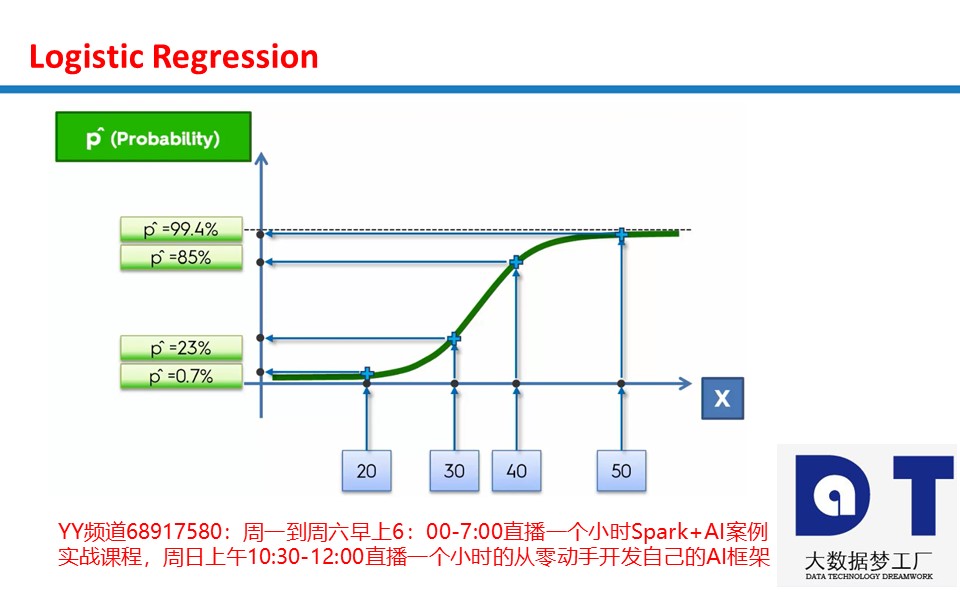
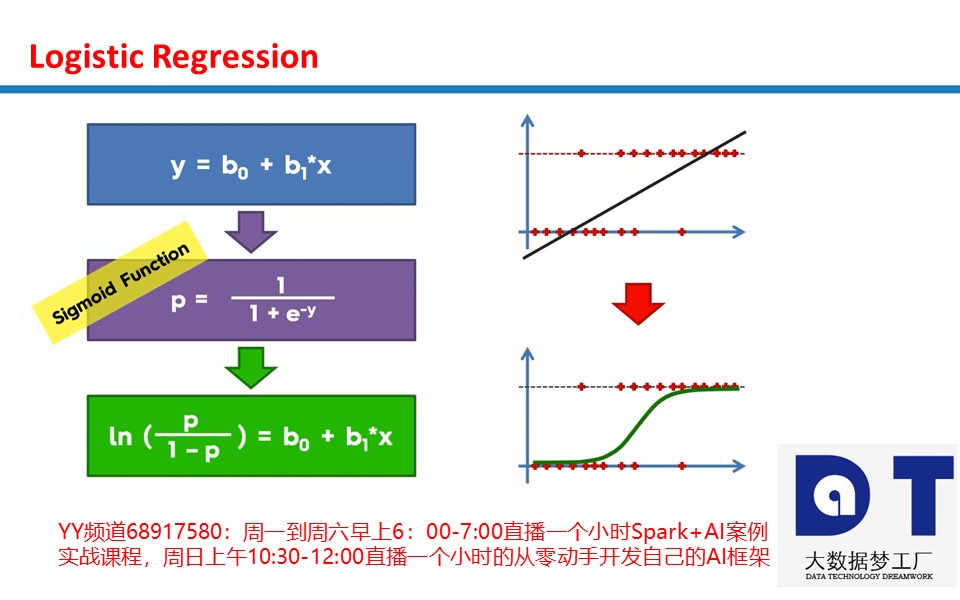


sigmoid Function公式推导

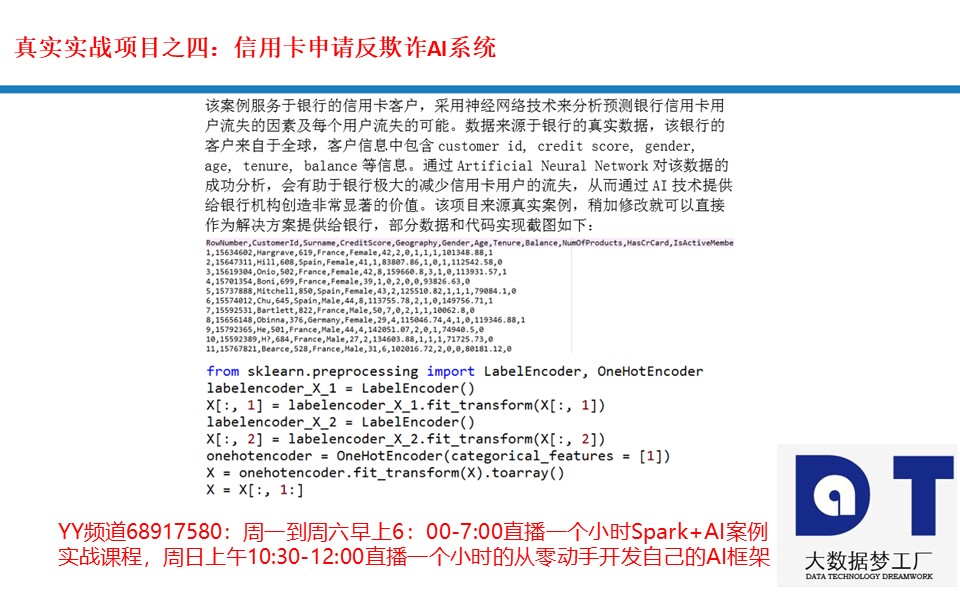
读入的数据Social_Network_Ads.csv:
User ID,Gender,Age,EstimatedSalary,Purchased
15624510,Male,19,19000,0
15810944,Male,35,20000,0
15668575,Female,26,43000,0
15603246,Female,27,57000,0 .......
logistic_regression.py 代码:
# Logistic Regression

# Importing the libraries
import numpy as np
import matplotlib.pyplot as plt
import pandas as pd

# Importing the dataset
dataset = pd.read_csv('Social_Network_Ads.csv')
X = dataset.iloc[:, [2, 3]].values
y = dataset.iloc[:, 4].values

# Splitting the dataset into the Training set and Test set
from sklearn.cross_validation import train_test_split
X_train, X_test, y_train, y_test = train_test_split(X, y, test_size = 0.25, random_state = 0)

# Feature Scaling
from sklearn.preprocessing import StandardScaler
sc = StandardScaler()
X_train = sc.fit_transform(X_train)
X_test = sc.transform(X_test)

# Fitting Logistic Regression to the Training set
from sklearn.linear_model import LogisticRegression
classifier = LogisticRegression(random_state = 0)
classifier.fit(X_train, y_train)

# Predicting the Test set results
y_pred = classifier.predict(X_test)

# Making the Confusion Matrix
from sklearn.metrics import confusion_matrix
cm = confusion_matrix(y_test, y_pred)

# Visualising the Training set results
from matplotlib.colors import ListedColormap
X_set, y_set = X_train, y_train
X1, X2 = np.meshgrid(np.arange(start = X_set[:, 0].min() - 1, stop = X_set[:, 0].max() + 1, step = 0.01),
                     np.arange(start = X_set[:, 1].min() - 1, stop = X_set[:, 1].max() + 1, step = 0.01))
plt.contourf(X1, X2, classifier.predict(np.array([X1.ravel(), X2.ravel()]).T).reshape(X1.shape),
             alpha = 0.75, cmap = ListedColormap(('red', 'green')))
plt.xlim(X1.min(), X1.max())
plt.ylim(X2.min(), X2.max())
for i, j in enumerate(np.unique(y_set)):
    plt.scatter(X_set[y_set == j, 0], X_set[y_set == j, 1],
                c = ListedColormap(('red', 'green'))(i), label = j)
plt.title('Logistic Regression (Training set)')
plt.xlabel('Age')
plt.ylabel('Estimated Salary')
plt.legend()
plt.show()

# Visualising the Test set results
from matplotlib.colors import ListedColormap
X_set, y_set = X_test, y_test
X1, X2 = np.meshgrid(np.arange(start = X_set[:, 0].min() - 1, stop = X_set[:, 0].max() + 1, step = 0.01),
                     np.arange(start = X_set[:, 1].min() - 1, stop = X_set[:, 1].max() + 1, step = 0.01))
plt.contourf(X1, X2, classifier.predict(np.array([X1.ravel(), X2.ravel()]).T).reshape(X1.shape),
             alpha = 0.75, cmap = ListedColormap(('red', 'green')))
plt.xlim(X1.min(), X1.max())
plt.ylim(X2.min(), X2.max())
for i, j in enumerate(np.unique(y_set)):
    plt.scatter(X_set[y_set == j, 0], X_set[y_set == j, 1],  # 文本分词,根据测试集y的结果分成2类:0,1
                c = ListedColormap(('red', 'green'))(i), label = j)
plt.title('Logistic Regression (Test set)')
plt.xlabel('Age')
plt.ylabel('Estimated Salary')
plt.legend()
plt.show()
运行结果:


3980元团购原价19800元的AI课程,团购请加王家林老师微信13928463918
基于王家林老师独创的人工智能“项目情景投射”学习法,任何IT人员皆可在无需数学和Python语言的基础上的情况下3个月左右的时间成为AI技术实战高手:
1,五节课(分别在4月9-13号早上YY视频直播)教你从零起步(无需Python和数学基础)开发出自己的AI深度学习框架,五节课的学习可能胜过你五年的自我摸索;
2,30个真实商业案例代码中习得AI(从零起步到AI实战专家之路):10大机器学习案例、13大深度学习案例、7大增强学习案例(本文档中有案例的详细介绍和案例实现代码截图);
3,100天的涅槃蜕变,平均每天学习1个小时(周一到周六早上6:00-7:00YY频道68917580视频直播),周末复习每周的6个小时的直播课程(报名学员均可获得所有的直播视频、全部的商业案例完整代码、最具阅读价值的AI资料等)。