王家林人工智能AI第九节课:AI的上帝视角:神经网络能够完成各种计算模式的根本原因及神经网络能够识别图片宇宙密码 老师微信13928463918


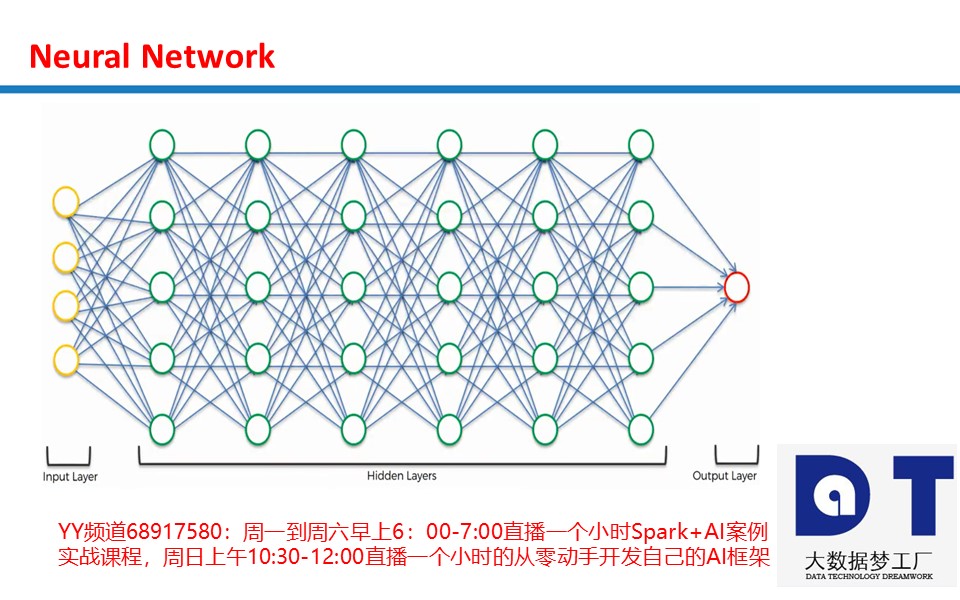


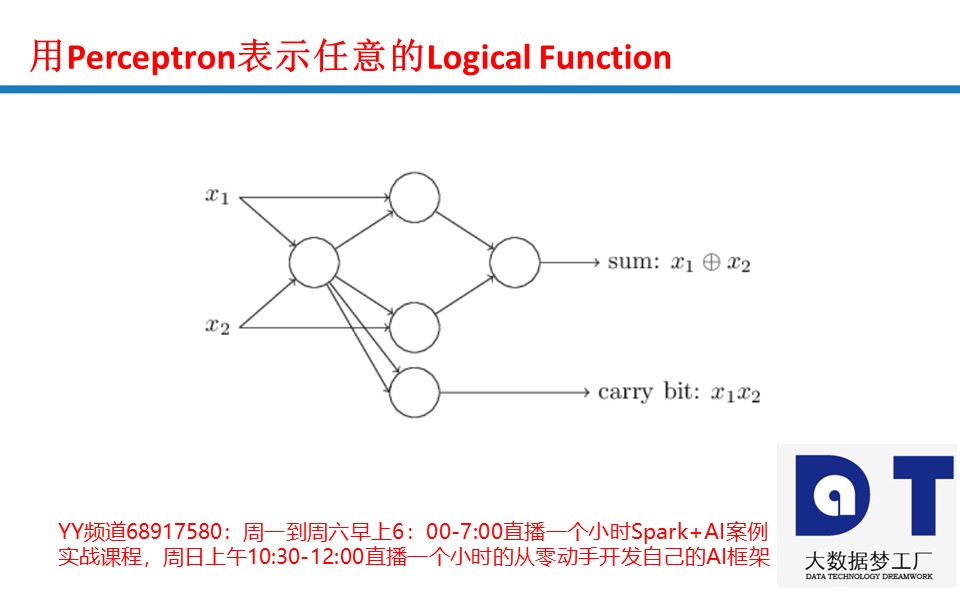
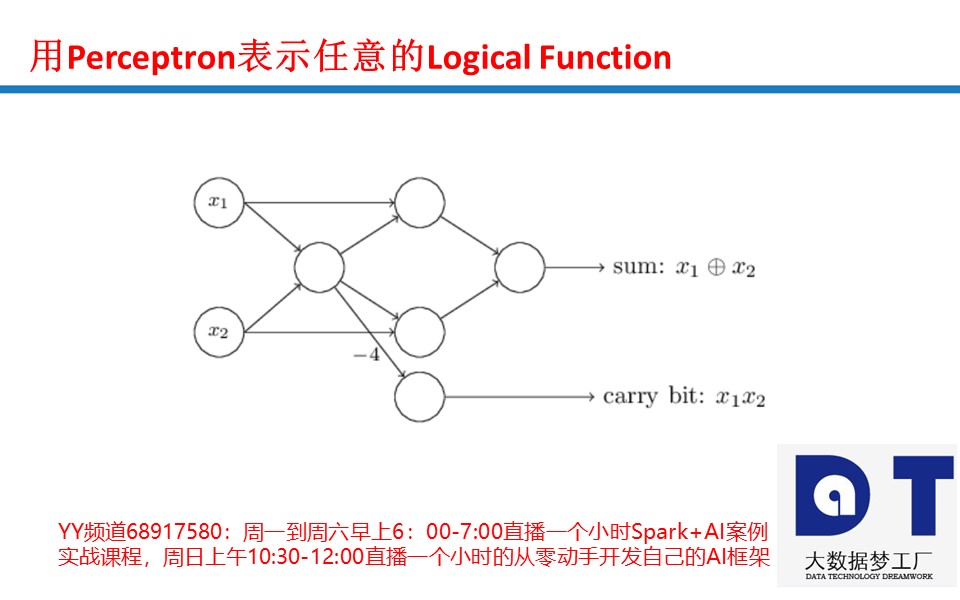


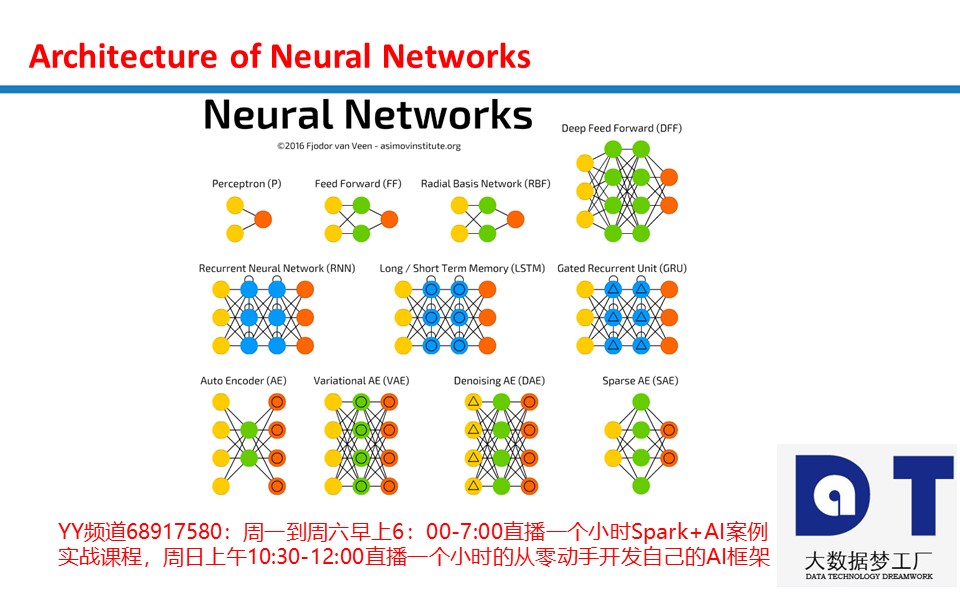


Neural Networks为什么能够完成各类计算之感知器开发逻辑门
感知器是一种将信息从输入层发送到输出层的算法。 该图显示了2个输入感知器。
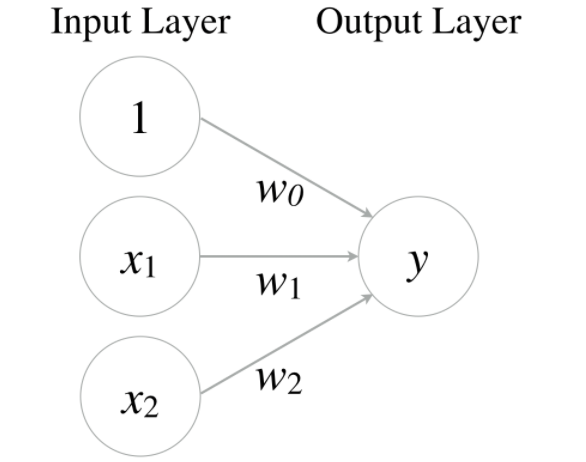
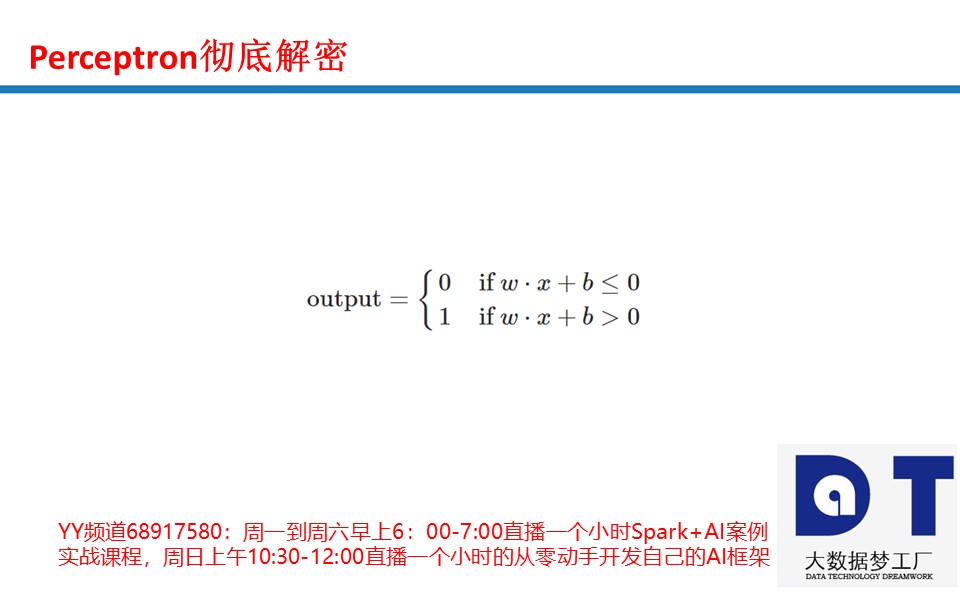
x1,x2 是输入信号, y 是一个输出信号, w0是一个Bias,而且 w1,w2 是权重。 信号也被称为神经元或节点。 只有当输入的总和超过阈值时,它们才输出1。 在这种情况下,函数表示如下:
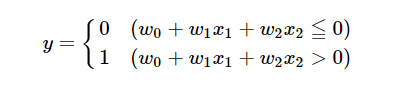
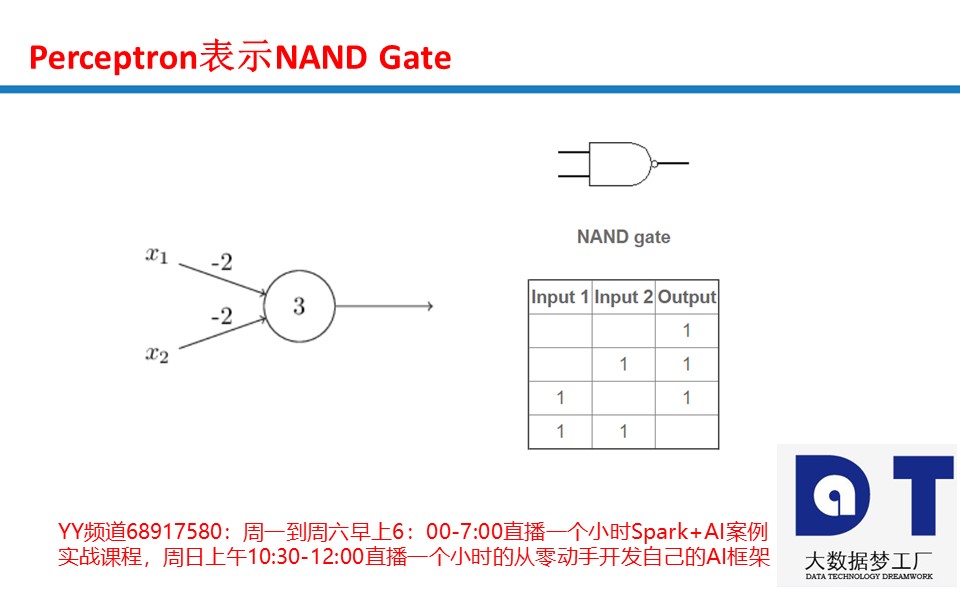
您可以使用此功能创建逻辑门。 如果 w0=−1.5 , w1=1 ,和 w2=1 ,它将成为与门。 这是AND,OR和NAND的真值表。 检查值( w0,w1,w2 )你自己的OR和NAND门!

可以用下面的python代码实现逻辑门:
import numpy as np


def AND(x1, x2):
    x = np.array([1, x1, x2])
    w = np.array([-1.5, 1, 1])
    y = np.sum(w*x)
    if y <= 0:
        return 0
    else:
        return 1

def OR(x1, x2):
    x = np.array([1, x1, x2])
    w = np.array([-0.5, 1, 1])
    y = np.sum(w*x)
    if y <= 0:
        return 0
    else:
        return 1

def NAND(x1, x2):
    x = np.array([1, x1, x2])
    w = np.array([1.5, -1, -1])
    y = np.sum(w*x)
    if y <= 0:
        return 0
    else:
        return 1


if __name__ == '__main__':
    input = [(0, 0), (1, 0), (0, 1), (1, 1)]

    print("AND")
    for x in input:
        y = AND(x[0], x[1])
        print(str(x) + " -> " + str(y))

    print("OR")
    for x in input:
        y = OR(x[0], x[1])
        print(str(x) + " -> " + str(y))

    print("NAND")
    for x in input:
        y = NAND(x[0], x[1])
        print(str(x) + " -> " + str(y))
运行结果如下:
AND
(0, 0) -> 0
(1, 0) -> 0
(0, 1) -> 0
(1, 1) -> 1
OR
(0, 0) -> 0
(1, 0) -> 1
(0, 1) -> 1
(1, 1) -> 1
NAND
(0, 0) -> 1
(1, 0) -> 1
(0, 1) -> 1
(1, 1) -> 0
本节课作业:
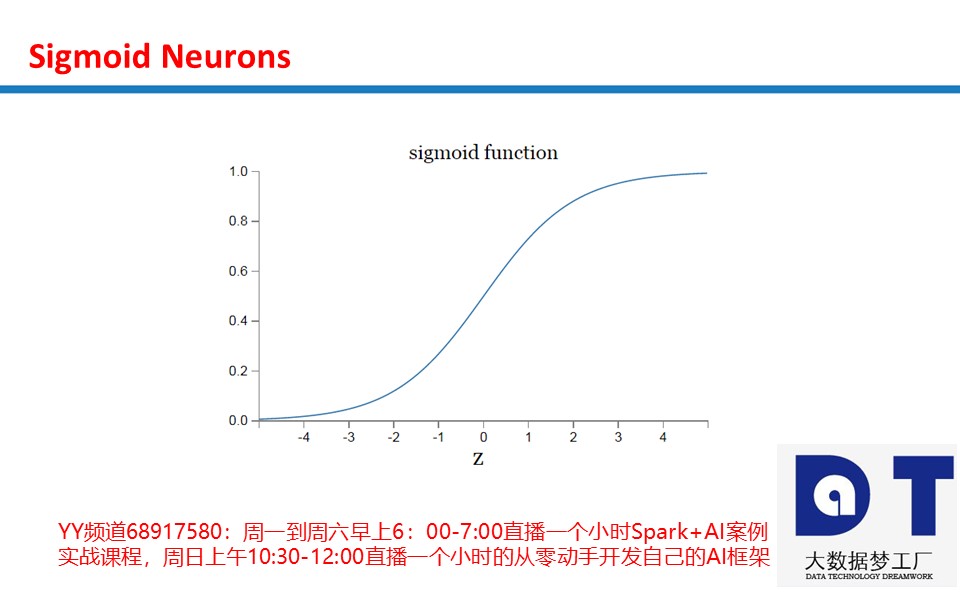
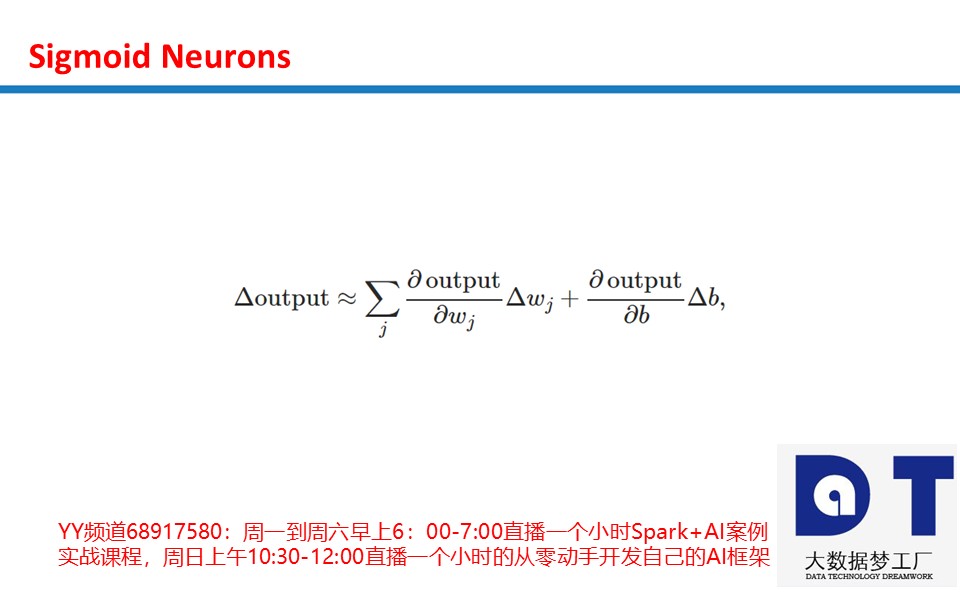
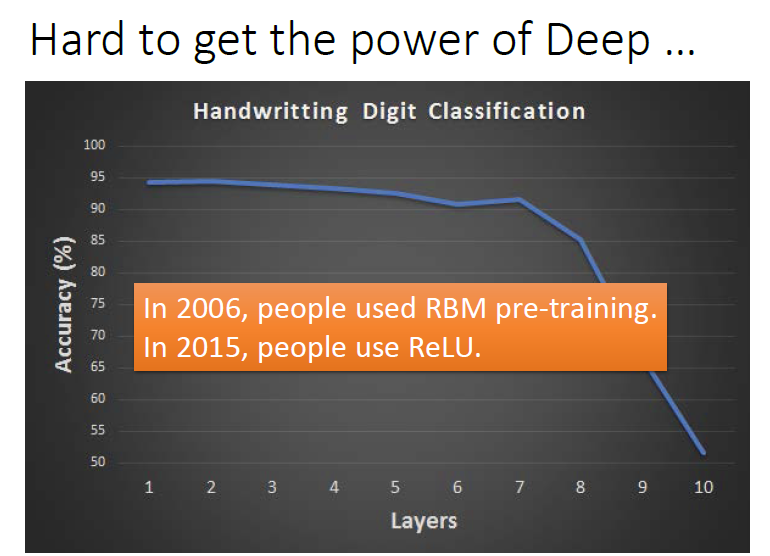
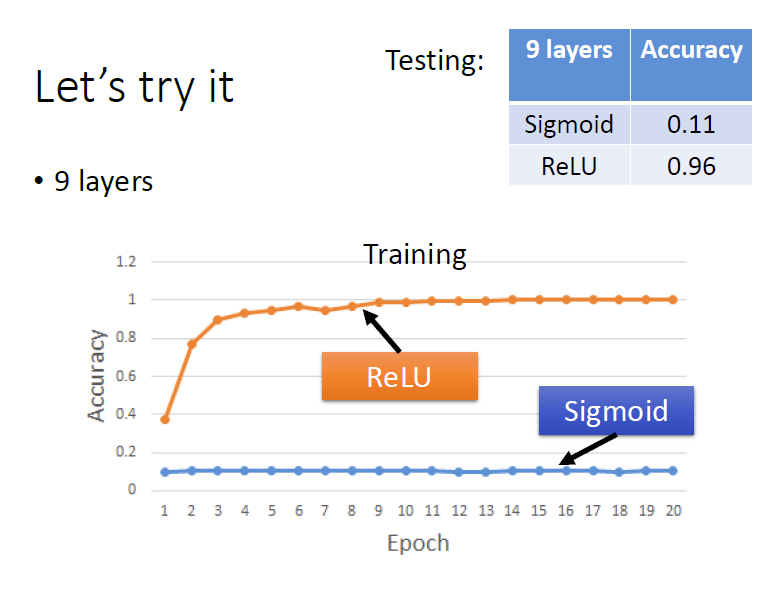
思考sigmoid function为什么需要改进?改进版本为什么克服了sigmoid function的弱点?

Sigmoid本质上是非线性的,Sigmoid函数在X值-2到2之间Y值非常陡峭。 这意味着该区域内X值的任何小的变化都会导致Y值发生显着变化。Sigmoid激活函数的输出始终在范围(0,1)内。
注意,在S型函数的任一端,Y值往往对X中的变化反应要小得多。这意味着该区域的梯度将会很小,引起了一个“梯度消失”的问题。当Sigmoid激活函数达到两侧曲线的“近水平”线时, 渐变将很小或已消失(由于极小的值,不能做出改变)。
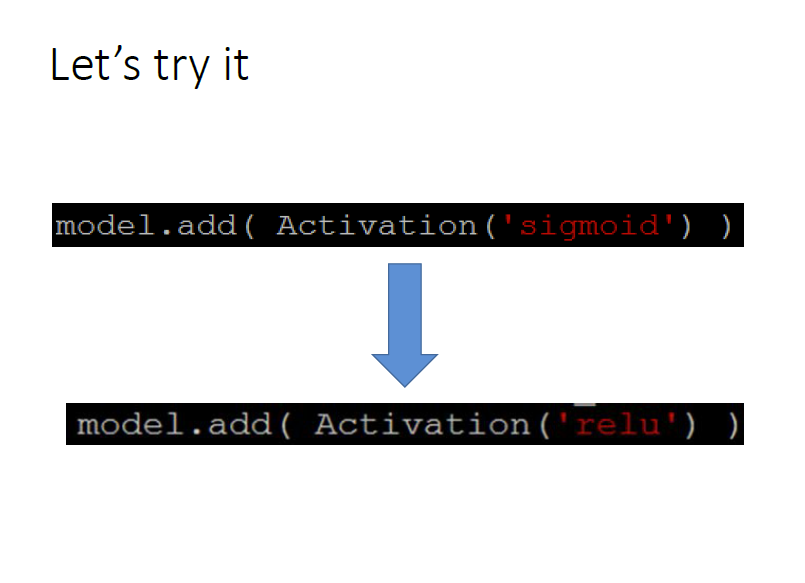
使用Relu激活函数进行改进:
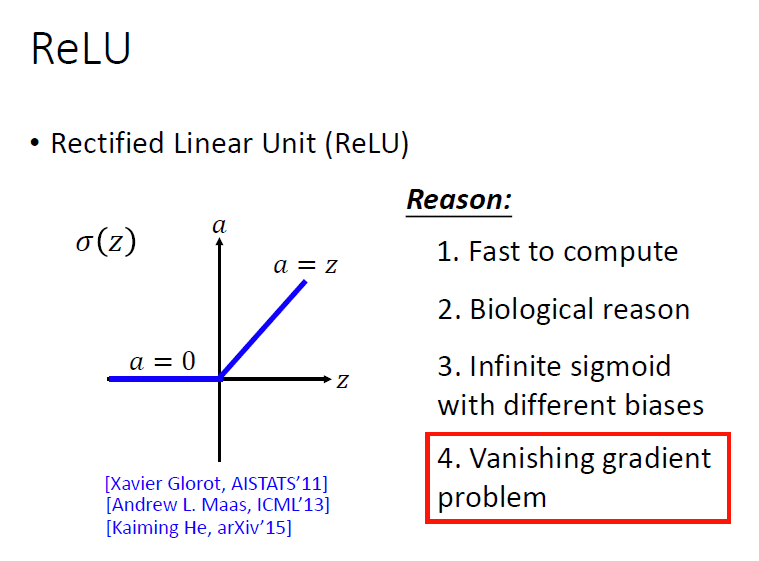
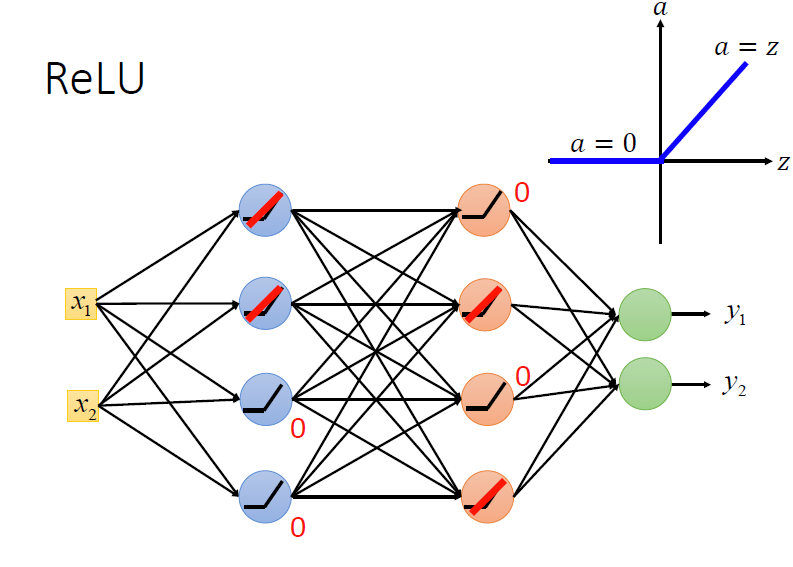

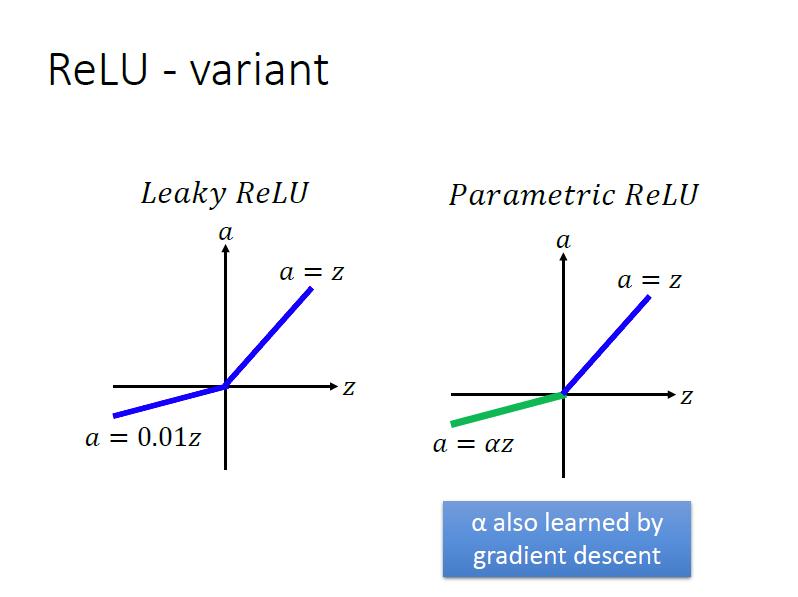


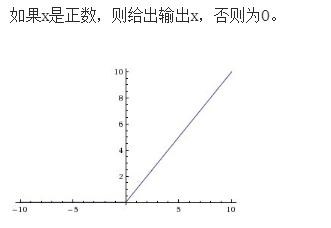
Relu激活函数
A(x)= max(0,x)
ReLu本质上是非线性的,而且ReLu的组合也是非线性的! ReLu是一个很好的逼近器,任何函数都可以用ReLu的组合来近似,ReLu的范围是[0,inf)。
Relu函数代码:
# -*- coding: utf-8 -*-

import matplotlib.pyplot as plt # For plotting.
import numpy as np # To create matrices.
def f(x):
    """ReLU returns 1 if x>0, else 0."""
    return np.maximum(0,x)

print ("f(1): ",f(1))
print ("f(3): ",f(3))
print ("f(-1): ",f(-1))
print ("f(-3): ",f(-3))

print ("Relu Function:  ")
X = np.arange(-4,5,1)
print (X)

Y = f(X)
# All negative values are 0.
print (Y)

plt.plot(X,Y,'o-')
plt.ylim(-1,5)
plt.grid()

plt.xlabel('$x$', fontsize=22)
plt.ylabel('$f(x)$', fontsize=22)
plt.figure(figsize=(7,7))

X_neg = np.arange(-4,1,1) # Negative numbers.
plt.plot(X_neg,f(X_neg),'.-', label='$f\'(x) =0$'); # Plot negative x, f(x)
X_pos = np.arange(0,5,1) # Positive numbers
plt.plot(X_pos, f(X_pos), '.-g',label='$f\'(x)=1$') # Plot positive x, f(x)
plt.plot(0,f(0),'or',label='$f \'(x)=$undefined but set to 0') # At 0.

plt.ylim(-1,5)
plt.grid()
plt.xlabel('$x$', fontsize=22)
plt.ylabel('$f(x)$', fontsize=22) # Make plot look nice.
plt.legend(loc='best', fontsize=16)
relu运行结果:
f(1):  1
f(3):  3
f(-1):  0
f(-3):  0
Relu Function:
[-4 -3 -2 -1  0  1  2  3  4]
[0 0 0 0 0 1 2 3 4]
Out[8]: <matplotlib.legend.Legend at 0x25ce8360780>

在深度学习神经元网络中代码实现sigmoid ,relu 的比较。
 # -*- coding: utf-8 -*-


import numpy as np
import matplotlib.pyplot as plt


def sigmoid(x,derive =False):
    if not derive:
        return 1 /(1+np.exp(-x))
    else:
        return x*(1-x)


def relu(x,derive =False ):
    if not derive:
        return np.maximum(0,x)
    return (x>0).astype(float)


#nonline = sigmoid
nonline = relu

X = np.array([[0,0,1],
              [0,1,1],
              [1,0,1] ,
              [1,1,1,]])


y=np.array([[0],
            [1],
            [1],
            [0]])


#weight
np.random.seed(1)


w1 = 2* np.random.random((3,4)) -1
b1 = 0.1* np.ones((4,))
w2 = 2* np.random.random((4,1)) -1
b2 = 0.1 * np.ones((1,))


adaptive_loss_log = []

training_times =6000
for i in range(training_times):
    A1 =np.dot(X,w1)+b1
    Z1=nonline(A1)


    A2 =np.dot(Z1,w2)+b2
    _y = Z2 = nonline(A2)


    cost = _y - y  # (y - _y) **2 /2

    print('Cost :{}'.format(np.mean(np.abs(cost))))
    #calc delta
    delta_A2 = cost * nonline (Z2,derive =True)
    delta_b2 = delta_A2.sum(axis =0)
    delta_w2 = np.dot(Z1.T,delta_A2)

    delta_A1 = np.dot(delta_A2,w2.T) *nonline(Z1,derive =True)
    delta_b1 = delta_A1.sum(axis =0)
    delta_w1 = np.dot(X.T,delta_A1)

    #update
    rate =  0.1
    w1 -= rate * delta_w1
    b1 -= rate * delta_b1
    w2 -= rate  * delta_w2
    b2 -= rate * delta_b2

    if i % 100 == 0:
        loss= np.mean(np.abs(cost))
        print("Epoch " + str(i), "\t", loss)
        adaptive_loss_log.append(loss)

else:
     print('Output:')
     print(_y)

plt.plot(adaptive_loss_log, label = " relu Loss Log:") #传进要进行可视化的数据集
plt.legend(bbox_to_anchor = (1,1), bbox_transform=plt.gcf().transFigure)

plt.show() #显示可视化结果
sigmoid的运行结果:

relu的运行结果

3980元团购原价19800元的AI课程,团购请加王家林老师微信13928463918
基于王家林老师独创的人工智能“项目情景投射”学习法,任何IT人员皆可在无需数学和Python语言的基础上的情况下3个月左右的时间成为AI技术实战高手:
1,五节课(分别在4月9-13号早上YY视频直播)教你从零起步(无需Python和数学基础)开发出自己的AI深度学习框架,五节课的学习可能胜过你五年的自我摸索;
2,30个真实商业案例代码中习得AI(从零起步到AI实战专家之路):10大机器学习案例、13大深度学习案例、7大增强学习案例(本文档中有案例的详细介绍和案例实现代码截图);
3,100天的涅槃蜕变,平均每天学习1个小时(周一到周六早上6:00-7:00YY频道68917580视频直播),周末复习每周的6个小时的直播课程(报名学员均可获得所有的直播视频、全部的商业案例完整代码、最具阅读价值的AI资料等)。