【2023年第十三届APMCM亚太地区大学生数学建模竞赛】A题 水果采摘机器人的图像识别
1 题目
水果采摘机器人的图像识别
中国是世界上最大的苹果生产国,年产量约为3500万吨。与此同时,中国也是世界上最大的苹果出口国,世界上每两个苹果中就有一个来自中国,全球出口的苹果中有六分之一以上来自中国。中国提出了“一带一路”倡议,这是构建人类命运共同体的重要支柱。得益于这一倡议,越南、孟加拉国、菲律宾、印度尼西亚等沿线国家已成为中国苹果的主要出口目的地。

图1 所示摘果机器人对苹果的图像识别示意图。
苹果采摘主要依靠手工采摘。苹果成熟后,几天内苹果产区就需要大量的采摘工人。但当地的农民大多在自己的果园里种苹果。此外,农业工人的老龄化和年轻人离乡打工的现象,也导致了苹果采摘季节的劳动力短缺。为了解决这一问题,中国从2011年前后开始研究能够摘苹果的机器人,并取得了重大进展。然而,由于果园环境与受控实验的不同,各种苹果采摘机器人在世界范围内的普及和应用与理想相差甚远设置。在复杂和非结构化的果园环境中,现有的大多数机器人都无法准确识别“树叶遮挡”、“树枝遮挡”、“果实遮挡”、“混合遮挡”等障碍物。如果没有根据实际场景做出精确的判断就直接采摘苹果,那么水果受损的风险很高,甚至会对采摘手和机械臂造成伤害。这对采收效率和果实品质造成不利影响,导致更大的损失。此外,对不同收获水果的识别和分类也非常重要,如分类、加工、包装、运输等程序。然而,许多水果的颜色、形状和大小与苹果非常相似,这给苹果的采收后鉴定带来了很大的困难。
本次比赛旨在通过对标记的水果图像进行特征分析和提取,建立一个识别率高、速度快、准确率高的苹果图像识别模型,并对图像进行数据分析,如自动计算图像中苹果的数量、位置、成熟度等级、质量估计等。具体任务如下:
(1)问题1:数苹果
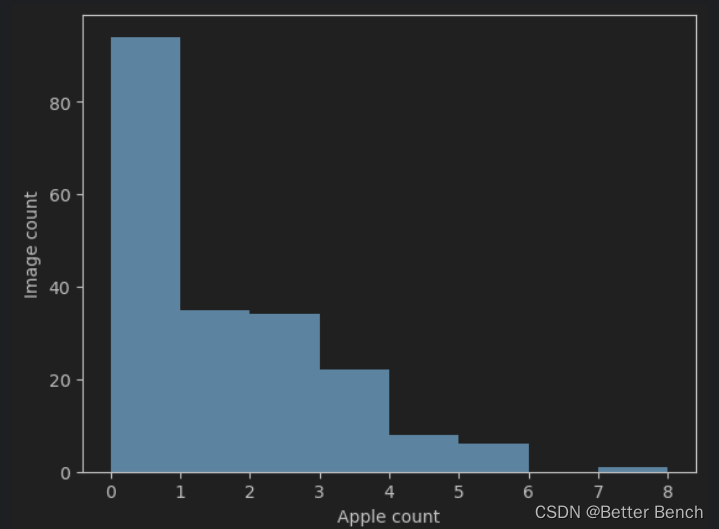
基于附件1提供的收获苹果图像数据集,提取图像特征,建立数学模型,统计每张图像中的苹果数量,绘制附件1中所有苹果分布的直方图。
(2)问题2:估计苹果的位置
根据附件1中提供的成熟苹果图像数据集,以图像左下角为坐标原点,确定每张图像中苹果的位置,绘制附件1中所有苹果几何坐标的二维散点图。
(3)问题3:估计苹果的成熟状态
基于附件1提供的成熟苹果图像数据集,建立数学模型,计算每张图像中苹果的成熟度,并绘制附件1中所有苹果成熟度分布的直方图。
(4)问题4:估计苹果的质量
基于附件1提供的成熟苹果图像数据集,计算每张图像中苹果的二维面积,图像左下角为坐标原点,估计苹果的质量,并绘制附件1中所有苹果质量分布的直方图。
(5)问题5:对苹果的识别
基于附件2提供的收获水果图像数据集,提取图像特征,训练苹果识别模型,识别附件3中的苹果,并绘制附件3中所有苹果图像的ID号分布直方图。
附件:
Attachment.zip,下载网址:https://share.weiyun.com/T6FKbjLf
附件1:
文件夹中包含200张收获苹果的图片,每张图片的大小为270 180像素。附件1的部分截图如下:

附件2:
文件夹中包含20705张已知标签和分类的不同收获水果图片,每张图片大小为270 180像素。附件2的部分截图如下:
苹果数据集:


附件3:
文件夹中包含20705张不同收获水果的图片,标签和分类未知,每张图片大小为270 180像素。附件3的部分截图如下:

2 问题分析
2.1 问题一
图像中的苹果数量较多,可以考虑使用目标检测算法进行苹果的检测和计数。常见的目标检测算法有Haar特征级联分类器、HOG(Histograms of Oriented Gradients)算法以及深度学习中的Faster R-CNN、YOLO等算法。
从图像中提取特征可能会用到的算法有边缘检测算法(如Canny算法、Sobel算法)、色彩特征提取算法(如HSV颜色空间的色调、饱和度、亮度特征提取)以及纹理特征提取算法(如Gabor滤波器)等。
2.2 问题二
由于需要确定每张图像中苹果的位置,需要将图像上的坐标转换为实际坐标。可能会用到的算法有仿射变换以及透视变换等。
2.3 问题三
图片中的苹果颜色分类,可能用到的算法有
(1)颜色空间转换与阈值分割: 首先,将图像从RGB颜色空间转换为HSV(或其它颜色空间)。然后,选择合适的阈值来分割图像,将成熟和未成熟的苹果分开。
(2)颜色特征提取: 提取图像中苹果区域的颜色特征。可以使用颜色直方图等方法来描述颜色分布情况。
(3)机器学习分类算法: 使用机器学习算法,如支持向量机(SVM)或深度学习神经网络,训练一个分类器。将提取的颜色特征作为输入,将训练好的分类器应用到新的图像上,预测苹果的成熟度。
(4)图像分割算法: 使用图像分割算法,如基于边缘检测的方法(如Canny边缘检测算法)或基于区域生长的方法,将苹果从背景中分离出来,然后进行后续的成熟度估计。
(5)深度学习目标检测算法: 使用深度学习目标检测算法,如Faster R-CNN或YOLO等,来检测和定位图像中的苹果区域,然后进行成熟度估计。
2.4 问题四
在以上两个问题的基础上
(1)轮廓检测和面积计算算法: 对分离出来的苹果轮廓进行检测和处理,并计算出其像素点的个数或计算轮廓面积,即苹果的二维面积。
(2)物理学质量计算方法: 根据苹果的密度和二维面积来计算苹果的质量。苹果的密度大约在0.6-0.8g/cm³之间。可以通过实验测量得到密度的平均值,然后根据面积和密度的关系进行计算。
2.5 问题五
分类问题,在问题一和问题二的基础上,提取特征后,训练分类模型。常用的算法:
(1)卷积神经网络 (CNN):经典的 CNN 架构,如 LeNet、AlexNet、VGG、ResNet 等。
(2)循环神经网络 (RNN):长短期记忆网络(LSTM)、门控循环单元(GRU)等。
(3)迁移学习:迁使用在大规模图像数据集上预训练的 CNN 模型(如 ImageNet 数据集)作为特征提取器,然后根据水果图像的特定数据集进行微调或添加全连接层进行新的分类。
(4)改进的深度学习算法和架构
3 Python代码实现
2.1 问题一
使用了OpenCV库来实现图像的预处理、特征提取和目标检测等操作
import cv2
import torch
import torchvision
import numpy as np
from torchvision import transforms, utils
from matplotlib import pyplot as plt

CLASS_NAMES = ['background', 'apple']
COLORS = np.random.uniform(0, 255, size=(len(CLASS_NAMES), 3))

def load_model():
    model = torchvision.models.detection.fasterrcnn_resnet50_fpn(pretrained=True)
    model.eval()
    return model

def load_and_process_image(image_path):
    image = cv2.imread(image_path)
    image = cv2.cvtColor(image, cv2.COLOR_BGR2RGB)
    transformed = transforms.Compose([
        transforms.ToTensor(),
        transforms.Resize((800, 800)),
    ])
    image = transformed(image)
    return image.unsqueeze(0)


model = load_model()

import glob
import os
def visualize(image, boxes, labels, title,i):
    image = image.permute(1, 2, 0).numpy()
    fig = plt.figure(figsize=(8, 8))
    plt.imshow(image)
    ax = plt.gca()
    for i in range(len(boxes)):
        xmin, ymin, xmax, ymax = boxes[i]
        color = 'r'
        rect = plt.Rectangle((xmin, ymin), xmax - xmin, ymax - ymin, fill=False, edgecolor=color, linewidth=2)
        ax.add_patch(rect)
        text = '{:.2f}'.format(scores[i])
        plt.text(xmin, ymin-5, text, fontsize=8, bbox=dict(facecolor=color, alpha=0.5, pad=1), color='white')
    plt.axis('off')
    plt.title(title)
    plt.savefig('img/Q1_{}.png'.format(i),dpi=100)
    plt.show()

# 循环读取图片
image_paths = sorted(glob.glob(os.path.join('Attachment/Attachment 1', '*.jpg')))
i=0
test = []
count_list = []
for image_path in image_paths:
    image = load_and_process_image(image_path)
    det_pred = model(image)
    boxes = det_pred[0]['boxes'].detach().numpy()
    scores = det_pred[0]['scores'].detach().numpy()
    labels = det_pred[0]['labels'].detach().numpy()

    threshold = 0.5
    idx = scores > threshold
    boxes = boxes[idx]
    scores = scores[idx]
    labels = labels[idx]

    num_apples = len(boxes)
    count_list.append(num_apples)
    print('第{}张图片中苹果的数量为{}个'.format(i, num_apples))
    apple_locs = []
    for j in range(num_apples):
        xmin, ymin, xmax, ymax = boxes[j]
        apple_loc = (xmin, ymin, xmax, ymax)
        apple_locs.append(apple_loc)
    if i <= 3:
        visualize(image[0], boxes, labels, 'Image {}'.format(i),i)
    i+=1
# 绘制直方图
plt.hist(count_list, bins=range(max(count_list) + 2))
plt.xlabel("Apple count")
plt.ylabel("Image count")
plt.savefig('img/Q_苹果数量分布.png',dpi=300)
plt.show()
每张图像中苹果的数量: [2, 0, 0, 0, 0, 1, 1, 0, 0, 3, 0, 1, 3, 0, 0, 1, 0, 1, 3, 0, 0, 0, 5, 0, 0, 2, 0, 0, 2, 0, 3, 0, 0, 0, 2, 3, 0, 1, 0, 0, 0, 3, 0, 2, 2, 0, 2, 0, 0, 0, 1, 0, 0, 2, 0, 0, 1, 0, 0, 0, 0, 0, 0, 1, 0, 1, 2, 1, 2, 3, 4, 1, 5, 0, 3, 0, 1, 0, 0, 0, 0, 2, 2, 1, 1, 4, 1, 3, 0, 2, 4, 0, 3, 1, 0, 1, 2, 2, 0, 4, 1, 4, 3, 0, 0, 0, 1, 2, 3, 0, 0, 0, 2, 2, 1, 0, 1, 3, 2, 3, 1, 1, 1, 2, 0, 0, 0, 3, 0, 3, 5, 0, 5, 0, 4, 3, 0, 4, 0, 0, 0, 0, 0, 2, 3, 2, 0, 1, 0, 1, 3, 1, 2, 0, 0, 1, 3, 0, 0, 0, 5, 1, 1, 0, 0, 2, 2, 2, 2, 5, 0, 2, 0, 3, 1, 0, 1, 0, 1, 0, 1, 0, 0, 2, 0, 3, 7, 0, 2, 4, 0, 0, 2, 0, 0, 0, 2, 0, 2, 2]


2.2 问题二
列表apple_locs_all,用于存储所有图像中苹果的位置信息。在每个图像的处理中,在确定每个苹果的位置时将其添加到apple_locs_all中。在处理完所有图像后,绘制apple_locs_all中所有苹果位置信息的散点图。具体方法是根据坐标数据分别将x、y值组成两个列表,然后使用Matplotlib中的scatter函数进行绘制。
import cv2
import torch
import torchvision
import numpy as np
from torchvision import transforms, utils
from matplotlib import pyplot as plt
import glob
import os

CLASS_NAMES = ['background', 'apple']
COLORS = np.random.uniform(0, 255, size=(len(CLASS_NAMES), 3))

def load_model():
    model = torchvision.models.detection.fasterrcnn_resnet50_fpn(pretrained=True)
    model.eval()
    return model

def load_and_process_image(image_path):
    image = cv2.imread(image_path)
    image = cv2.cvtColor(image, cv2.COLOR_BGR2RGB)
    transformed = transforms.Compose([
        transforms.ToTensor(),
        transforms.Resize((800, 800)),
    ])
    image = transformed(image)
    return image.unsqueeze(0)

def visualize(image, boxes, labels, title,i):
    image = image.permute(1, 2, 0).numpy()
    fig = plt.figure(figsize=(8, 8))
    plt.imshow(image)
    ax = plt.gca()
    for i in range(len(boxes)):
        xmin, ymin, xmax, ymax = boxes[i]
        color = 'r'
        rect = plt.Rectangle((xmin, ymin), xmax - xmin, ymax - ymin, fill=False, edgecolor=color, linewidth=2)
        ax.add_patch(rect)
        text = '{:.2f}'.format(scores[i])
        plt.text(xmin, ymin-5, text, fontsize=8, bbox=dict(facecolor=color, alpha=0.5, pad=1), color='white')
    plt.axis('off')
    plt.title(title)
    plt.savefig('img/Q1_{}.png'.format(i),dpi=100)
    plt.show()

model = load_model()
# 循环读取图片
image_paths = sorted(glob.glob(os.path.join('Attachment/Attachment 1', '*.jpg')))
i=0
test = []
count_list = []
apple_locs_all = []  # 存储所有苹果的位置
for image_path in image_paths:
    image = load_and_process_image(image_path)
    det_pred = model(image)
    boxes = det_pred[0]['boxes'].detach().numpy()
    scores = det_pred[0]['scores'].detach().numpy()
    labels = det_pred[0]['labels'].detach().numpy()

    threshold = 0.5
    idx = scores > threshold
    boxes = boxes[idx]
    scores = scores[idx]
    labels = labels[idx]

    num_apples = len(boxes)
    count_list.append(num_apples)
    print('第{}张图片中苹果的数量为{}个'.format(i, num_apples))
    apple_locs = []
    for j in range(num_apples):
        xmin, ymin, xmax, ymax = boxes[j]
        # 转换坐标原点到左下角
        ymin = image.shape[1] - ymax
        ymax = image.shape[1] - ymin
        apple_loc = (xmin, ymin, xmax, ymax)
        apple_locs.append(apple_loc)
        apple_locs_all.append(apple_loc)
    # 只可视化前4张图片
    # if i <= 3:
        # visualize(image[0], boxes, labels, 'Image {}'.format(i),i)
    i += 1

# 绘制所有苹果的散点图
x = [loc[0] for loc in apple_locs_all]
y = [loc[1] for loc in apple_locs_all]
fig, ax = plt.subplots()
ax.scatter(x, y)
ax.set_xlabel('x')
ax.set_ylabel('y')
plt.title('All Apples in Dataset')
plt.savefig('img/Q1_all_apples.png')
plt.show()

2.3 问题三
在问题一和问题二的基础上,获取苹果位置,并截取苹果部分的图片
将图片转换为HSV色彩空间,然后根据苹果在该色彩空间中的颜色范围,将苹果分为成熟和未成熟两类。
import cv2
import torch
import torchvision
import numpy as np
from torchvision import transforms, utils
from matplotlib import pyplot as plt
import glob
import os
def load_model():
    model = torchvision.models.detection.fasterrcnn_resnet50_fpn(pretrained=True)
    model.eval()
    return model

def load_and_process_image(image_path):
    image = cv2.imread(image_path)
    image = cv2.cvtColor(image, cv2.COLOR_BGR2RGB)
    transformed = transforms.Compose([
        transforms.ToTensor(),
        transforms.Resize((800, 800)),
    ])
    image = transformed(image)
    return image.unsqueeze(0)


def plot_ripeness_distribution(labels):
    # 统计成熟和未成熟苹果的数量
    num_ripe = labels.count(1)
    num_unripe = labels.count(0)
    num_total = num_ripe + num_unripe

    # 绘制成熟度分布的直方图
    fig, ax = plt.subplots()
    ax.bar([0, 1], [num_unripe, num_ripe], color=['g', 'r'])
    ax.set_xlim(-0.5, 1.5)
    ax.set_xticks([0, 1])
    ax.set_xticklabels(['Unripe', 'Ripe'])
    ax.set_xlabel('Ripeness')
    ax.set_ylabel('Count')
    plt.title('Ripeness Distribution of {} Apples'.format(num_total))
    plt.savefig('img/Q1_ripeness_distribution.png')
    plt.show()

def calculate_apple_ripeness(image, boxes, scores):
    ...请下载完整资料
    return apple_labels

def visualize(image, boxes, scores, title, i, apple_labels=None):
    image = image.permute(1, 2, 0).numpy()
    fig = plt.figure(figsize=(8, 8))
    plt.imshow(image)
    ax = plt.gca()
    if apple_labels is not None:
        for j in range(len(apple_labels)):
            xmin, ymin, xmax, ymax = boxes[j]
            color = 'g' if apple_labels[j] == 0 else 'r'
            rect = plt.Rectangle((xmin, ymin), xmax - xmin, ymax - ymin, fill=False, edgecolor=color, linewidth=2)
            ax.add_patch(rect)
    else:
        for j in range(len(boxes)):
            xmin, ymin, xmax, ymax = boxes[j]
            color = 'r'
            rect = plt.Rectangle((xmin, ymin), xmax - xmin, ymax - ymin, fill=False, edgecolor=color, linewidth=2)
            ax.add_patch(rect)
            text = '{:.2f}'.format(scores[j])
            plt.text(xmin, ymin-5, text, fontsize=8, bbox=dict(facecolor=color, alpha=0.5, pad=1), color='white')
    plt.axis('off')
    plt.title(title)
    plt.savefig('img/Q3_{}.png'.format(i),dpi=100)
    plt.show()

model = load_model()
# 循环读取图片
image_paths = sorted(glob.glob(os.path.join('Attachment/test', '*.jpg')))
i = 0
test = []
count_list = []
apple_locs_all = []  # 存储所有苹果的位置
apple_labels_all = []  # 存储所有苹果标签
for image_path in image_paths:
    image = load_and_process_image(image_path)
    det_pred = model(image)
    boxes = det_pred[0]['boxes'].detach().numpy()
    scores = det_pred[0]['scores'].detach().numpy()
    labels = det_pred[0]['labels'].detach().numpy()

    threshold = 0.5
    idx = scores > threshold
    boxes = boxes[idx]
    scores = scores[idx]
    labels = labels[idx]

    num_apples = len(boxes)
    count_list.append(num_apples)
    print('第{}张图片中苹果的数量为{}个'.format(i, num_apples))
    apple_locs = []
    if num_apples > 0:
        apple_labels = calculate_apple_ripeness(image[0].numpy().astype(np.uint8), boxes, scores)
        # apple_labels = calculate_apple_ripeness(image.numpy(), boxes, scores)
        apple_labels_all.extend(apple_labels)
        for j in range(num_apples):
            xmin, ymin, xmax, ymax = boxes[j]
            # 转换坐标原点到左下角
            ymin = image.shape[2] - ymax
            ymax = image.shape[2] - ymin
            apple_loc = (xmin, ymin, xmax, ymax)
            apple_locs.append(apple_loc)
            apple_locs_all.append(apple_loc)
        visualize(image[0], boxes, scores, 'Image {}'.format(i), i, apple_labels=apple_labels)
    else:
        visualize(image[0], [], [], 'Image {}'.format(i), i)
        apple_labels_all.extend([])
    i += 1

# 绘制苹果成熟度分布直方图
plot_ripeness_distribution(apple_labels_all)

2.4 问题四

2.5 问题五
请下载完整资料,请加我扣扣