目录
调试:vconsole vs dev tools中的控制台(Console)
style-loader:创建style标签,将js中的样式资源插入标签内,并将标签添加到head中生效
html-webpack-plugin :处理html资源,默认会创建一个空的HTML,自动引入打包输出的所有资源(js/css)
mini-css-extract-plugin: 打包过后的css在js文件里,该插件可以把css单独抽出来
clean-webpack-plugin :每次打包时候,CleanWebpackPlugin 插件就会自动把上一次打的包删除
loader和plugin的区别:loader运行在编译阶段,plugins 在整个周期都起作用
transfrom :对源文件内容做转换,即 ts -> js, less -> css 等。转换完成的内容可以直接返回给浏览器了。
parser: 对转换以后的内容做分析,找到依赖模块,对依赖模块做预转换 - pre transform 操作,即重复 1 - 4。
ListChart(列表切换echarts图表,同类数据为x轴的bar)
移动端需要考虑:轻量级,单位
类似参考链接:搭建一个vue-cli4+webpack移动端框架(开箱即用) - 掘金
组件库
移动端
vue
vant
PC端
react
antd
vue
element
调试:vconsole vs dev tools中的控制台(Console)
vconsole:在真机上调试
浏览器中显示log和调试信息的 JS 库
npm install vconsole
import VConsole from 'vconsole';
if (import.meta.env.MODE === 'development') {
const vConsole = new VConsole();
Vue.prototype.vconsole = vConsole //把这个方法放到vue原型上,方便在页面中调用
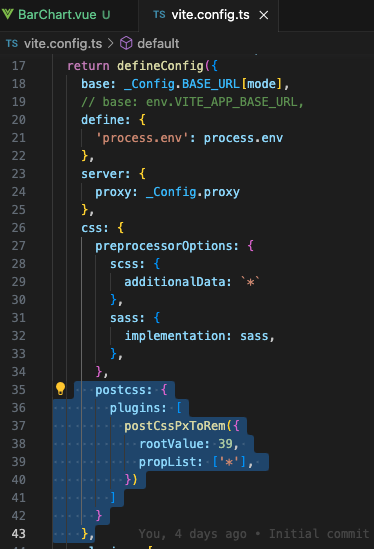
}postcss-pxtorem:移动端不同的像素密度
yarn add postcss-pxtorem
构建工具
ctrl+c终止运行(webpack需要重启,vite不需要)
webpack
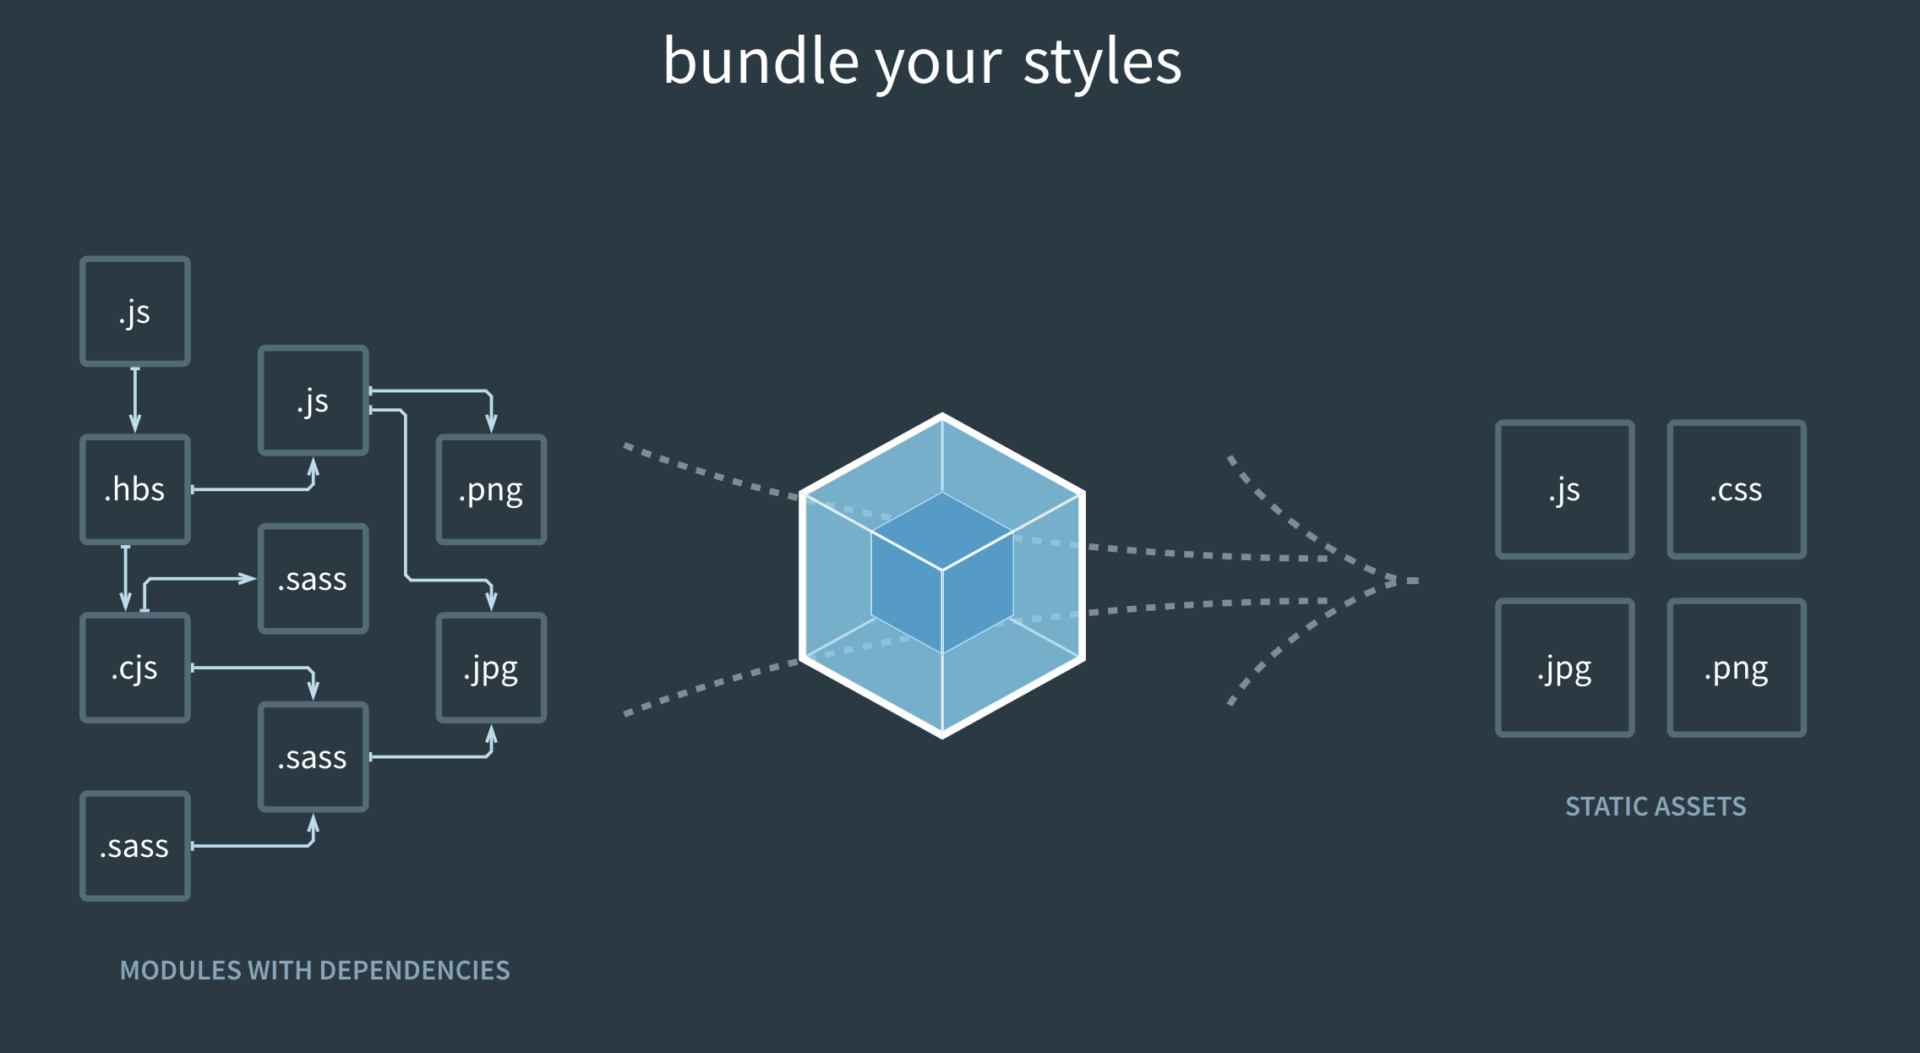
它将根据模块的依赖关系进行静态分析,然后将这些模块( js、css、less )按照指定的规则生成对应的静态资源,减少了页面的请求。Webpack是以公共JS的形式来书写脚本的,方便旧项目进行代码迁移。
原理
Webpack通过一个给定的主文件(如:index.js)开始找到项目的所有依赖文件,
使用loaders处理它们,plugin可以压缩代码和图片,
把所有依赖打包成一个 或多个bundle.js文件(捆bundle)浏览器可识别的JavaScript文件。
Babel:JS编译器(es6->es5,jsx->js)
将es6、es7、es8等语法转换成浏览器可识别的es5或es3语法,即浏览器兼容的语法,比如将箭头函数转换为普通函数
将jsx转换成浏览器认的js
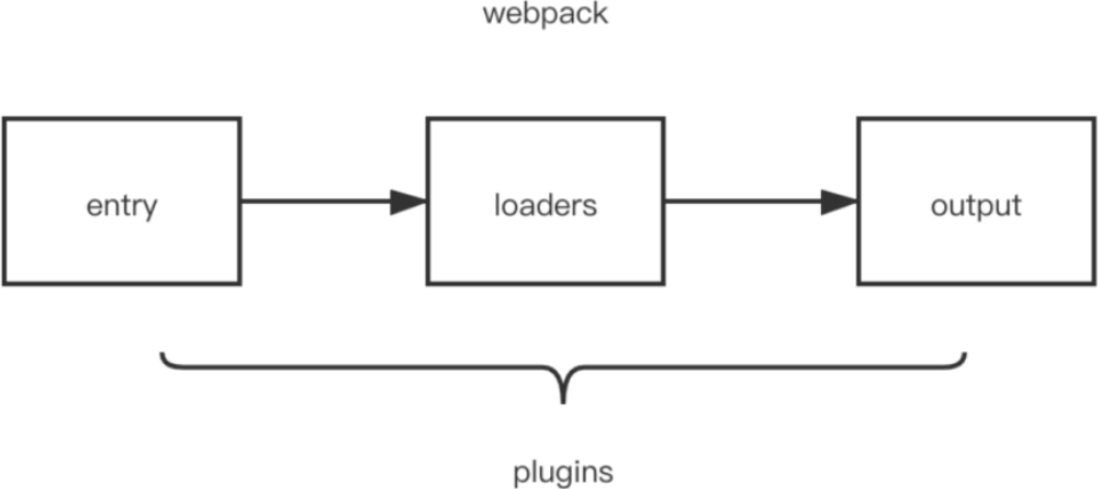
loader:编译
webpack只认识JS和JSON,所以Loader相当于翻译官,将其他类型资源进行预处理,最终变为js代码。
less-loader:less->css
开发中,会使用less预处理器编写css样式,使开发效率提高)
css-loader:css->js
将css文件变成commonjs模块(模块化的规范)加载到js中,模块内容是样式字符串
style-loader:创建style标签,将js中的样式资源插入标签内,并将标签添加到head中生效
ts-loader:打包编译Typescript文件
plugin:压缩
Plugin解决loader 无法实现的事情,比如打包优化和代码压缩等。
html-webpack-plugin :处理html资源,默认会创建一个空的HTML,自动引入打包输出的所有资源(js/css)
mini-css-extract-plugin: 打包过后的css在js文件里,该插件可以把css单独抽出来
clean-webpack-plugin :每次打包时候,CleanWebpackPlugin 插件就会自动把上一次打的包删除
loader和plugin的区别:loader运行在编译阶段,plugins 在整个周期都起作用
热加载原理:实时看到代码变化
热加载是通过内置的 HotModuleReplacementPlugin 实现的
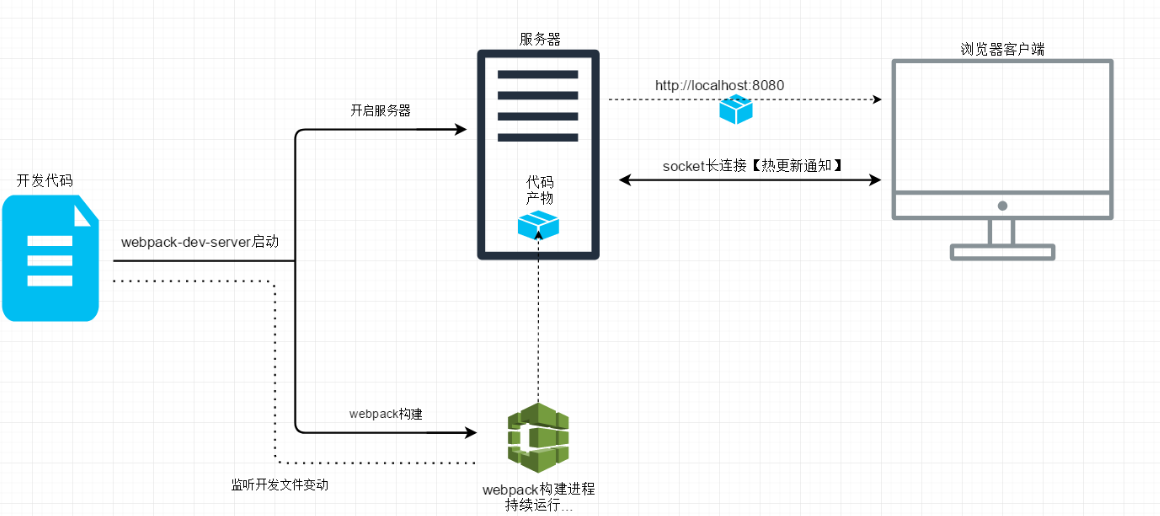
- 构建 bundle 的时候,监听文件变化。
- 文件修改会触发 webpack 重新构建,
- 服务器通过向浏览器发送更新消息,
- 浏览器通过 jsonp 拉取更新的模块文件,
- jsonp 回调触发模块热替换逻辑。
vite(快,简,小)
源文件的处理
resolve :解析 url,找到源文件的绝对路径;
load :加载源文件。
第三方依赖:直接将预构建内容返回给浏览器;
业务代码:继续 transform、parser。
transfrom :对源文件内容做转换,即 ts -> js, less -> css 等。转换完成的内容可以直接返回给浏览器了。
parser: 对转换以后的内容做分析,找到依赖模块,对依赖模块做预转换 - pre transform 操作,即重复 1 - 4。
pre transform 是 Vite 做的一个优化点。预转换的内容会先做缓存,等浏览器发起请求以后,如果已经完成转换,直接将缓存的内容返回给浏览器。
快:启动/热更新
ESM+unbundle
(ES modules 是 JavaScript 官方的标准化模块系统。)
vite源文件之间的依赖通过浏览器对 ESM 规范的支持来解析,不再需要额外打包处理。
请求模块时按需动态编译显示
webpack启动慢主要是因为模块依赖图 - module graph
构建 module graph 的过程中,涉及到大量的文件 IO、文件 transfrom、文件 parse 操作;
分解 module graph 的过程中,需要遍历 module graph、文件 transform、文件 IO
性能下降:大量http请求,按需动态编译
首屏
- 不对源文件做合并捆绑操作,导致大量的
http请求 dev server运行期间对源文件做resolve、load、transform、parse操作- 预构建、二次预构建操作也会阻塞首屏请求,直到预构建完成为止
Vite把需要在启动过程中完成的工作,转移到响应浏览器请求的过程中
之后reload页面时,首屏的性能会好很多(缓存)
懒加载
动态加载的文件,需要做 resolve、load、transform、parse 操作,并且还有大量的 http请求
可视化引擎
- 体量:Echarts支持按需引用
- 灵活度:ECharts<G2<D3
- 使用难度:Echart≈G2PLot<G2<D3
- 场景:画三维图用Three,三维地图AntV的L7|L7Plot也可以做到,画二维图用ECharts或者G2、G2Plot均可
移动端
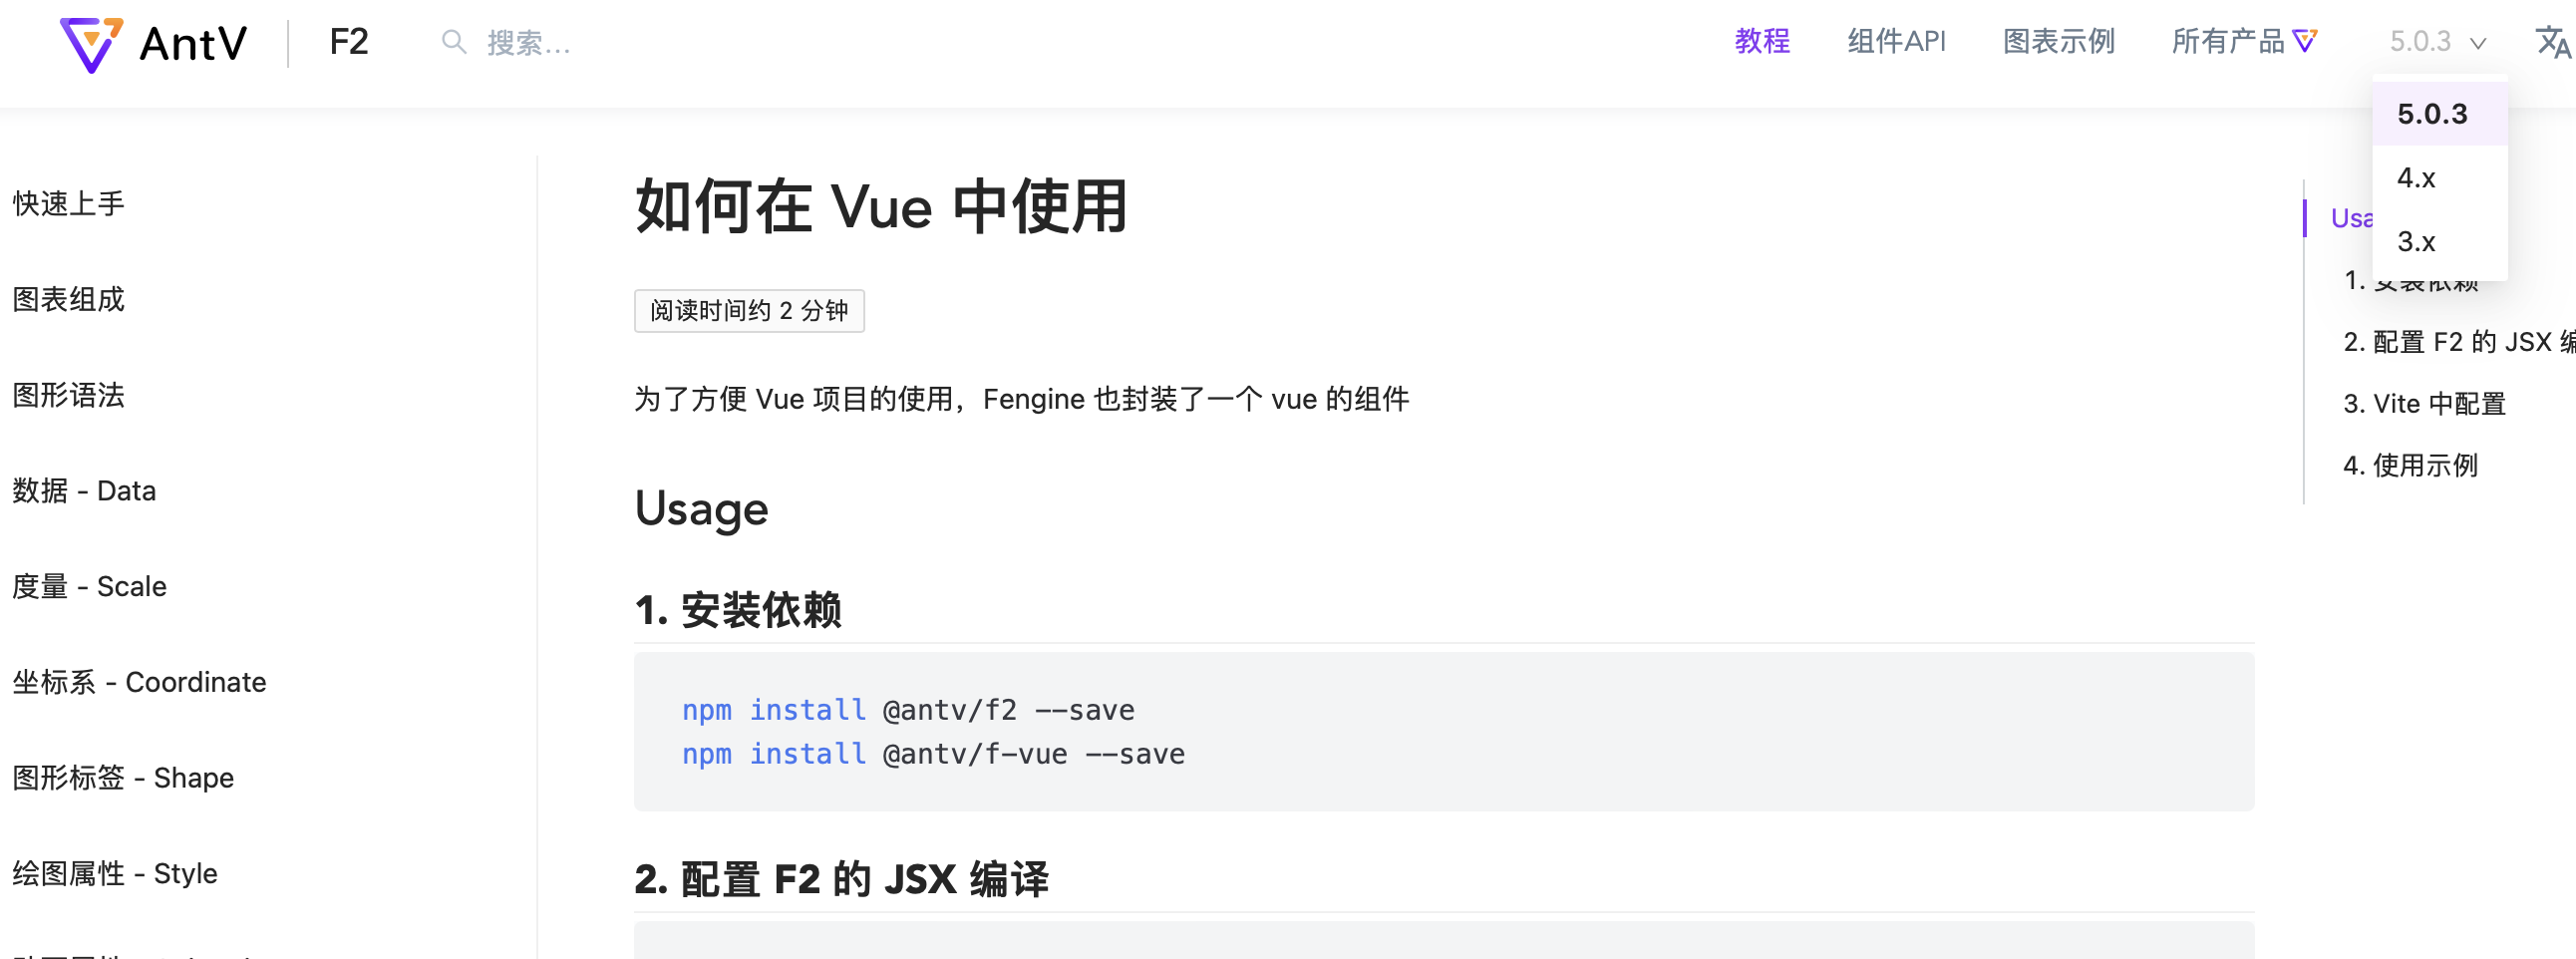
antv f2
移动端使用antv f2
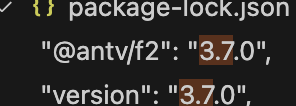
yarn add @antv/f2
yarn add @antv/f-vue
npm install @antv/f2 --save
npm install @antv/f-vue --save
//配置 F2 的 JSX 编译
npm install @babel/plugin-transform-react-jsx --save-dev
版本问题
目前vue+vite/webpack(antv 4/5版本)都无法配置成功,因为找不到实例方法,改成3.x版本即可

jsx
F2 使用 JSX 语法来构建图表,所以需要在运行前对 JSX 语法进行编译, JSX 更多细节可参考 React 的官方文档 JSX 简介
Babel 和 TypeScript 都可以编译 JSX 语法,并且在编译时 JSX 语法时,会有 2 种编译模式,在实际项目中可根据自己实际情况选择和使用
经典配置
如果希望在 Vue 3 组件中使用普通的 JSX 语法,可以选择经典的配置方式。这种情况下,需要设置 jsxFactory 和 jsxFragmentFactory 选项。以下是示例的 tsconfig.json 文件:
{
  "compilerOptions": {
    "jsx": "preserve", // 保留 JSX 语法
    "jsxFactory": "jsx", // 指定 JSX 的工厂函数
    "jsxFragmentFactory": "Fragment" // 指定 JSX 片段的工厂函数
  }
}
在这种配置下,需要确保的 Vue 组件中使用的 JSX 工厂函数和片段工厂函数与你在配置中指定的名称相匹配。
自动配置
如果想要使用自动化的 JSX 语法,可以使用 jsx 和 jsxImportSource 选项。这种情况下,可以将 AntV F2 的组件库作为 JSX 的导入来源。以下是示例的 tsconfig.json 文件:
{
  "compilerOptions": {
    "jsx": "react-jsx", // 使用 React 的 JSX 语法
    "jsxImportSource": "@antv/f2" // 指定 JSX 的导入来源
  }
}
在这种配置下,可以在 Vue 组件中使用类似 React 的 JSX 语法,不过需要确保在组件中导入了所需的 AntV F2 组件。
选择哪种配置取决于你更喜欢的语法和使用方式。如果使用经典配置,可以继续使用普通的 JSX 语法;如果使用自动配置,可以借助 AntV F2 提供的 JSX 语法来创建图表组件。
vue
vue 默认是不支持直接在组件的 <script> 中使用 JSX 语法的。
如果你不想使用 JSX,你可以将组件的 <script> 部分改为使用 Vue 的选项式 API 或 Composition API (<script setup>)来定义组件逻辑(响应式函数和钩子函数)
使用

bar
<script setup lang="ts">
import { onMounted } from 'vue'

import * as F2 from '@antv/f2'

const data: any = [
  { genre: 'Sports', sold: 275 },
  { genre: 'Strategy', sold: 115 },
  { genre: 'Action', sold: 120 },
  { genre: 'Shooter', sold: 350 },
  { genre: 'Other', sold: 150 }
]

onMounted(() => {
  setTimeout(() => {
    drawChart()
  }, 1000)
})

function drawChart() {
    // Step 1: 创建 Chart 对象
    const chart = new F2.Chart({
      id: 'container',
      pixelRatio: window.devicePixelRatio // 指定分辨率
    })
    console.log(chart, '---chart')

    // Step 2: 载入数据源
    console.log(data, '---data')
    chart.source(data)

    // Step 3:创建图形语法,绘制柱状图,由 genre 和 sold 两个属性决定图形位置,genre 映射至 x 轴,sold 映射至 y 轴
    chart.interval().position('genre*sold').color('genre')

    // Step 4: 渲染图表
    chart.render()
  }

</script>

<template>
  <div class="demo">
    <div style="width: 100%; height: 300px">
      <canvas id="container" style="width: 100%; height: 100%"></canvas>
    </div>
  </div>
</template>

<style lang="scss" scoped>
.demo {
  text-align: center;
  .logo {
    height: 6em;
    padding: 1.5em;
    will-change: filter;
    transition: filter 300ms;
  }
  .logo:hover {
    filter: drop-shadow(0 0 2em #646cffaa);
  }
}
</style>
radar
<script setup lang="ts">
import { onMounted } from 'vue'

import F2 from '@antv/f2'
import _ from 'lodash'

const data = [
  {
    item: 'Design',
    user: '用户 A',
    score: 70,
  },
  {
    item: 'Design',
    user: '用户 B',
    score: 30,
  },
  {
    item: 'Development',
    user: '用户 A',
    score: 60,
  },
  {
    item: 'Development',
    user: '用户 B',
    score: 70,
  },
  {
    item: 'Marketing',
    user: '用户 A',
    score: 50,
  },
  {
    item: 'Marketing',
    user: '用户 B',
    score: 60,
  },
  {
    item: 'Users',
    user: '用户 A',
    score: 40,
  },
  {
    item: 'Users',
    user: '用户 B',
    score: 50,
  },
  {
    item: 'Test',
    user: '用户 A',
    score: 60,
  },
  {
    item: 'Test',
    user: '用户 B',
    score: 70,
  },
  {
    item: 'Language',
    user: '用户 A',
    score: 70,
  },
  {
    item: 'Language',
    user: '用户 B',
    score: 50,
  },
  {
    item: 'Technology',
    user: '用户 A',
    score: 70,
  },
  {
    item: 'Technology',
    user: '用户 B',
    score: 40,
  },
  {
    item: 'Support',
    user: '用户 A',
    score: 60,
  },
  {
    item: 'Support',
    user: '用户 B',
    score: 40,
  },
];

onMounted(() => {
  setTimeout(() => {
    drawChart();
  }, 1000);
});

function drawChart() {
  const chart: F2.Chart<F2.DataRecord> = (new F2.Chart({
    id: 'RadarChart',
    pixelRatio: window.devicePixelRatio,
  })) || null;

  chart.coord('polar');
  chart.source(data, {
    score: {
      min: 0,
      max: 120,
      nice: false,
      tickCount: 4,
    },
  });
  chart.axis('score', {
    label: function label(index, total) {
      if (index === total - 1) {
        return null;
      }
      return {
        top: true,
      };
    },
    grid: function grid(text) {
      if (text === '120') {
        return {
          lineDash: null,
        };
      }
    },
    line: {
      top: false,
    },
  });
  chart
    .area()
    .position('item*score')
    .color('user')
    .animate({
      appear: {
        animation: 'groupWaveIn',
      },
    });
  chart
    .line()
    .position('item*score')
    .color('user')
    .animate({
      appear: {
        animation: 'groupWaveIn',
      },
    });
  chart
    .point()
    .position('item*score')
    .color('user')
    .style({
      stroke: '#fff',
      lineWidth: 1,
    })
    .animate({
      appear: {
        delay: 300,
      },
    });

  chart.render();
}
</script>

<template>
  <div class="demo">
    <div style="width: 100%; height: 300px">
      <canvas id="RadarChart" style="width: 100%; height: 100%"></canvas>
    </div>
  </div>
</template>

<style lang="scss" scoped>
.demo {
  text-align: center
}
</style>
PC端
antv
antv G6
antv/g6是一款基于JavaScript的图形可视化引擎,由阿里巴巴的AntV团队开发。
创建各种类型的图形,如流程图、关系图、树形图等。
G6采用了自己的绘图模型和渲染引擎,使其具备高性能的图形渲染能力。
它支持SVG和Canvas两种渲染方式,并且可以在Web和移动端应用中使用。
Vue2


注册自定义节点、注册行为
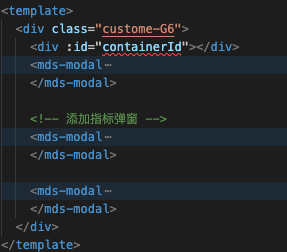
<template>
<div class="custome-G6">
<div :id="containerId"></div>
<mds-modal class="custome-G6-modal" :visibility.sync="moreModal.visibility" title="选择操作" width="300px" :mask="true"
:footer="false" :showClose="true">
<div class="more-content">
<mds-button v-if="currentModel && currentModel.type !== 'node-root'" ghost type="primary"
@click="editNode">修改指标名称</mds-button>
<mds-button v-if="currentModel && currentModel.indexFlag === 1" ghost type="primary"
@click="addNode('sub')">添加下级指标</mds-button>
<mds-button v-if="currentModel && currentModel.indexFlag === 1" ghost type="primary"
@click="addNode('leaf')">添加底层指标</mds-button>
<mds-button v-if="currentModel && currentModel.type !== 'node-root'" ghost type="danger"
@click="handleDeleteNode">删除指标</mds-button>
</div>
</mds-modal>
<!-- 添加指标弹窗 -->
<mds-modal class="custome-G6-modal" :visibility.sync="addModal.visibility" :title="addModal.title" width="300px"
:mask="false" :showClose="true" okText="确定" @ok="handleAddNode" @close="handleClose">
<div style="height: 100px">
<template v-if="addModal.nodeType === 'leaf'">
<mds-select v-model="addModal.leaf" value-key="id" placeholder="请选择" filterable @change="changeLeaf">
<mds-option v-for="item in quaryScoreIndexList" :key="item.id" :value="item"
:label="item.indexNm"></mds-option>
</mds-select>
<div class="tip-text">请选择1个底层指标</div>
</template>
<template v-else>
<mds-input v-model="addModal.content.indexName" :maxlength="30"></mds-input>
<div class="tip-text">请填写下级指标名称,不超过30字</div>
</template>
</div>
</mds-modal>
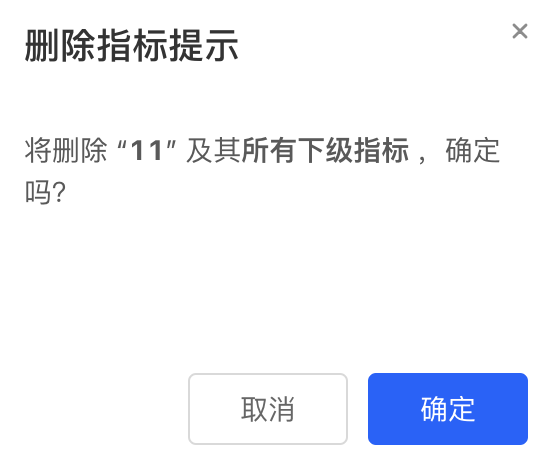
<mds-modal class="custome-G6-modal" :visibility.sync="deleteModal.visibility" title="删除指标提示" width="300px"
:mask="false" :showClose="true" okText="确定" @ok="deleteNode" @close="closeDelete">
<div style="height: 100px">
<div>将删除 “<span style="font-weight:bold">{
{ currentModel && currentModel.indexName }}</span>”
<template v-if="currentModel && currentModel.type === 'node-sub'">及其<span
style="font-weight:bold">所有下级指标</span></template>
,确定吗?
</div>
</div>
</mds-modal>
</div>
</template>
<script lang="ts">
import { Component, Vue, Prop, Watch, Emit } from 'vue-property-decorator'
import G6 from '@antv/g6'
@Component({
components: {}
})
export default class CustomeG6 extends Vue {
@Prop({ required: true }) private containerId!: string
@Prop({ required: true }) private indexContent!: any
@Prop({ required: true }) private quaryScoreIndexList!: any
@Prop({ required: true }) private disabled!: boolean
// 更新根节点名称
@Watch('indexContent.indexName', { deep: true })
changeIndexName(val: any, old: any) {
// 获取树的根节点
let rootNode = this.tree.getNodes()[0];
// 更新根节点的索引名为新的值
this.tree.updateItem(rootNode, { indexName: val });
// 渲染更新后的树
this.tree.render();
}
private tree: any
private moreModal: any = {
visibility: false
}
private addModal: any = {
visibility: false,
title: '添加下级指标',
leaf: '',
content: {
indexName: '',
indexCode: null
},
nodeType: 'leaf',
opType: 'add'
}
private deleteModal: any = {
visibility: false,
}
currentEvt: any = null
currentModel: any = null
currentAction = ''
// 关闭删除指标弹窗
closeDelete() {
this.deleteModal.visibility = false
}
// 打开删除指标弹窗
handleDeleteNode() {
this.deleteModal.visibility = true
}
// 确定删除指标
deleteNode() {
const parent = this.currentEvt.item.get('parent');
const model = this.currentEvt.item.get('model');
this.currentEvt.currentTarget.updateItem(parent, {
children: (parent.get('model').children || []).filter((e: any) => e.id !== model.id),
});
this.currentEvt.currentTarget.layout(false);
this.closeDelete()
this.moreModal.visibility = false
this.$emit('update:indexContent', this.tree.get('data'))
}
// 修改指标名称
editNode() {
const model = this.currentEvt.item.get('model');
if (this.currentModel.type === 'node-leaf') {
this.addModal.content.indexCode = model.indexCode
this.addModal.leaf = {
id: model.indexCode,
indexNm: model.indexName
}
} else {
this.addModal.content.indexCode = ''
}
this.addModal.nodeType = this.currentModel.type === 'node-leaf' ? 'leaf' : 'sub'
this.addModal.content.indexName = model.indexName
this.addModal.opType = 'edit'
this.addModal.title = '修改指标名称'
this.addModal.visibility = true
}
// 关闭添加指标弹窗
handleClose() {
this.addModal.content.indexName = ''
this.addModal.content.indexCode = ''
this.addModal.visibility = false
console.log('关闭添加指标弹窗')
}
addNode(type: string) {
this.addModal.opType = 'add'
this.addModal.nodeType = type
this.addModal.title = `添加${type === 'leaf' ? '底层' : '下级'}指标`
this.addModal.visibility = true
}
// 添加指标
handleAddNode() {
if (!this.addModal.content.indexName.trim()) {
this.$message.error(this.addModal.nodeType === 'sub' ? '请输入下级指标' : '请选择底层指标')
return
}
if (this.addModal.nodeType === 'sub') {
this.addModal.content.indexCode = ''
}
const model = this.currentEvt.item.get('model');
// console.log('点击的name::::', name)
const newId = model.id + '-' +
(((model.children || []).reduce((a: any, b: any) => {
const num = Number(b.id.split('-').pop());
return a < num ? num : a;
}, 0) || 0) +
1);
let obj
if (this.addModal.opType === 'add') {
obj = {
children: (model.children || []).concat([{
id: newId,
direction: 'right',
indexFlag: this.addModal.nodeType === 'sub' ? 1 : 2,
indexCode: this.addModal.content.indexCode,
indexName: this.addModal.content.indexName,
children: [],
type: this.addModal.nodeType === 'sub' ? 'node-sub' : 'node-leaf',
color: '#aaa',
},]),
}
console.log('添加指标:', this.addModal.nodeType, obj)
} else {
obj = {
indexName: this.addModal.content.indexName,
indexCode: this.addModal.content.indexCode
}
}
this.currentEvt.currentTarget.updateItem(this.currentEvt.item, obj);
this.currentEvt.currentTarget.layout(false);
this.addModal.visibility = false
this.addModal.content.indexName = ''
this.addModal.content.indexCode = null
this.addModal.leaf = ''
this.moreModal.visibility = false
this.$emit('update:indexContent', this.tree.get('data'))
}
// 选择底层指标
changeLeaf(val: any) {
if (!val) {
this.addModal.content.indexName = ''
this.addModal.content.indexCode = ''
return
}
this.addModal.content.indexName = val.indexNm
this.addModal.content.indexCode = val.id
}
updateTree() {
this.tree.data(this.indexContent)
this.tree.render()
}
mounted() {
const _this = this
const { Util } = G6;
// <text style={
{ marginLeft: ${width - 16}, marginTop: -18, stroke: '', fill: '#000', fontSize: 16, cursor: 'pointer', opacity: ${cfg.hover ? 0.75 : 0} }} action="add">+</text>
// <group zIndex=9999>
// <rect style={
{ width: 100, height: 42, stroke: ${stroke}, fill: ${fill}, marginLeft: ${ width + 30 }, marginTop: -24, cursor: 'pointer', opacity: ${cfg.openMore ? 1 : 0} }} action="addSub">
// <Text style={
{ marginLeft: ${ width + 42 }, marginTop: 12, cursor: 'pointer', opacity: ${cfg.openMore ? 1 : 0} }} action="addSub">添加下级指标</Text>
// </rect>
// <rect style={
{ width: 100, height: 42, stroke: ${stroke}, fill: ${fill}, marginLeft: ${ width + 30 }, marginTop: -24, cursor: 'pointer', opacity: ${cfg.openMore ? 1 : 0} }} action="addLeaf">
// <Text style={
{ marginLeft: ${ width + 42 }, marginTop: 12, cursor: 'pointer', opacity: ${cfg.openMore ? 1 : 0} }} action="addLeaf">添加底层指标</Text>
// </rect>
// </group>
// 根结点
// 使用 G6.registerNode() 方法注册一个名为 'node-root' 的自定义节点
G6.registerNode(
'node-root', // 节点名称,这里为 'node-root'
{
// jsx 属性指定节点的渲染函数,用于生成节点的 HTML/SVG 内容
jsx: (cfg: any) => {
// 计算节点内容的宽度,以便在渲染时使用
// 16: 文本字体大小 (font size)
// 它表示文本的最大宽度。在这里传递 [0] 作为参数,可能意味着测量文本的实际宽度,而不限制其最大宽度
// 24: 这是在计算节点内容宽度时额外添加的宽度值。在代码中,它被用作一个修正项,可能是为了确保节点的宽度足够容纳文本内容,并且在节点左右两侧留有一定的间隔
const width = Util.getTextSize(cfg.indexName, 16)[0] + 24;
// 获取节点样式中的边框颜色,默认为 '#CED4E0'
const stroke = cfg.style.stroke || '#CED4E0';
// 获取节点样式中的填充颜色,默认为 '#FFF'
const fill = cfg.style.fill || '#FFF';
// 返回节点的 HTML/SVG 内容
return `
<group>
<rect draggable="true" style={
{width: ${width}, height: 42, stroke: ${stroke}, fill: ${fill}, radius: 8 }} keyshape>
<text style={
{ fontSize: 16, marginLeft: 12, marginTop: 12 }}>${cfg.indexName}</text>
<Circle style={
{ r: 10, fill: '#FFF', stroke: ${stroke}, marginLeft: ${width + 14}, marginTop: 4 }}>
<Text style={
{ fill: ${_this.disabled ? '#ddd' : '#1564FF'}, fontSize: 18, lineHeight: 24, marginLeft: ${width + 7}, marginTop: -12, cursor: ${_this.disabled ? 'not-allowed' : 'pointer'} }} action="more">...</Text>
</Circle>
</rect>
</group>
`;
},
// getAnchorPoints() 方法定义节点的锚点位置,即连接边的起始和结束点
getAnchorPoints() {
// 返回一个数组,数组中包含两个锚点位置
// 第一个锚点位于节点的左边中点 [0, 0.5]
// 第二个锚点位于节点的右边中点 [1, 0.5]
return [
[0, 0.5],
[1, 0.5],
];
},
},
'single-node' // 节点类型,这里为 'single-node'
);
// 子节点
// <text style={
{ marginLeft: ${width - 32}, marginTop: -18, fill: '#000', fontSize: 16, cursor: 'pointer', opacity: ${cfg.hover ? 0.75 : 0} }} action="add">+</text>
// <text style={
{ marginLeft: ${width - 16}, marginTop: -34, fill: '#000', fontSize: 16, cursor: 'pointer', opacity: ${cfg.hover ? 0.75 : 0}, next: 'inline' }} action="delete">-</text>
G6.registerNode(
'node-sub', {
jsx: (cfg: any) => {
const width = Util.getTextSize(cfg.indexName, 14)[0] + 24;
const stroke = cfg.style.stroke || '#CED4E0';
const fill = cfg.style.fill || '#FFF';
const color = '#f00';
return `
<group>
<rect draggable="true" style={
{width: ${width}, height: 42, stroke: ${stroke}, fill: ${fill}, radius: 8 }} keyshape>
<text style={
{ fontSize: 14, marginLeft: 12, marginTop: 12 }}>${cfg.indexName}</text>
<Circle style={
{ r: 10, fill: '#FFF', stroke: ${stroke}, marginLeft: ${width + 14}, marginTop: 4 }}>
<Text style={
{ fill: ${_this.disabled ? '#ddd' : '#1564FF'}, fontSize: 18, marginLeft: ${width + 7}, marginTop: -12, cursor: ${_this.disabled ? 'not-allowed' : 'pointer'}, }} action="more">...</Text>
</Circle>
</rect>
</group>
`;
},
getAnchorPoints() {
return [
[0, 0.5],
[1, 0.5],
];
},
},
'single-node',
);
// 叶子节点
// <text style={
{ marginLeft: ${width - 16}, marginTop: -18, stroke: ${color}, fill: '#000', cursor: 'pointer', opacity: ${cfg.hover ? 0.75 : 0}, next: 'inline' }} action="delete">-</text>
G6.registerNode(
'node-leaf', {
jsx: (cfg: any) => {
const width = Util.getTextSize(cfg.indexName, 14)[0] + 24;
const stroke = cfg.style.stroke || '#CED4E0';
const fill = cfg.style.fill || '#FFF';
const color = cfg.color || cfg.style.stroke;
return `
<group>
<rect draggable="true" style={
{width: ${width}, height: 42, stroke: ${stroke}, fill: ${fill}, radius: 8}} keyshape>
<text style={
{ fontSize: 14, marginLeft: 12, marginTop: 12 }}>${cfg.indexName}</text>
<Circle style={
{ r: 10, fill: '#FFF', stroke: ${stroke}, marginLeft: ${width + 14}, marginTop: 4 }}>
<Text style={
{ fill: ${_this.disabled ? '#ddd' : '#1564FF'}, fontSize: 18, marginLeft: ${width + 7}, marginTop: -12, cursor: ${_this.disabled ? 'not-allowed' : 'pointer'}, }} action="more">...</Text>
</Circle>
</rect>
</group>
`;
},
getAnchorPoints() {
return [
[0, 0.5],
[1, 0.5],
];
},
},
'single-node',
);
// 双击修改节点名称
editNode(evt: any) {
const item = evt.item;
const model = item.get('model');
// 根结点不能修改名称
if (model.type === 'node-root') return;
console.log('model:::---:', model);
// 获取节点位置
const { x, y } = item.calculateBBox();
// 获取图表对象
const graph = evt.currentTarget;
// 将节点位置转换为实际位置
const realPosition = evt.currentTarget.getClientByPoint(x, y);
// 创建一个文本输入框
const el = document.createElement('div');
const fontSizeMap: any = {
'node-root': 24,
'node-sub': 18,
'node-leaf': 18,
};
el.style.fontSize = fontSizeMap[model.type] + 'px';
el.style.position = 'fixed';
el.style.top = realPosition.y + 4 + 'px';
el.style.left = realPosition.x + 'px';
el.style.paddingLeft = '6px';
el.style.transformOrigin = 'top left';
el.style.transform = `scale(${evt.currentTarget.getZoom()})`;
const input = document.createElement('input');
input.style.border = 'none';
input.value = model.indexName;
input.style.width = Util.getTextSize(model.indexName, fontSizeMap[model.type])[0] + 'px';
input.className = 'dice-input';
el.className = 'dice-input';
el.appendChild(input);
document.body.appendChild(el);
// 定义销毁文本输入框的函数
const destroyEl = () => {
document.body.removeChild(el);
};
// 定义处理点击事件的函数
const clickEvt = (event: any) => {
if (!(event.target && event.target.className && event.target.className.includes('dice-input'))) {
// 移除事件监听器
window.removeEventListener('mousedown', clickEvt);
window.removeEventListener('scroll', clickEvt);
// 更新节点名称并重新布局图表
graph.updateItem(item, {
indexName: input.value,
});
graph.layout(false);
// 移除滚轮缩放事件监听器,并销毁文本输入框
graph.off('wheelZoom', clickEvt);
destroyEl();
}
};
// 添加事件监听器,处理点击事件
graph.on('wheelZoom', clickEvt);
window.addEventListener('mousedown', clickEvt);
window.addEventListener('scroll', clickEvt);
// 监听输入框的键盘事件,如果按下 Enter 键,触发点击事件
input.addEventListener('keyup', (event) => {
if (event.key === 'Enter') {
clickEvt({
target: {},
});
}
});
},
hoverNode(evt: any) {
evt.currentTarget.updateItem(evt.item, {
hover: true,
});
},
hoverNodeOut(evt: any) {
evt.currentTarget.updateItem(evt.item, {
hover: false,
});
},
});G6 图形库的行为(Behavior),用于在画布上实现缩放和平移操作。当用户在画布上滚动鼠标滚轮时,会根据情况执行缩放或平移操作。如果同时按下了 Ctrl 键,则进行缩放操作,否则进行平移操作。
// 在 G6 中注册名为 'scroll-canvas' 的行为
G6.registerBehavior('scroll-canvas', {
  // 获取事件列表
  getEvents: function getEvents() {
    return {
      wheel: 'onWheel', // 当滚轮滚动事件发生时,调用 onWheel 方法
    };
  },

  // 处理滚轮滚动事件的方法
  onWheel: function onWheel(ev: any) {
    const { graph } = _this; // 从 this 对象中获取 graph,这里的 _this 表示当前行为实例
    if (!graph) {
      return;
    }
    if (ev.ctrlKey) { // 如果按下了 Ctrl 键
      const canvas = graph.get('canvas'); // 获取画布对象
      const point = canvas.getPointByClient(ev.clientX, ev.clientY); // 根据鼠标位置获取画布上的坐标点
      let ratio = graph.getZoom(); // 获取当前图形的缩放比例
      if (ev.wheelDelta > 0) { // 如果滚轮向上滚动
        ratio += ratio * 0.05; // 将缩放比例增加 5%
      } else {
        ratio *= ratio * 0.05; // 否则将缩放比例减少 5%
      }
      graph.zoomTo(ratio, {
        x: point.x, // 设置缩放中心点的 x 坐标
        y: point.y, // 设置缩放中心点的 y 坐标
      });
    } else {
      const x = ev.deltaX || ev.movementX; // 获取水平方向上的滚动距离
      const y = ev.deltaY || ev.movementY || (-ev.wheelDelta * 125) / 3; // 获取垂直方向上的滚动距离
      graph.translate(-x, -y); // 平移图形,向相反方向移动
    }
    ev.preventDefault(); // 阻止默认滚动事件,避免影响整个页面的滚动
  },
});
- 节点被点击时,触发'node:click'事件,调用'clickNode'函数。
- 节点被双击时,触发'node:dblclick'事件,原本预计调用'editNode'函数,但该函数体被注释掉了。
- 鼠标进入节点时,触发'node:mouseenter'事件,调用'hoverNode'函数。
- 鼠标离开节点时,触发'node:mouseleave'事件,调用'hoverNodeOut'函数。
// 假设这是一个名为G6的图形引擎,通过registerBehavior注册了一个名为'dice-mindmap'的行为

G6.registerBehavior('dice-mindmap', {
  // 获取事件列表的方法
  getEvents() {
    return {
      // 当节点被点击时触发'node:click'事件,调用'clickNode'方法
      'node:click': 'clickNode',
      // 当节点被双击时触发'node:dblclick'事件,但该行为被注释掉了,没有调用对应的方法
      // 'node:dblclick': 'editNode',
      // 当鼠标进入节点时触发'node:mouseenter'事件,调用'hoverNode'方法
      'node:mouseenter': 'hoverNode',
      // 当鼠标离开节点时触发'node:mouseleave'事件,调用'hoverNodeOut'方法
      'node:mouseleave': 'hoverNodeOut',
    };
  },

  // 节点被点击时调用的方法
  clickNode(evt: any) {
    // 获取节点相关信息
    const model = evt.item.get('model');
    const name = evt.target.get('action');
    _this.currentAction = name; // 假设_this是之前定义过的变量,用于保存当前的动作名称

    switch (name) {
      // case 'addSub':
      // case 'addLeaf':
      //   // 添加子节点或叶节点的逻辑代码
      //   // ...
      //   break;

      // case 'delete':
      //   // 删除节点的逻辑代码
      //   // ...
      //   break;

      // case 'edit':
      //   // 编辑节点的逻辑代码
      //   console.log('edit::::')
      //   break;

      case 'more':
        // 如果当前没有被禁用
        if (!_this.disabled) {
          // 假设_this是之前定义过的变量,用于保存当前的事件和节点模型
          _this.currentEvt = evt;
          _this.currentModel = model;

          // 打印当前节点模型信息
          console.log('currentModel::::', _this.currentModel);

          // 假设_moreModal是之前定义过的变量,用于显示更多操作的弹窗
          _this.moreModal.visibility = true;

          // 可以根据需要执行其他操作
          // ...
        }
        break;

      default:
        // 如果没有匹配到任何动作名称,直接返回
        return;
    }

    // 可以在这里添加其他代码逻辑
    // ...
  },

  // 其他方法
  // ...
});
将输入的数据对象进行转换,并根据不同层级进行相应的属性设置。在转换过程中,会对节点的类型、悬停状态、展开状态等进行处理,同时为部分节点设置默认值。如果节点包含子节点,会递归地处理子节点的数据。
// 定义数据转换函数 dataTransform,接收一个参数 data,该参数为任意类型的数据
const dataTransform = (data: any) => {
  // 定义内部递归函数 changeData,接收两个参数:d 表示当前数据节点,level 表示当前数据节点的层级,默认值为 0
  const changeData: any = (d: any, level = 0) => {
    // 创建一个新的数据对象 data,用扩展运算符复制当前数据节点 d 的所有属性到新对象中
    const data = {
      ...d,
    };
    // 使用 switch 语句根据当前节点层级 level 进行不同的处理
    switch (level) {
      case 0:
        // 当层级为 0 时,设置节点的 type 属性为 'node-root'
        data.type = 'node-root';
        break;
      // case 1:
      //   data.type = 'node-sub';
      //   break;
      default:
        // 默认情况下,设置节点的 type 属性为 'node-sub'
        data.type = 'node-sub';
        break;
    }

    // 设置节点的 hover 属性为 false,表示鼠标未悬停在节点上
    data.hover = false;
    // 设置节点的 openMore 属性为 false,表示未展开更多选项
    data.openMore = false;

    // 当节点层级为 1 且没有 direction 属性时,进行下面的处理
    if (level === 1 && !d.direction) {
      // 如果节点没有 direction 属性,则设置 direction 属性为 'right'
      data.direction = 'right';
    }

    // 如果当前节点存在子节点,则递归处理每个子节点,并将返回的新数据添加到当前节点的 children 属性中
    if (d.children) {
      data.children = d.children.map((child: any) => changeData(child, level + 1));
    }

    // 返回处理后的新数据对象
    return data;
  };

  // 调用递归函数 changeData,并传入初始的 data 参数进行数据转换
  return changeData(data);
};
 const container: any = document.getElementById(_this.containerId);
    // const el = document.createElement('pre');
    // el.innerHTML = '双击修改节点标题';
    // container.appendChild(el);

    const width = container.scrollWidth;
    // const height = (container.scrollHeight || 500) - 20;
    this.tree = new G6.TreeGraph({
      container: _this.containerId,
      width: width,
      height: 300,
      fitView: true,
      fitViewPadding: [10, 20],
      layout: {
        type: 'mindmap',
        direction: 'H',
        nodesep: 80, // 可选
        ranksep: 40, // 可选
        // 节点高度
        getHeight: () => {
          return 16;
        },
        // 节点宽度
        getWidth: (node: any) => {
          return node.level === 0 ?
            Util.getTextSize(node.indexName, 16)[0] + 12 :
            Util.getTextSize(node.indexName, 12)[0];
        },
        // 节点之间的垂直间距
        getVGap: () => {
          return 40;
        },
        // 节点之间的水平间距
        getHGap: () => {
          return 84;
        },
        getSide: (node: any) => {
          return node.data.direction;
        },
      },
      defaultEdge: {
        type: 'cubic-horizontal',
        style: {
          lineWidth: 2,
        },
      },
      minZoom: 0.8,
      maxZoom: 1.5,
      modes: {
        default: ['drag-canvas', 'zoom-canvas', 'dice-mindmap'],
      },
    });

    const data = dataTransform(_this.indexContent)
    this.$emit('update:indexContent', data)
    this.tree.data(data);

    this.tree.render();

    if (typeof window !== 'undefined') {
      window.onresize = () => {
        if (!this.tree || this.tree.get('destroyed')) return;
        if (!container || !container.scrollWidth || !container.scrollHeight) return;
        this.tree.changeSize(container.scrollWidth, 300);
      };
    }
scss
<style lang="scss">
.custome-G6-modal {
  .mds-modal {
    min-width: initial;
  }

  .more-content {
    display: grid;
    grid-template-columns: repeat(2, 1fr);
    grid-template-rows: repeat(2, 1fr);
    column-gap: 12px;
    row-gap: 12px;
    padding-bottom: 48px;

    .mds-btn {
      width: auto;
      margin: 0;
    }
  }

  .mds-modal-header,
  .mds-modal-bottom {
    border: none;
  }

  .mds-modal-footer-default {
    justify-content: flex-end;

    button {
      flex: initial;
      width: 80px;
    }

    .mds-modal-button {
      margin-right: 2px;
    }
  }

  .tip-text {
    font-size: 12px;
    line-height: 18px;
    color: rgba(168, 172, 179, 1);
    margin-top: 10px;
  }
}
</style>

<style lang="scss" scoped>
.custome-G6 {
  background-color: #F9F9F9;
}
</style>Echarts
Echarts是由百度开发的,更符合国人的习惯,支持各种类型的图表,并具有良好的交互性能,文档详尽,友好,强烈推荐
缺点
-
初学者可能会发现Echarts较难配置,需要额外的学习成本。
-
Echarts的可定制性可能会导致代码变得冗长,增加了工作量和开发时间。
-
在某些情况下,Echarts在渲染大型数据集时可能会变慢,这需要进行其他优化才能提高性能。
-
npm uninstall echarts
npm install echarts
yarn remove echarts
yarn add echarts
Vue3
radar
<template>
  <div>
    <div id="main" style="width: 100%; height: 300px;"></div>
  </div>
</template>

<script setup lang="ts">
import { onMounted } from 'vue';
import * as echarts from 'echarts/core';
import {
  TitleComponent,
  LegendComponent,
} from 'echarts/components';
import { RadarChart } from 'echarts/charts';
import { CanvasRenderer } from 'echarts/renderers';

const { use } = echarts;
use([TitleComponent, LegendComponent, RadarChart, CanvasRenderer]);

const option = {

  legend: {
    bottom: 0, // 设置图例在底部
    icon: 'circle', // 使用圆形图例项的图标
    data: ['能力模型', '我的评分']
  },
  radar: {
    //逆时针
    indicator: [
      { name: '学习能力及影响力', max: 8 },
      { name: '沟通能力', max: 8 },
      { name: '目标管理', max: 8 },
      { name: '项目执行', max: 8 },
      { name: '专业能力', max: 8 }
    ]
  },
  series: [
    {
      name: '能力模型 vs 我的评分',
      type: 'radar',
      data: [
        {
          value: [6, 6, 6, 4, 8],
          name: '能力模型',
          lineStyle: {
            color: '#3F80F2' // 将颜色设置为蓝色
          },
          itemStyle: {
            color: '#3F80F2' // 将数据点颜色设置为蓝色
          },

          areaStyle: {
            color: new echarts.graphic.RadialGradient(0.1, 0.6, 1, [
              {
                color: 'rgba(63, 128, 242, 0.1)',
                offset: 0
              },
              {
                color: 'rgba(63, 128, 242, 0.9)',
                offset: 1
              }
            ])
          }
        },
        {
          value: [8, 5, 4, 6, 8],
          name: '我的评分',
          lineStyle: {
            color: '#EB532E' // 将颜色设置为红色
          },
          itemStyle: {
            color: '#EB532E' // 将数据点颜色设置为红色
          },
          areaStyle: {
            color: new echarts.graphic.RadialGradient(0.1, 0.6, 1, [
              {
                color: 'rgba(255, 145, 124, 0.1)',
                offset: 0
              },
              {
                color: 'rgba(255, 145, 124, 0.9)',
                offset: 1
              }
            ])
          }
        }
      ]
    }
  ]
};

onMounted(() => {
  const chartDom = document.getElementById('main');
  if (chartDom) {
    const myChart = echarts.init(chartDom);
    myChart.setOption(option);
  }
});
</script>

<style>
/* 根据需要添加样式 */
</style>
React
原生echarts+TS
原生echats官方文档和功能比echarts-for-react全,
但echarts-for-react对react支持更友好,使用更简单
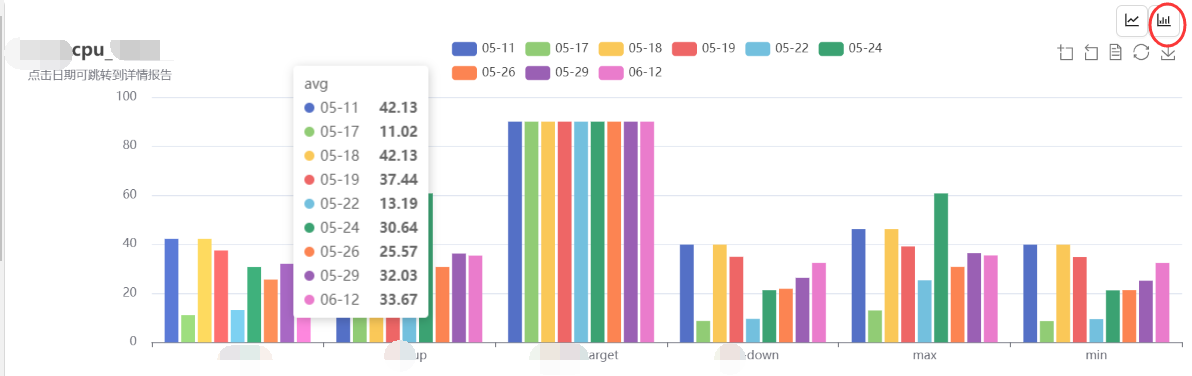
ListChart(列表切换echarts图表,同类数据为x轴的bar)
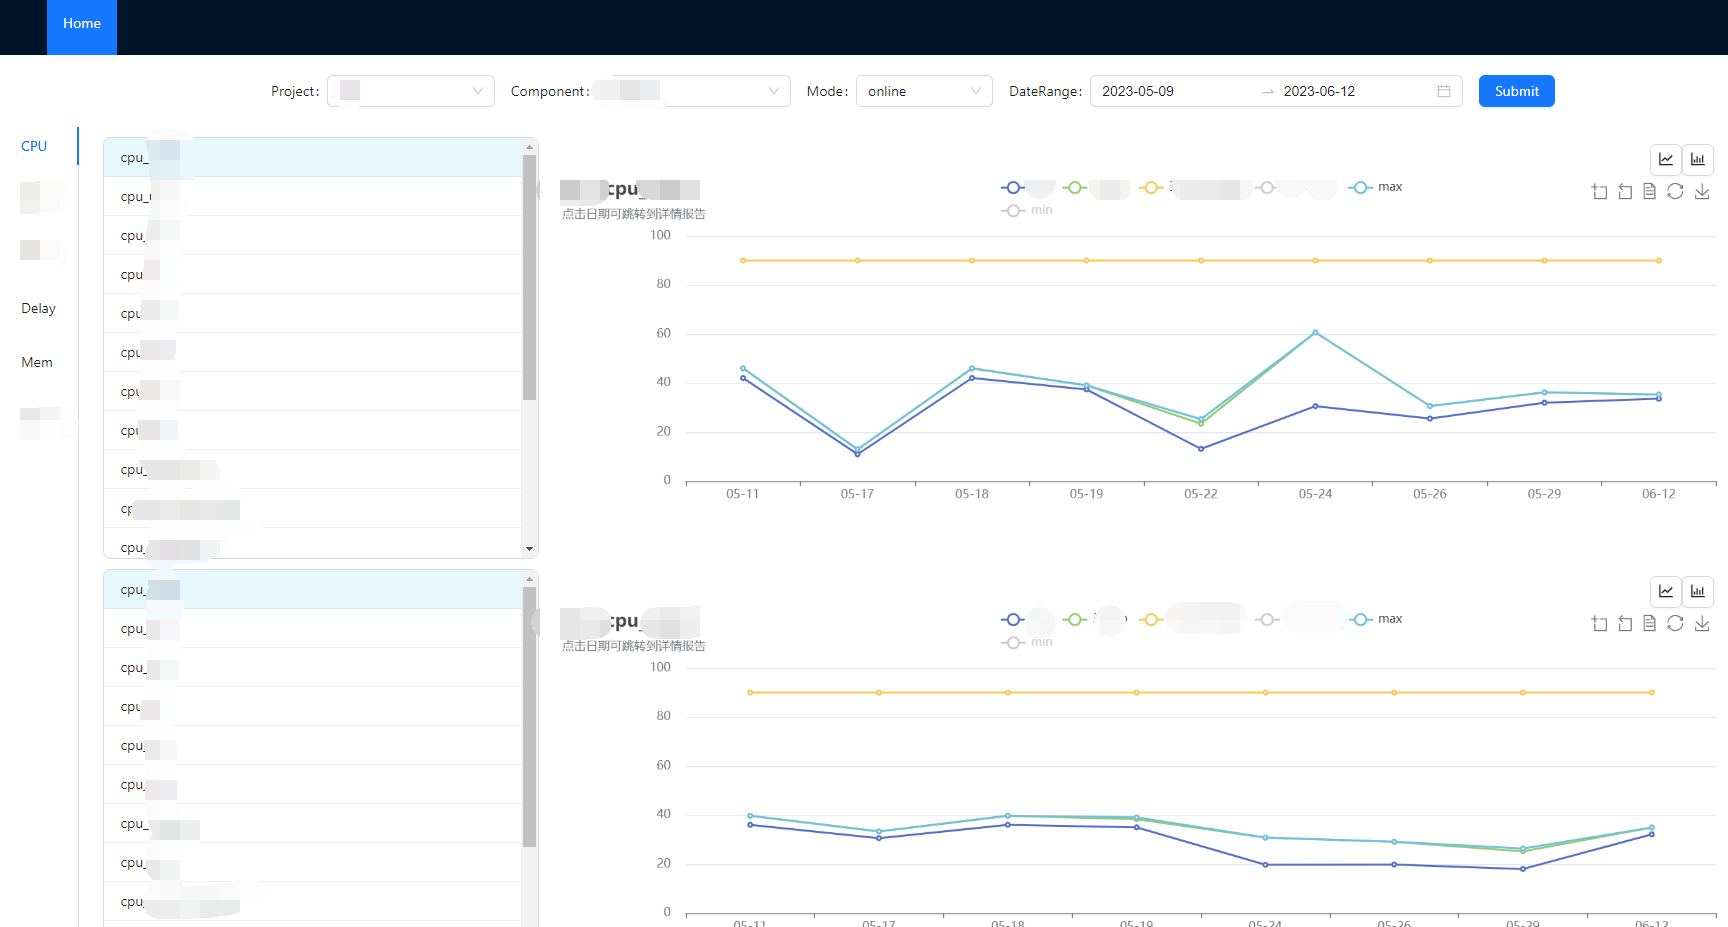
ListChart.tsx
import React, { useEffect, useRef, useState } from 'react';
import { List, Button} from 'antd';
import { LineChartOutlined, BarChartOutlined } from '@ant-design/icons';
import { ProCard } from '@ant-design/pro-components';
import * as echarts from "echarts";

import './ListChart.css'
import { LIST_NAME, CHART_OPTION,resize,findSubstrIdx } from '../utils/ListChartUtil';
import { ListChartStatus } from "./ListChartStatus";

const ListChart: React.FC<ListChartStatus> = ({ urlPre, proc_datas, board_name }) => {

    const chartRef = useRef<HTMLDivElement>(null);
    const [selectedIdx, setselectedIdx] = useState<number>(0);
    const [isLine, setIsLine] = React.useState<boolean>(true);
    const proc_list = new Array(proc_datas.length).fill(null).map((val, i) => {
        return proc_datas[i].proc_name;
    });
    let chart: any = null;

    useEffect(() => {
        if (chartRef.current) {
            chart = echarts.init(chartRef.current);
            const {option,urlSufs}=getOption(proc_datas[selectedIdx])
            chart.setOption(option);
            resize(chart);
            chart.on('click', isLine ? 'xAxis' : 'series', function (params: any) {
                const clickDate= isLine ? params.value:params.seriesName;
                window.open(urlPre + '/' + urlSufs[findSubstrIdx(urlSufs, clickDate)] + '/index.html', '_blank');
            });
        }
    }, [chartRef, selectedIdx, isLine]);

    const initDate_UrlSufs=(proc_data:any)=>{
        let urlSufs: string[] = [];
        let dates: string[] = [];
        proc_data.date_list.forEach((date: string, idx: number) => {
            urlSufs.push(date + '/' + proc_data.report_id_list[idx]);
            dates.push(date.substring(5));
        });
        return {dates,urlSufs};
    }
    const  getBarDates=(series:any)=>{
        const barDatas: any = [];
        LIST_NAME.forEach((_, idx) => {
            if (series[idx] && series[idx].length) {
                barDatas.push([LIST_NAME[idx], ...series[idx]])
            }
        })
        return barDatas;
    }
    const getOption=(proc_data:any)=>{
        const {dates,urlSufs}=initDate_UrlSufs(proc_data)
        const series = [proc_data.avg_list, proc_data.sigma3_up_list, proc_data.sigma3_up_target_list, proc_data.sigma3_down_list, proc_data.max_list, proc_data.min_list]
        let option = {
            tooltip: CHART_OPTION.tooltip,
            legend: CHART_OPTION.legend,
            toolbox: CHART_OPTION.toolbox,
            yAxis: CHART_OPTION.yAxis,
            title: {
                text: proc_data ? board_name + ":" + proc_data.proc_name : board_name,
                subtext: "点击日期可跳转到详情报告",
            },
            xAxis: {
                type: 'category', // 类型为分类轴
                triggerEvent: true, // 是否触发鼠标事件
                data: isLine ? proc_data.date_list.map((date: string, idx: number) => {
                    return dates[idx]
                }) : null,
            },
            series: isLine ? LIST_NAME.map((_, idx) => {
                if (series[idx] && series[idx].length) {
                    return {
                        name: LIST_NAME[idx],
                        type: 'line',
                        data: series[idx],
                        emphasis: {
                            focus: 'series'
                        },
                    }
                }
            }) : dates.map((_, idx) => {
                return {
                    name: dates[idx],
                    type: 'bar',
                    event: 'click',
                    emphasis: {
                        focus: 'series'
                    },
                }
            }),

            dataset: isLine ? null : {
                source: [
                    ['pref', ...dates],
                    ...getBarDates(series)
                ]
            },
        };
        return {option,urlSufs};
    }
    return (<ProCard layout="center"  className="procard" ghost>
        <ProCard colSpan={6} ghost >
            <List
                size="small"
                bordered
                className='procard-list'
                dataSource={proc_list}
                renderItem={(item, index) => <List.Item key={Math.random()} className={selectedIdx === index ? 'selected' :undefined }
                    onClick={() => setselectedIdx(index)}>
                    {item}</List.Item>}
            />
        </ProCard>
        <ProCard colSpan={18} ghost >
            <div className="procard-button" >
                <Button className="ant-btn" icon={<LineChartOutlined />} onClick={() => setIsLine(true)} ></Button>
                <Button className="ant-btn" icon={<BarChartOutlined />} onClick={() => setIsLine(false)}></Button>
            </div>
            <div key={`divChart${Math.random()}`}
                ref={chartRef}
                className='chart'
                style={

   {
                    flex: 2,
                    flexDirection:"column",
                    height: "40vh",
                    paddingLeft: "1vw",
                }}
            ></div>
        </ProCard>
    </ProCard>
    )
}
export default ListChart;
ListChart.css
.procard {
    display: flex;
    padding-top: 10px;
}
.procard-list {
    overflow-y: scroll;
    height: 45vh;
}
.selected {
    background-color: #e6f7ff !important;
  }
.procard-button{
    display: flex;
    justify-content: flex-end;
    padding-right: 7vw;
}
ListChartUtil.tsx
export const LIST_NAME = ['avg', '3∑-up', '3∑-up-target', '3∑-down', 'max', 'min']
export const CHART_OPTION = {
tooltip: {
trigger: 'axis',
axisPointer: {
type: "shadow"
},
},
legend: {
left: 'center',
width: '35%',
selected: {
'min': false,
'3∑-down': false,
}
},
toolbox: {
show: true,
feature: {
dataZoom: {
yAxisIndex: 'none'
},
dataView: { readOnly: false },
// magicType: { type: ['line'] },
restore: {},
saveAsImage: {}
},
right: "10%"
},
yAxis: {
type: 'value',
axisLabel: {
formatter: '{value} '
}
},
}
const dom: any = []; //所有echarts图表的数组
/**
* 当屏幕尺寸变化时,循环数组里的每一项调用resize方法来实现自适应。
* @param {*} eDom
*/
export function resize(eDom: any) {
dom.push(eDom);
window.onresize = () => {
dom.forEach((it: any) => {
it.resize();
})
};
}
export function findSubstrIdx(arr: string[], substr: string): number {
for (let i = 0; i < arr.length; i++) {
if (arr[i].indexOf(substr) !== -1) {
return i;
}
}
return -1;
}
React hooks 封装 ECharts5 通用组件 - 掘金
React+TypeScript封装ECharts_typescript+react 封装调用方法_KzXuanCn的博客-CSDN博客
Recharts
是一个基于React封装的库,使用了D3强大的绘图功能,使得使用React进行数据可视化变得更加简单。
优点
-
Recharts易于使用,因为它具有数量较少的自定义选项。
-
集成了React的生命周期方法,使它易于添加到React应用程序中,并可支持Redux状态管理器。
-
轻量级,对内存和CPU的影响较小。
-
支持多种样式、自定义颜色和动画。
缺点
-
不支持所有类型的图表,没有Echarts种类繁多。
-
功能相比于Echarts较少
综上所述,如果需要设计高度自定义的图表并且有足够的开发经验,那么使用Echarts可能更方便。另一方面,Recharts对于快速简单的数据可视化任务可能更适合,并且易于集成到React应用程序中。
D3
是一个基于数据驱动文档的JavaScript库,具有高度灵活性和自定义性,但需要更多的编码工作。