目录
专栏导读
专栏导读

专栏订阅地址:https://blog.csdn.net/qq_35831906/category_12375510.html

6 图形绘制与动画效果
6.1 绘制基本图形、文本和图片
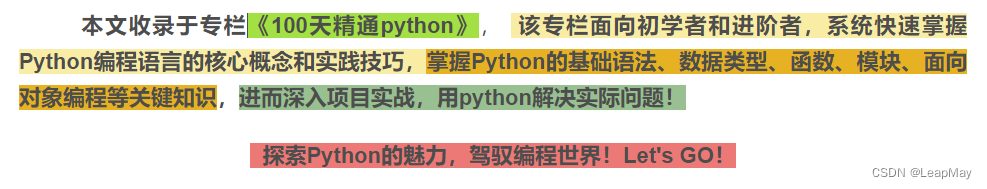
在 PyQt6 中,你可以使用 QPainter 进行图形绘制操作。以下是一个示例,展示如何在窗口上绘制基本图形、文本和图片:
import sys
from PyQt6.QtWidgets import QApplication, QMainWindow
from PyQt6.QtGui import QPainter, QPixmap, QColor, QPen
from PyQt6.QtCore import Qt

class DrawingWindow(QMainWindow):
    def __init__(self):
        super().__init__()
        self.setWindowTitle("Drawing Example")
        self.setGeometry(100, 100, 600, 400)

    def paintEvent(self, event):
        try:
            painter = QPainter(self)
            painter.setRenderHint(QPainter.RenderHint.Antialiasing)  # 修正此处

            # 绘制矩形
            painter.setBrush(QColor(255, 0, 0))
            painter.drawRect(50, 50, 100, 100)

            # 绘制椭圆
            painter.setBrush(QColor(0, 255, 0))
            painter.drawEllipse(200, 50, 100, 100)

            # 绘制文本
            painter.setPen(QPen(QColor(0, 0, 255)))
            painter.setFont(self.font())  # 使用默认字体
            painter.drawText(50, 200, "Hello, PyQt!")

            # 绘制图片,并使其自适应窗口
            pixmap = QPixmap("image.png")
            if not pixmap.isNull():
                scaled_pixmap = pixmap.scaled(self.width() // 2, self.height() // 2, Qt.AspectRatioMode.KeepAspectRatio)
                x = (self.width() - scaled_pixmap.width())
                y = (self.height() - scaled_pixmap.height())
                painter.drawPixmap(x, y, scaled_pixmap)

        except Exception as e:
            print("An error occurred during painting:", str(e))

    def resizeEvent(self, event):
        # 在窗口大小改变时重新绘制
        self.update()

if __name__ == "__main__":
    app = QApplication(sys.argv)
    window = DrawingWindow()
    window.show()
    sys.exit(app.exec())
输出:
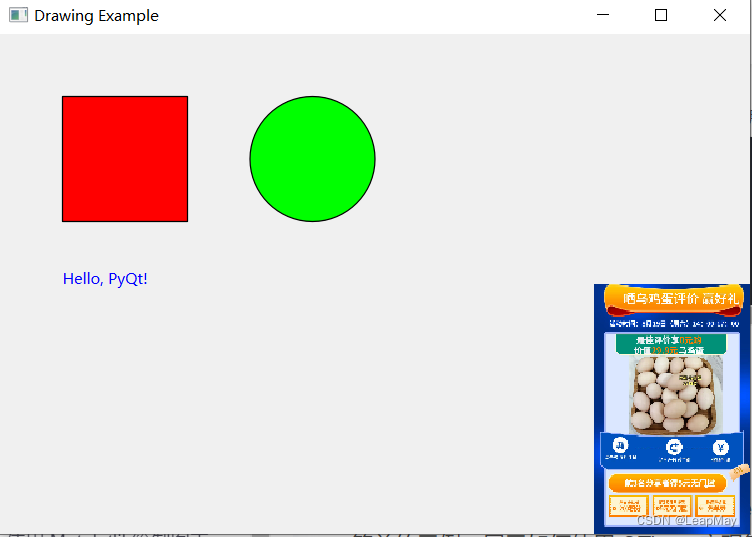
6.2 实现动画效果和过渡效果
实现动画效果和过渡效果可以使用 QTimer 来定时更新界面,以实现图形的平滑变化。以下是一个简单的示例,展示如何使用 QTimer 实现简单的平滑过渡效果:
import sys
from PyQt6.QtWidgets import QApplication, QMainWindow, QPushButton
from PyQt6.QtCore import QTimer, QRect, QPropertyAnimation
from PyQt6.QtGui import QPainter, QColor, QPen, QBrush
from PyQt6.QtCore import QVariantAnimation


class MyWindow(QMainWindow):
    def __init__(self):
        super().__init__()
        self.setWindowTitle("Animation Example")
        self.setGeometry(100, 100, 400, 300)

        self.button = QPushButton("Animate", self)
        self.button.setGeometry(150, 150, 100, 30)
        self.button.clicked.connect(self.start_animation)

        # 初始位置和颜色
        self.rect = QRect(50, 50, 100, 100)
        self.rect_color = QColor(0, 0, 255)  # 初始颜色

        self.ellipse = QRect(250, 150, 100, 100)
        self.ellipse_color = QColor(0, 255, 0)  # 初始颜色

        # 颜色动画
        self.color_animation_rect = QVariantAnimation()
        self.color_animation_rect.valueChanged.connect(self.update_color_rect)
        self.color_animation_rect.setDuration(2000)  # 2秒的动画
        self.color_animation_rect.setStartValue(QColor(255, 0, 0))
        self.color_animation_rect.setEndValue(QColor(0, 0, 255))

        self.color_animation_ellipse = QVariantAnimation()
        self.color_animation_ellipse.valueChanged.connect(self.update_color_ellipse)
        self.color_animation_ellipse.setDuration(2000)  # 2秒的动画
        self.color_animation_ellipse.setStartValue(QColor(0, 255, 0))
        self.color_animation_ellipse.setEndValue(QColor(0, 0, 255))

        self.animation_timer = QTimer()
        self.animation_timer.timeout.connect(self.animate)

    def start_animation(self):
        self.animation_timer.start(10)
        self.color_animation_rect.start()
        self.color_animation_ellipse.start()

    def animate(self):
        try:
            # 移动矩形
            if self.rect.x() < 250:
                self.rect.translate(1, 0)
            else:
                self.animation_timer.stop()

            # 移动椭圆
            if self.ellipse.x() > 50:
                self.ellipse.translate(-1, 0)
        except Exception as e:
            print("An error occurred during animation:", str(e))

        self.update()

    def update_color_rect(self, color):
        self.rect_color = color

    def update_color_ellipse(self, color):
        self.ellipse_color = color

    def paintEvent(self, event):
        try:
            painter = QPainter(self)

            # 绘制实心矩形
            brush_rect = QBrush(self.rect_color)
            painter.setBrush(brush_rect)
            painter.drawRect(self.rect)

            # 绘制实心椭圆
            brush_ellipse = QBrush(self.ellipse_color)
            painter.setBrush(brush_ellipse)
            painter.drawEllipse(self.ellipse)
        except Exception as e:
            print("An error occurred during painting:", str(e))


if __name__ == "__main__":
    app = QApplication(sys.argv)
    window = MyWindow()
    window.show()
    sys.exit(app.exec())
7 数据可视化
数据可视化是将数据转化为图表、图形等可视化元素,以便更直观地理解和分析数据。在 PyQt 中,你可以使用第三方库如 Matplotlib 和 PyQtGraph 来绘制图表和实现数据可视化。以下是详解和示例:
7.1 使用 Matplotlib绘制图表
Matplotlib 是一个强大的数据可视化库,可以创建各种类型的图表,包括折线图、散点图、柱状图等。
以下是一个使用 Matplotlib 在 PyQt 窗口中绘制简单折线图的示例:
import sys
from PyQt6.QtWidgets import QApplication, QMainWindow, QVBoxLayout, QWidget
from matplotlib.backends.backend_qt5agg import FigureCanvasQTAgg as FigureCanvas
import matplotlib.pyplot as plt

class MyWindow(QMainWindow):
    def __init__(self):
        super().__init__()
        self.setWindowTitle("Matplotlib 示例")  # 设置窗口标题
        self.setGeometry(100, 100, 800, 600)  # 设置窗口位置和大小

        main_widget = QWidget(self)
        self.setCentralWidget(main_widget)

        layout = QVBoxLayout()  # 创建垂直布局
        main_widget.setLayout(layout)

        fig, ax = plt.subplots()  # 创建 Matplotlib 图形和轴对象
        canvas = FigureCanvas(fig)  # 将图形对象放入 Matplotlib 画布中
        layout.addWidget(canvas)  # 将画布添加到布局中

        x = [1, 2, 3, 4, 5]
        y = [10, 25, 18, 35, 30]
        ax.plot(x, y)  # 在轴上绘制折线图

if __name__ == "__main__":
    app = QApplication(sys.argv)  # 创建应用程序对象
    window = MyWindow()  # 创建自定义窗口对象
    window.show()  # 显示窗口
    sys.exit(app.exec())  # 运行应用程序事件循环

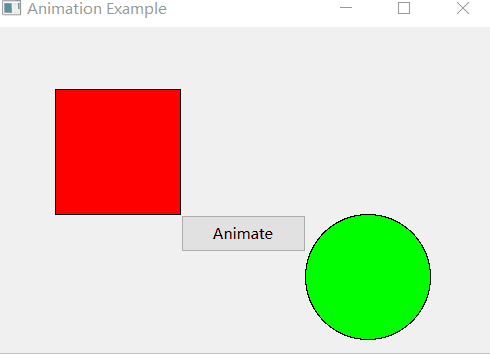
7.2 使用PyQtGraph绘制图表
PyQtGraph 是一个专注于实时数据可视化的库,适用于需要快速显示大量数据的场景。
以下是一个使用 PyQtGraph 在 PyQt 窗口中绘制实时曲线图的示例:
import sys
import numpy as np
from PyQt6.QtWidgets import QApplication, QMainWindow, QVBoxLayout, QWidget
import pyqtgraph as pg

class MyWindow(QMainWindow):
    def __init__(self):
        super().__init__()
        self.setWindowTitle("PyQtGraph 示例")  # 设置窗口标题
        self.setGeometry(100, 100, 800, 600)  # 设置窗口位置和大小

        main_widget = QWidget(self)
        self.setCentralWidget(main_widget)

        layout = QVBoxLayout()  # 创建垂直布局
        main_widget.setLayout(layout)

        self.plot_widget = pg.PlotWidget()  # 创建 PyQtGraph 绘图部件
        layout.addWidget(self.plot_widget)  # 将绘图部件添加到布局中

        self.data = np.random.normal(size=100)  # 创建随机数据数组
        self.curve = self.plot_widget.plot(self.data)  # 在绘图部件上绘制曲线

    def update_plot(self):
        self.data[:-1] = self.data[1:]  # 将数据向前移动一位
        self.data[-1] = np.random.normal()  # 生成新的随机数据
        self.curve.setData(self.data)  # 更新绘图曲线的数据

if __name__ == "__main__":
    app = QApplication(sys.argv)  # 创建应用程序对象
    window = MyWindow()  # 创建自定义窗口对象
    window.show()  # 显示窗口

    timer = pg.QtCore.QTimer()  # 创建定时器对象
    timer.timeout.connect(window.update_plot)  # 连接定时器的超时信号和更新绘图函数
    timer.start(100)  # 每100毫秒触发一次定时器超时信号,更新绘图

    sys.exit(app.exec())  # 运行应用程序事件循环
7.3 数据的实时刷新和交互操作
实现数据的实时刷新可以使用定时器来周期性地更新图表。在上面的 PyQtGraph 示例中,通过创建一个定时器并连接到 update_plot 方法来实现实时刷新。
数据的实时刷新和交互操作是在数据可视化中的重要部分,可以让用户更加直观地观察数据变化和与数据进行交互。本部分将详细解释如何在 PyQt 中实现数据的实时刷新和一些常见的交互操作。
7.3.1 数据的实时刷新
在数据可视化中,实时刷新通常需要使用定时器来定期更新图表或图形的显示。在 PyQt 中,可以使用 QTimer 来实现定时刷新。
以下是一个示例,展示如何在一个 Matplotlib 图表中实现数据的实时
import sys
import random
import matplotlib.pyplot as plt
from PyQt6.QtWidgets import QApplication, QMainWindow, QVBoxLayout, QWidget
from matplotlib.backends.backend_qt5agg import FigureCanvasQTAgg as FigureCanvas
from PyQt6.QtCore import QTimer

class RealTimePlotWindow(QMainWindow):
    def __init__(self):
        super().__init__()
        self.setWindowTitle("实时绘图示例")  # 设置窗口标题
        self.setGeometry(100, 100, 800, 600)  # 设置窗口位置和大小

        main_widget = QWidget(self)
        self.setCentralWidget(main_widget)

        layout = QVBoxLayout()  # 创建垂直布局
        main_widget.setLayout(layout)

        self.fig, self.ax = plt.subplots()  # 创建 Matplotlib 图形和轴对象
        self.canvas = FigureCanvas(self.fig)  # 将图形对象放入 Matplotlib 画布中
        layout.addWidget(self.canvas)  # 将画布添加到布局中

        self.data = []  # 存储数据
        self.x_values = []  # 存储 x 值
        self.line, = self.ax.plot(self.x_values, self.data)  # 创建初始曲线对象
        self.timer = QTimer(self)  # 创建定时器对象
        self.timer.timeout.connect(self.update_plot)  # 连接定时器的超时信号和更新绘图函数
        self.timer.start(1000)  # 每秒触发一次定时器超时信号

    def update_plot(self):
        new_data = random.randint(0, 100)  # 生成新的随机数据
        self.data.append(new_data)  # 将新数据添加到数据列表中
        self.x_values.append(len(self.data))  # 添加对应的 x 值
        self.line.set_xdata(self.x_values)  # 更新曲线的 x 值
        self.line.set_ydata(self.data)  # 更新曲线的 y 值
        self.ax.relim()  # 重新计算坐标轴限制
        self.ax.autoscale_view()  # 自动调整坐标轴范围
        self.canvas.draw()  # 重新绘制画布

if __name__ == "__main__":
    app = QApplication(sys.argv)  # 创建应用程序对象
    window = RealTimePlotWindow()  # 创建实时绘图窗口对象
    window.show()  # 显示窗口
    sys.exit(app.exec())  # 运行应用程序事件循环
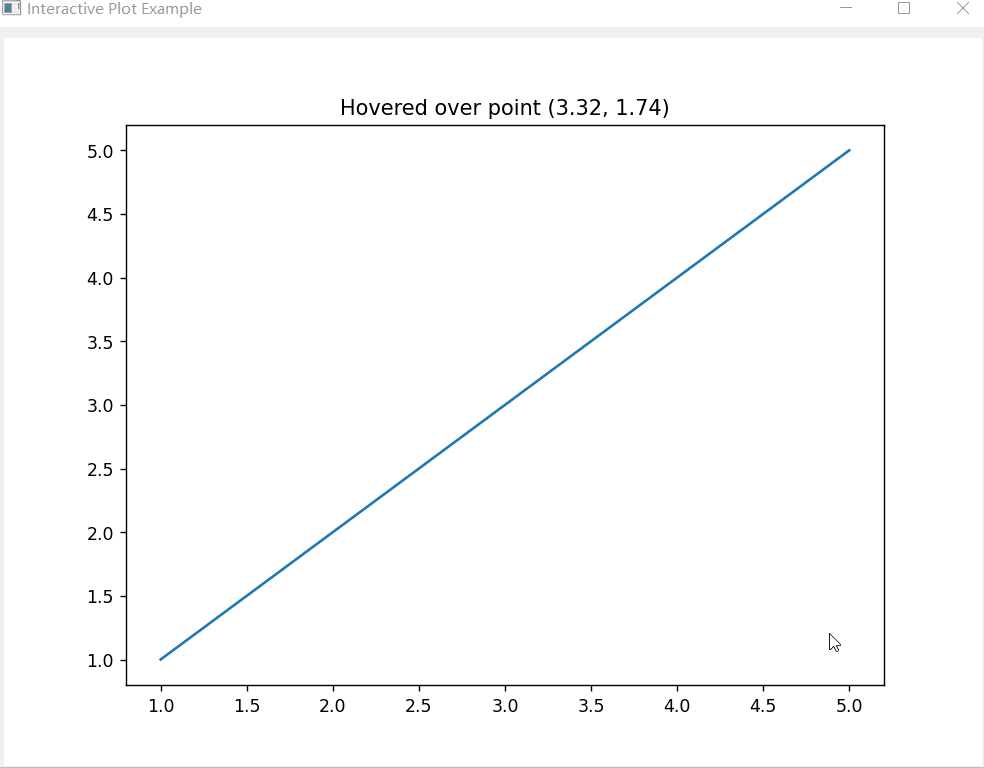
7.3.2 交互操作
在数据可视化中,用户可以通过交互操作来与图表或图形进行互动,比如缩放、平移、鼠标悬停显示数据点等。Matplotlib 和 PyQtGraph 都提供了丰富的交互功能。
以下是一个使用 Matplotlib 实现鼠标悬停显示数据点的示例:
import sys
import matplotlib.pyplot as plt
from PyQt6.QtWidgets import QApplication, QMainWindow, QVBoxLayout, QWidget
from matplotlib.backends.backend_qt5agg import FigureCanvasQTAgg as FigureCanvas

class InteractivePlotWindow(QMainWindow):
    def __init__(self):
        super().__init__()
        self.setWindowTitle("交互式绘图示例")  # 设置窗口标题
        self.setGeometry(100, 100, 800, 600)  # 设置窗口位置和大小

        main_widget = QWidget(self)
        self.setCentralWidget(main_widget)

        layout = QVBoxLayout()  # 创建垂直布局
        main_widget.setLayout(layout)

        self.fig, self.ax = plt.subplots()  # 创建 Matplotlib 图形和轴对象
        self.canvas = FigureCanvas(self.fig)  # 将图形对象放入 Matplotlib 画布中
        layout.addWidget(self.canvas)  # 将画布添加到布局中

        self.data = [1, 2, 3, 4, 5]
        self.x_values = [1, 2, 3, 4, 5]
        self.line, = self.ax.plot(self.x_values, self.data)  # 创建初始曲线对象

        self.cid = self.fig.canvas.mpl_connect("motion_notify_event", self.on_hover)  # 连接鼠标移动事件和悬停函数

    def on_hover(self, event):
        if event.inaxes == self.ax:  # 如果鼠标位于图形轴上
            x, y = event.xdata, event.ydata  # 获取鼠标位置的数据坐标
            self.ax.set_title(f"悬停于点 ({x:.2f}, {y:.2f})")  # 设置标题显示鼠标位置
            self.canvas.draw()  # 重新绘制画布以更新标题显示

if __name__ == "__main__":
    app = QApplication(sys.argv)  # 创建应用程序对象
    window = InteractivePlotWindow()  # 创建交互式绘图窗口对象
    window.show()  # 显示窗口
    sys.exit(app.exec())  # 运行应用程序事件循环
在这个示例中,鼠标悬停在图表上时,会在图表的标题中显示鼠标所在的数据点坐标。
综上所述,实现数据的实时刷新和交互操作可以增强数据可视化的效果,让用户更好地与数据进行互动。在 PyQt 中,使用定时器和相应的事件处理函数可以实现数据的实时刷新,而使用事件处理函数可以实现各种交互操作。
7.4 自定义数据可视化组件
在 PyQt 中,你可以通过自定义数据可视化组件来满足特定需求,这可以包括自定义图表、图形、绘图区域等。自定义数据可视化组件允许你根据应用程序的要求创建特定样式、功能和交互效果。下面是一个简单的示例,演示如何在 PyQt 中创建自定义的数据可视化组件。
import sys
import random
from PyQt6.QtWidgets import QApplication, QMainWindow, QVBoxLayout, QWidget
from PyQt6.QtCore import Qt
from matplotlib.backends.backend_qt5agg import FigureCanvasQTAgg as FigureCanvas
import matplotlib.pyplot as plt

class CustomVisualization(QWidget):
    def __init__(self):
        super().__init__()

        layout = QVBoxLayout()  # 创建垂直布局
        self.setLayout(layout)

        self.fig, self.ax = plt.subplots()  # 创建 Matplotlib 图形和轴对象
        self.canvas = FigureCanvas(self.fig)  # 将图形对象放入 Matplotlib 画布中
        layout.addWidget(self.canvas)  # 将画布添加到布局中

        self.data = [random.randint(0, 100) for _ in range(10)]  # 随机数据
        self.x_values = list(range(1, 11))  # x 值
        self.line, = self.ax.plot(self.x_values, self.data)  # 创建初始曲线对象

    def update_data(self):
        self.data = [random.randint(0, 100) for _ in range(10)]  # 生成新的随机数据
        self.line.set_ydata(self.data)  # 更新曲线的 y 值
        self.ax.relim()  # 重新计算坐标轴限制
        self.ax.autoscale_view()  # 自动调整坐标轴范围
        self.canvas.draw()  # 重新绘制画布

class CustomVisualizationWindow(QMainWindow):
    def __init__(self):
        super().__init__()

        self.setWindowTitle("自定义可视化示例")  # 设置窗口标题
        self.setGeometry(100, 100, 800, 600)  # 设置窗口位置和大小

        self.custom_viz = CustomVisualization()  # 创建自定义可视化部件
        self.setCentralWidget(self.custom_viz)  # 将部件设置为中心部件

        self.timer = None

    def start_timer(self):
        if self.timer is None:
            self.timer = self.startTimer(1000)  # 创建定时器并每秒触发一次

    def timerEvent(self, event):
        self.custom_viz.update_data()  # 在定时器触发时更新数据

if __name__ == "__main__":
    app = QApplication(sys.argv)  # 创建应用程序对象
    window = CustomVisualizationWindow()  # 创建自定义可视化窗口对象
    window.show()  # 显示窗口
    window.start_timer()  # 启动定时器
    sys.exit(app.exec())  # 运行应用程序事件循环
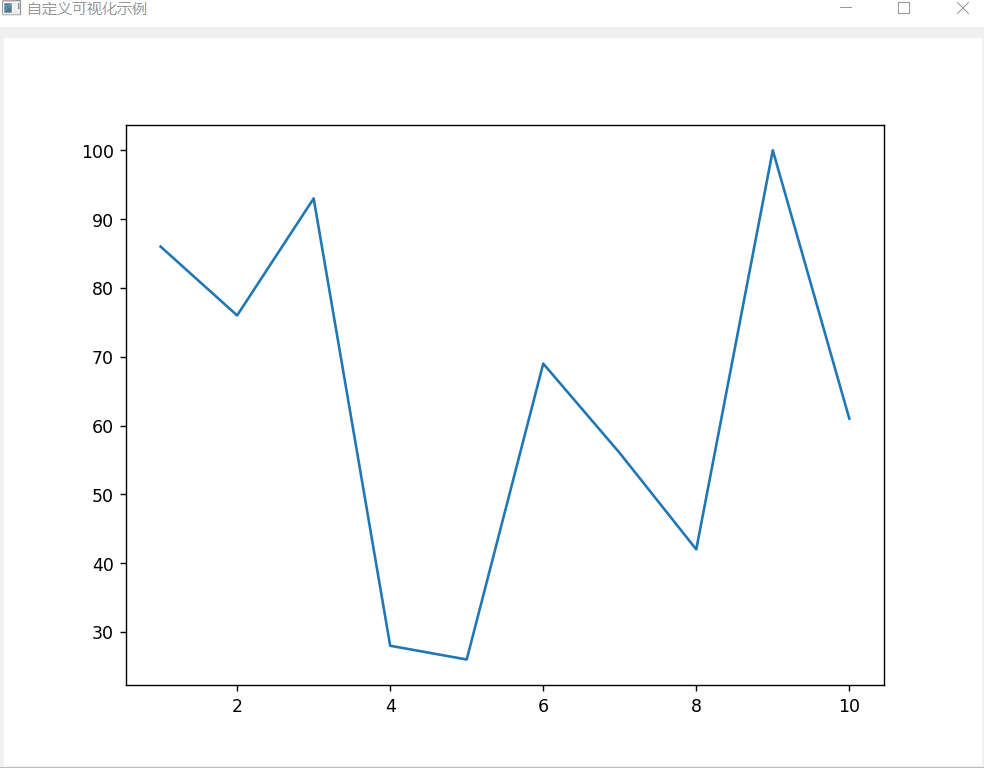
这个示例中创建了一个自定义的数据可视化组件
CustomVisualization,它使用 Matplotlib 在 PyQt 窗口中绘制一个折线图。通过定时器,可以周期性地更新数据并实现数据的实时刷新。你可以根据需求对自定义可视化组件进行扩展,添加交互功能、定制样式等。