目录
二:地图撒点(如果是1000条以上的撒点,请自行使用海量点的方式撒点,否则会影响性能)
六.利用Polyline + Marker的轨迹回放动画实现简易的飞线图 )
一. vue项目 中使用--初始化地图
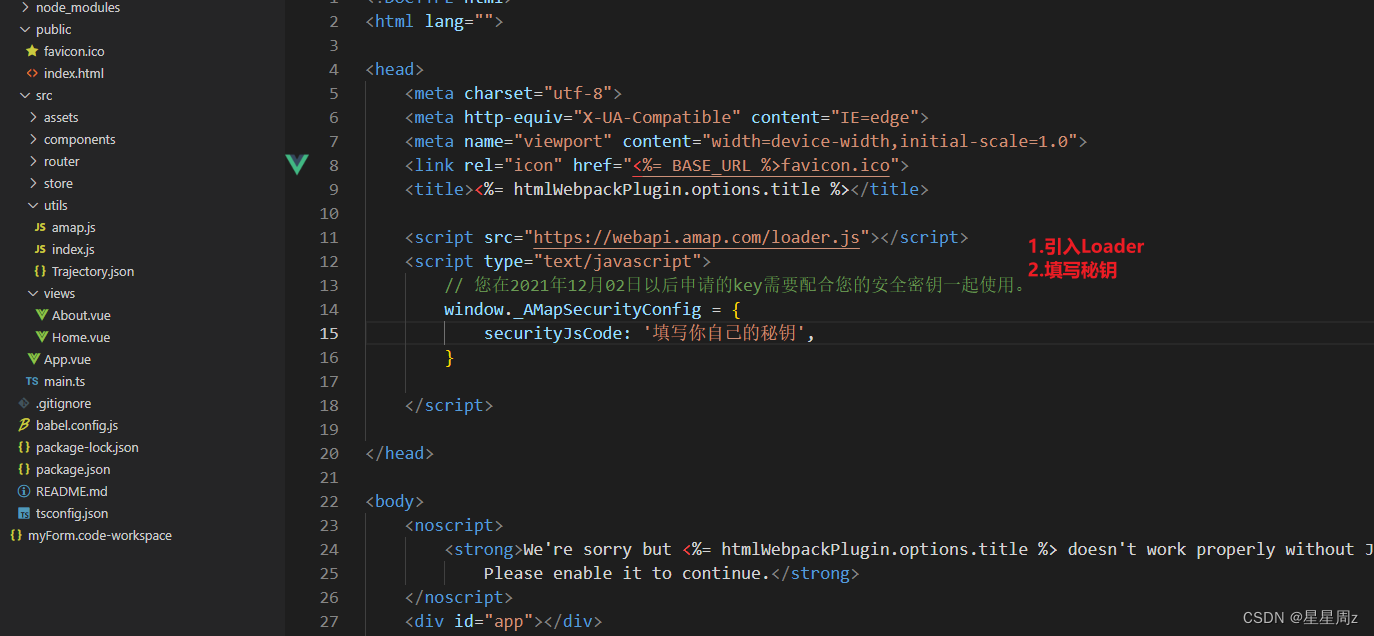
1.引入loader 并填写秘钥 (目录结构如下:Home页面为地图展示的页面)
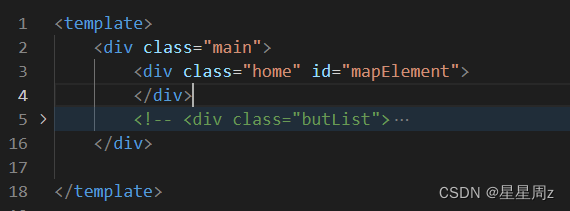
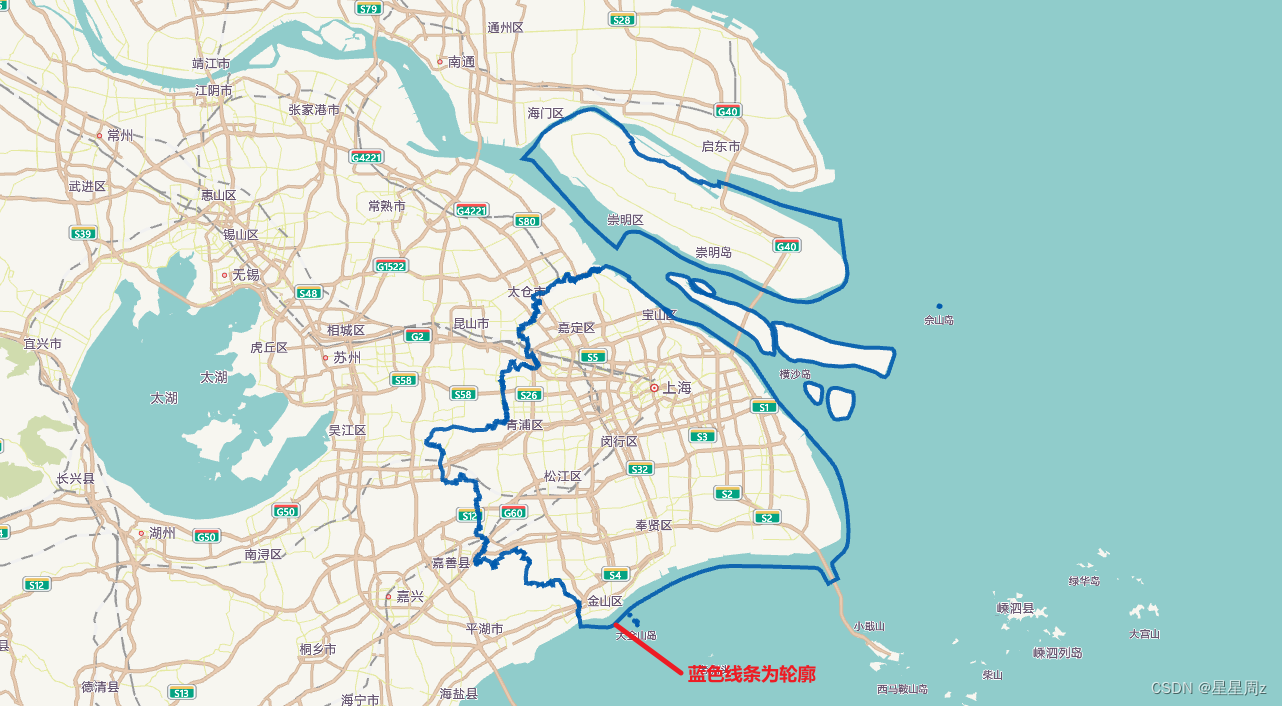
2. 页面中引入地图,并默认添加城市级轮廓线
新建utils 文件夹 下创建amap.js-----(amap.js放在了文章的末尾)
页面的使用:
<script setup>
    import myMap, {
        initMap
    } from "../utils/amap"
    import {
        onMounted
    } from "vue";
    let amap = null
    onMounted(() => {
        initMap().then(res => {
            init()
        })
    })
    const init = () => {
        amap = new myMap("mapElement", {
            viewMode: '2D', //开启3D视图,默认为关闭
        })
    }
</script>
<style lang="less">
    .main {
        position: relative;
        .home {
            width: 100%;
            height: 100vh;
        }
        .butList {
            position: absolute;
            right: 20px;
            z-index: 100;
            display: flex;
            flex-direction: column;
            top: 26px;
        }
    }
</style>
2.1:效果如图,已经成功初始化了 当前的地图,并绘制了 城市轮廓
二:地图撒点(如果是1000条以上的撒点,请自行使用海量点的方式撒点,否则会影响性能)
<template>
    <div class="main">
        <div class="home" id="mapElement">
        </div>
        <div class="butList">
            <button @click="addMask()">添加1个点位</button>
           </div>
    </div>
</template>
 // 撒点
    const addMask = () => {
        var data = { //数据源
            name:"我是傻13傻13",
            pos:[121.251581, 31.127219]
        }
        amap.addMark({
            position: data.pos,
            icon: new AMap.Icon({
                image: require('@/assets/旗子.png'),
                imageOffset: new AMap.Pixel(0, 0)
            }),
            title:data.name,
            extData:{
                ...data
            }
        })
    }
效果如图: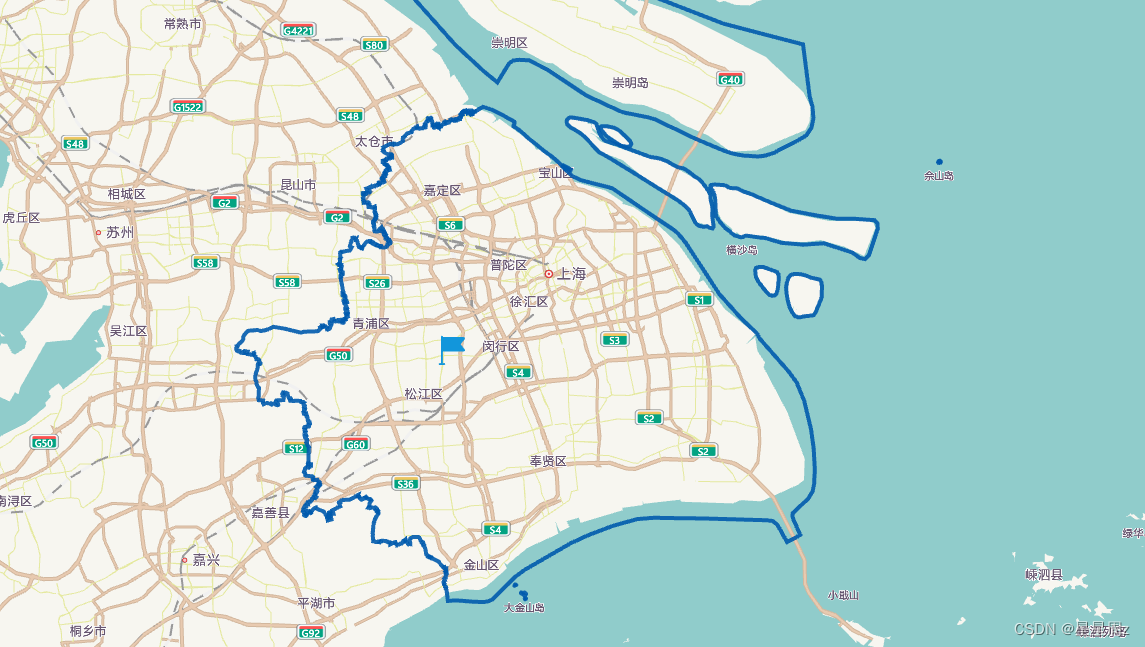
三:批量撒点+自定义弹框
   <button @click="addMaskDialog()">添加多个点位并增加弹框</button>
//使用
   const addMaskDialog = () => {
        var data = [{
                position: [121.251581, 31.127219],
                title: "标题标题标题11111",
                content: "内容1111111",
            },
            {
                position: [121.514752, 31.084229],
                title: "标题标题标题22222",
                content: "内容2222222222",
            }
        ]
        data.forEach((item) => {
            amap.addMark({
                position: item.position,
                icon: new AMap.Icon({
                    image: require('@/assets/旗子.png'),
                    imageOffset: new AMap.Pixel(0, 0)
                }),
                title:item.title,
                extData: {
                    ...item
                }
            }, (obj => {        //自定义弹框内容
                let html = `<div>
                     <p> ${obj.title}</p>
                     <p> ${obj.content}</p>
                    </div>`
                return html
            }))
        })
    }
效果如图: (点击后显示弹框)
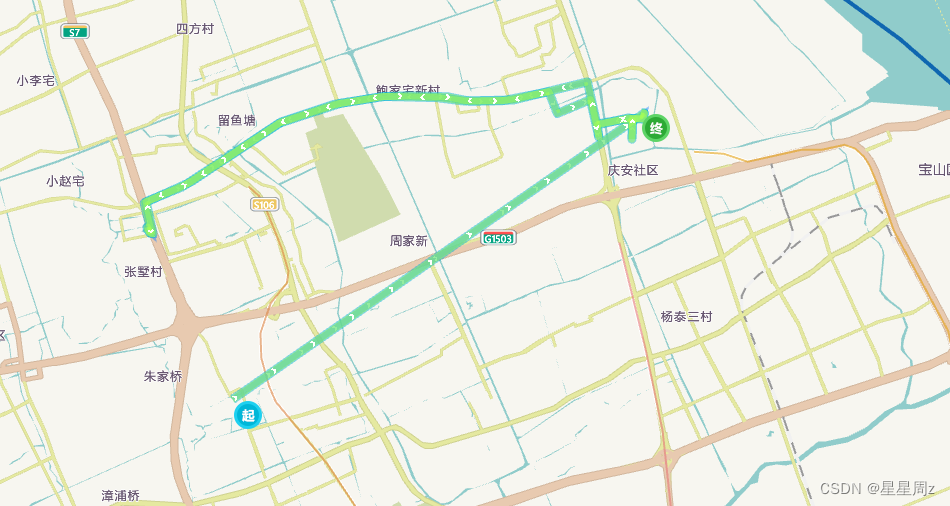
四:绘制轨迹-----并设置车辆 起点,终点
<button @click="drawTrajectory()">绘制轨迹</button>
//使用  --(TrajectoryData)为你自己的轨迹数据
//格式为 [  [121.3465860503654,31.36514270534356],[xxxx,xxx],[xxx,xxxx]... ]
  const drawTrajectory = () => {
        amap.drawTrajectory(TrajectoryData)
    }
效果如图
五:AMap.MouseTool 插件 绘制多边形
<button @click="drawElectronic()">绘制多边形(电子围栏)</button>
   const drawElectronic = () => {
        amap.drawpolygon(null, (e) => {
            console.log("绘制完毕" + e);
        })
    }
效果如图: 
六.利用Polyline + Marker的轨迹回放动画实现简易的飞线图 )
    <button @click="drawFlyLines()">绘制飞线图</button>
  const drawFlyLines = () => {
        const data = [
            [
                [121.5477, 31.31193],
                [121.5045, 31.35096],
            ],
            [
                [121.5477, 31.31193],
                [121.37117808036108, 31.396691737575335],
            ],
            [
                [121.5477, 31.31193],
                [121.38543721542061, 31.323684255209596],
            ],
            [
                [121.5477, 31.31193],
                [121.44815275644933, 31.356271308434827],
            ],
            [
                [121.5477, 31.31193],
                [121.4304612729651, 31.406328350479193],
            ]
        ]
        amap.drawFlyLines(data)
    }
效果如图 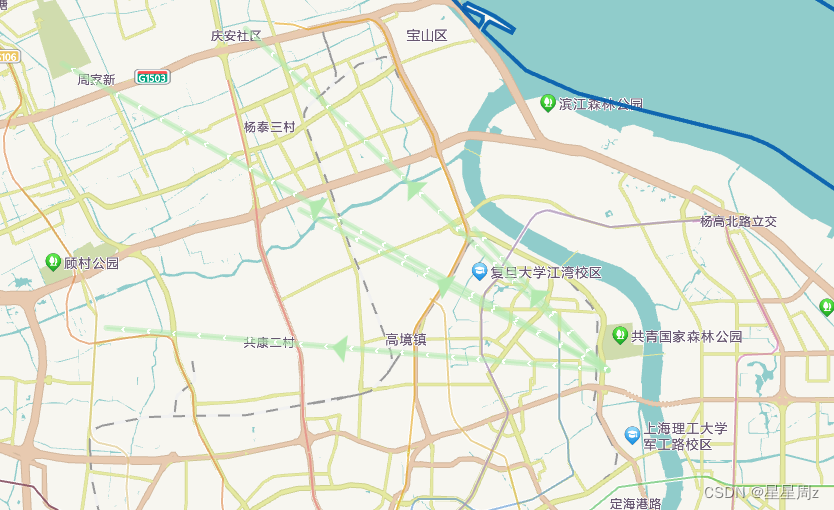
最后附上当前home页面的全部代码:
最后附上所有代码:
<template>
    <div class="main">
        <div class="home" id="mapElement">
        </div>
        <div class="butList">
            <button @click="addMask()">添加1个点位</button>
            <button @click="addMaskDialog()">添加多个点位并增加弹框</button>
            <button @click="clearMap()">清空点位</button>
            <button @click="drawTrajectory()">绘制轨迹</button>
            <button @click="drawElectronic()">绘制多边形(电子围栏)</button>
            <button @click="drawFlyLines()">绘制飞线图</button>
            <button @click="clearMap()">隐藏飞线图</button>
        </div>
    </div>
</template>
<script setup>
    import myMap, {
        initMap
    } from "../utils/amap"
    import TrajectoryData from "../utils/Trajectory.json"
    import {
        onMounted
    } from "vue";
    let amap = null
    onMounted(() => {
        initMap().then(res => {
            init()
        })
    })
    const init = () => {
        amap = new myMap("mapElement", {
            viewMode: '2D', //开启3D视图,默认为关闭
        })
    }
    // 撒点
    const addMask = () => {
        var data = { //数据源
            name: "我是傻13傻13",
            pos: [121.251581, 31.127219]
        }
        amap.addMark({
            position: data.pos,
            icon: new AMap.Icon({
                image: require('@/assets/旗子.png'),
                imageOffset: new AMap.Pixel(0, 0)
            }),
            title: data.name,
            extData: {
                ...data
            }
        })
    }
    const addMaskDialog = () => {
        var data = [{
                position: [121.251581, 31.127219],
                title: "标题标题标题11111",
                content: "内容1111111",
            },
            {
                position: [121.514752, 31.084229],
                title: "标题标题标题22222",
                content: "内容2222222222",
            }
        ]
        data.forEach((item) => {
            amap.addMark({
                position: item.position,
                icon: new AMap.Icon({
                    image: require('@/assets/旗子.png'),
                    imageOffset: new AMap.Pixel(0, 0)
                }),
                title: item.title,
                extData: {
                    ...item
                }
            }, (obj => { //自定义弹框内容
                let html = `<div>
                     <p> ${obj.title}</p>
                     <p> ${obj.content}</p>
                    </div>`
                return html
            }))
        })
    }
    const clearMap = () => {
        amap.clearMap()
    }
    const drawTrajectory = () => {
        amap.drawTrajectory(TrajectoryData)
    }
    const drawElectronic = () => {
        amap.drawpolygon(null, (e) => {
            console.log("绘制完毕" + e);
        })
    }
    const drawFlyLines = () => {
        const data = [
            [
                [121.5477, 31.31193],
                [121.5045, 31.35096],
            ],
            [
                [121.5477, 31.31193],
                [121.37117808036108, 31.396691737575335],
            ],
            [
                [121.5477, 31.31193],
                [121.38543721542061, 31.323684255209596],
            ],
            [
                [121.5477, 31.31193],
                [121.44815275644933, 31.356271308434827],
            ],
            [
                [121.5477, 31.31193],
                [121.4304612729651, 31.406328350479193],
            ]
        ]
        amap.drawFlyLines(data)
    }
</script>
<style lang="less">
    .main {
        position: relative;
        .home {
            width: 100%;
            height: 100vh;
        }
        .butList {
            position: absolute;
            right: 20px;
            z-index: 100;
            display: flex;
            flex-direction: column;
            top: 26px;
        }
    }
</style>
七:amap.js文件
import {
    filterGjData
} from "./index"
class myMap {
    constructor(el, config) {
        this.aMap = null
        this.polygonList = [] //多边形
        this.overlays = [] //地图上的覆盖物
        if (el) {
            this.init(el, config)
        }
    }
    /**
     * 地图初始化
     * @param {dom元素} el
     * @param {配置参数} config 对传入的配置合并
     */
    init(el, config) {
        let setConf = {
            mapStyle: 'amap://styles/fresh', //设置地图的显示样式
            rotateEnable: false,
            pitchEnable: false,
            resizeEnable: true,
            zoom: 12.5,
            pitch: 45, //45度俯视
            // rotation: 45,
            viewMode: '3D', //开启3D视图,默认为关闭
            zooms: [2, 20],
            skyColor: "#002d56", //天空颜色 倾斜后才会产生 仅限于3D 模式下
            center: [121.489612, 31.405457], //中心点
        }
        this.aMap = new AMap.Map(el, {
            ...setConf,
            ...config
        });
        this.sketchContours()
    }
    /**
     * 默认添加地图城市级边阔
     * https://lbs.amap.com/api/javascript-api-v2/guide/services/district-search
     * @param {initconfig}:  Polygon的样式
     */
    sketchContours(initconfig) {
        let that = this
        let mapConfig = {
            strokeWeight: 4,
            strokeColor: '#005aad', //轮廓边框颜色
            fillColor: '', //填充的背景色
            fillOpacity: 0.3,
            bubble: true //覆盖物的点击事件冒泡到地图上
        }
        Object.assign(mapConfig, initconfig)
        let district = new AMap.DistrictSearch({ // 创建行政区查询对象
            extensions: 'all', // 返回行政区边界坐标等具体信息
            level: 'city' // 设置查询行政区级别为 省
        });
        district.search("上海市", function (status, result) {
            if (Object.keys(result).length <= 0) {
                return
            }
            let holes = result.districtList[0].boundaries
            for (let i = 0, l = holes.length; i < l; i++) {
                let polygon = new AMap.Polygon({
                    map: that.aMap,
                    ...mapConfig,
                    path: holes[i]
                });
                that.aMap.add(polygon)
                that.aMap.setFitView(); // 地图自适应 调整视野
            }
        })
    }
    /**
     * 对外暴露的amap,可自行获取map对象
     */
    getMap() {
        return this.aMap
    }
    /**
     * 撒点
     * @param {config}
     * @param {content} HTML要素字符串
     * @param {contentCallBack} 在此回调函数中可以获取到自定义的数据 返回值以供弹框展示内容
     */
    addMark(config, contentCallBack) {
        const oldconfig = {
            clickable: true, //点标记是否可点击
            position: [], //经纬度
            icon: "https://vdata.amap.com/icons/b18/1/2.png", //点标记图片
            extData: { //自定义属性
            }
        }
        Object.assign(oldconfig, config)
        let marker = new AMap.Marker({
            map: this.aMap,
            ...oldconfig
        });
        this.aMap.add(marker);
        this.overlays.push(marker)
        let userData = marker.getExtData()

        if (contentCallBack) {
            marker.on('click', (e) => {
                this.openInfoWindow(userData, contentCallBack(userData)) //自定义信息窗体
            })
        }
        this.aMap.setFitView();
    }
    openInfoWindow(data, content) {
        let infoWindow = new AMap.InfoWindow({
            content,
            anchor: 'bottom-center',
            offset: [16, 0]
        });
        infoWindow.open(this.aMap, data.position); //信息窗体打开
        this.aMap.setFitView();
    }
    /**
     * 清除地图覆盖物(不包括轮廓)包括停止轨迹
     */
    clearMap() {
        this.aMap.clearInfoWindow()
        this.overlays.forEach(item => {
            if (item.type == "AMap.Marker" && item.getExtData() == "stopdrawGj") {
                item.stopMove();
            }
            item.remove()
        })
    }
    /**
     *
     * @param {轨迹数据 cj02坐标} arrPath :[[121.4363,31.222],[121.4363,31.222],[121.4363,31.222]....]
     * @param {*轨迹线条样式} options
     * 内含车辆开始位置,结束位置,以及车辆运行时轨迹动画
     * 如果是成千上万条的轨迹数据 得使用https://lbs.amap.com/api/amap-ui/reference-amap-ui/mass-data/pathsimplifier 组件
     */
    drawTrajectory(arrPath, options) {
        let PolylineStyle = {
            strokeColor: "#AF5", //线颜色
            strokeWeight: 7, //线宽
            lineJoin: 'round',
            isOutline: true,
            showDir: true, //显示箭头  3D 模式下不支持
            borderWeight: 1,
            dirColor: '#fff',
            strokeStyle: "solid" //线样式
        }
        Object.assign(PolylineStyle, options)
        var start = arrPath[0] //开始点
        var end = arrPath[arrPath.length - 1] //结束点
        this.addMark({
            position: start,
            icon: new AMap.Icon({
                image: require('@/assets/start.png'),
                imageOffset: new AMap.Pixel(0, 0)
            })
        })
        const travelCar = new AMap.Marker({
            map: this.aMap,
            position: start,
            icon: new AMap.Icon({
                image: "https://a.amap.com/jsapi_demos/static/demo-center-v2/car.png", //注意车头的方向
                imageOffset: new AMap.Pixel(0, 0)
            }),
            offset: new AMap.Pixel(-13, -26),
            extData: 'stopdrawGj'
        });
        var polylines = new AMap.Polyline({ //此处对比 arrPath 与filterGjData(arrPath) 简化后 之后的轨迹路线是一致的,
            map: this.aMap,
            path: arrPath,
            showDir: true,
            strokeColor: "#28F", //线颜色
            strokeWeight: 6, //线宽
        });
        const polyline = new AMap.Polyline({
            map: this.aMap,
            ...PolylineStyle
        });
        this.aMap.setFitView(polyline);
        travelCar.on('moving', ((e) => {
            polyline.setPath(e.passedPath);
            this.aMap.setCenter(e.target.getPosition(), true)
        }));
        function startTraGj(data) { //开始绘制轨迹
            travelCar.moveAlong(data, {
                // // 每一段的时长
                duration: 200,
                // JSAPI2.0 是否延道路自动设置角度在 moveAlong 里设置
                autoRotation: true,
            });
        }
        startTraGj(filterGjData(arrPath)) //对于每秒钟接收的轨迹数据 做简化,否则会卡顿且会被延迟播放
        travelCar.on('movealong', ((e) => { //最终动画执行结束
            this.addMark({
                icon: new AMap.Icon({
                    image: require('@/assets/end.png'),
                    imageOffset: new AMap.Pixel(0, 0)
                }),
                position: end,
            })
            travelCar.hide()
        }));

        this.overlays.push(travelCar, polyline, polylines)
    }
    /**
     *  使用mouseTool 插件 绘制电子围栏
     *  鼠标单击地图选点/线,右键结束
     * @param {isbatch : 是否批量绘制 电子围栏(多边形)} isbatch ? '每次只能绘制一个' : '不限制'
     * @param {drawCompletedfn} 每次绘制完毕的回调
     */
    drawpolygon(nobatch,drawCompletedfn) {
        const mouseTool = new AMap.MouseTool(this.aMap);
        mouseTool.polygon({
            map: this.aMap,
            fillColor: '#00b0ff',
            strokeColor: '#80d8ff'
        });
        mouseTool.on('draw', (e) => { //每次绘制完图形的回调
            if(drawCompletedfn){
                drawCompletedfn(e)
            }
            if (nobatch) {
                if (this.polygonList.length) {
                    this.aMap.remove(this.polygonList)
                    this.polygonList = []
                }
            }
            this.polygonList.push(e.obj);
        })
    }
    /**
     * 获取绘制的图形 的路径
     * @return [[path1],[path2]]
     */
    getDrawedpolygon() {
        return this.polygonList.map(item => {
            return [item.getPath()]
        })
    }
    /**
     * 利用Polyline + Marker的轨迹回放动画 实现简易的飞线图
     *  @param {data}[[[121.5477, 31.31193],[121.5477, 31.31193]],]
     */
    drawFlyLines(data) {
        data.forEach(item => {
            const linePath = new AMap.Polyline({
                map: this.aMap,
                path: item,
                strokeColor: "#b3e9af", //线颜色
            });
            const line = new AMap.Polyline({
                map: this.aMap,
                path: item,
                showDir: true,
                strokeColor: "#b3e9af", //线颜色
                strokeWeight: 6, //线宽
                lineCap: "round",
                zIndex: 100,
                cursor: "pointer",
                strokeStyle: "solid" //线样式
            });
            line.on('mouseover', (e) => { //如果需要添加鼠标移至线段上 显示文本 则可以通过e.pixel.x/y, 动态设置某个div的postition用来显示即可
                let postition = { //针对于当前地图的px
                    left: e.pixel.x,
                    top: e.pixel.y,
                }
            })
            line.on('mouseout', (e) => {
            })
            const flyIcon = new AMap.Marker({
                map: this.aMap,
                position: item[0],
                icon: new AMap.Icon({
                    image: require('@/assets/rightHeader.png'),
                    imageOffset: new AMap.Pixel(0, 0)
                }),
                offset: new AMap.Pixel(-16, -16),
                extData: 'stopdrawGj'
            });
            flyIcon.moveAlong(item, {
                duration: 4000,
                autoRotation: true,
                circlable: true //循环
            });
            this.overlays.push(flyIcon, line, linePath)
        })
    }
}
export function initMap() {
    return new Promise((resolve, reject) => {
        AMapLoader.load({
            "key": "填写你自己的key", // 申请好的Web端开发者Key,首次调用 load 时必填
            "version": "2.0", // 指定要加载的 JS API 的版本,缺省时默认为 1.4.15
            "plugins": [
                "AMap.MoveAnimation,AMap.MouseTool,AMap.PlaceSearch,AMap.DistrictSearch"
            ], // 需要使用的的插件列表,如比例尺'AMap.Scale'等
            // "AMapUI": { // 是否加载 AMapUI,缺省不加载
            //     "version": '1.1', // AMapUI 版本
            //     "plugins": [], // 需要加载的 AMapUI ui插件
            // },
            // "Loca": { // 是否加载 Loca, 缺省不加载
            //     "version": '2.0' // Loca 版本
            // },
        }).then((AMap) => {
            window.AMap = AMap
            resolve(AMap)
        }).catch((e) => {
            console.error(e); //加载错误提示
            reject(e)
        });
    })
}
export default myMap


//filterGjData方法:
/**
 * 对于每秒钟记录的轨迹数据 简化,如上一秒的轨迹与下一秒的轨迹数据一致 则删除下一次的轨迹
 * 如:[
    [
        121.3465860503654,
        31.36514270534356
    ],
    [
        121.3465860503654,
        31.36514270534356
    ],
    [
        121.3465860503654,
        31.36514270534356
    ],
    [
        121.3465860503654,
        31.36514270534356
    ],
    [
        121.3465860503654,
        31.36514270534356
    ],
    [
        121.6444464646,
        31.36514270534356
    ],[
        121.888888888888,
        31.36514270534356
    ],]
 * @param {} data
 * @returns {最终只需要 [[121.3465860503654,31.36514270534356],[121.6444464646,31.36514270534356],[121.888888888888,31.36514270534356
    ]] }
 */
export function filterGjData(data) {
    for (let i = 0; i < data.length; i++) {
        let item1 = data[i]
        if (i + 1 == data.length) {
            break;
        } else {
            let item2 = data[i + 1]
            if (item1[0] == item2[0] && item1[1] == item2[1]) {
                data.splice(i, 1)
                i--
            }
        }
    }
    return data
}