Landtrendr的原理图
APP(https://emaprlab.users.earthengine.app/view/lt-gee-pixel-time-series)
扰动年份和最大扰动幅度运算,源码:(https://blog.csdn.net/qq_35591253/article/details/115332724)

Bfast原理
R语言代码(http://bfast.r-forge.r-project.org/)
APP(https://andreim.users.earthengine.app/view/bfastmonitor)

Fitted seasonal, trend and remainder (i.e. estimated noise) components for a 16-day MODIS NDVI time series (data series) of a pine plantation in the northern part of the study area. Three abrupt changes are detected in the trend component of the time series. Time (- - -), corresponding conidence interval (red), direction and magnitude of abrupt change and slope of the gradual change are shown in the estimated trend component. The solid bars on the right hand side of the plot show the same data range, to aid comparisons.

Simulated 16-day MODIS NDVI time series. The period from 2004 until mid-2010 (i.e., the time step just before the simulated break), is considered the history period and the period after the simulated break is the monitoring period (grey background). The monitoring period contains 6 observations. The result of the monitoring approach is shown: A stable history period is identified within the history period (i.e., 2007 until mid-2010) and used to model and predict the normal data variation (blue dashed line) to enable disturbance detection. Here, a disturbance is detected after 3 observations in the monitoring period (green vertical line)."

所谓分解就是将时序数据分离成不同的成分。它主要将时序数据分离成长期趋势、季节趋势和随机成分。
CODED(连续退化检测)方法检测植被退化
APP(https://bullocke.users.earthengine.app/view/amazonsamples)
图4.多时间特征叠加(如土壤分数)的简图分类系统。将一个示例像素(底部为黑线)与退化区域的典型特征(顶部为有色线)进行比较,并将其划分为最佳拟合线。

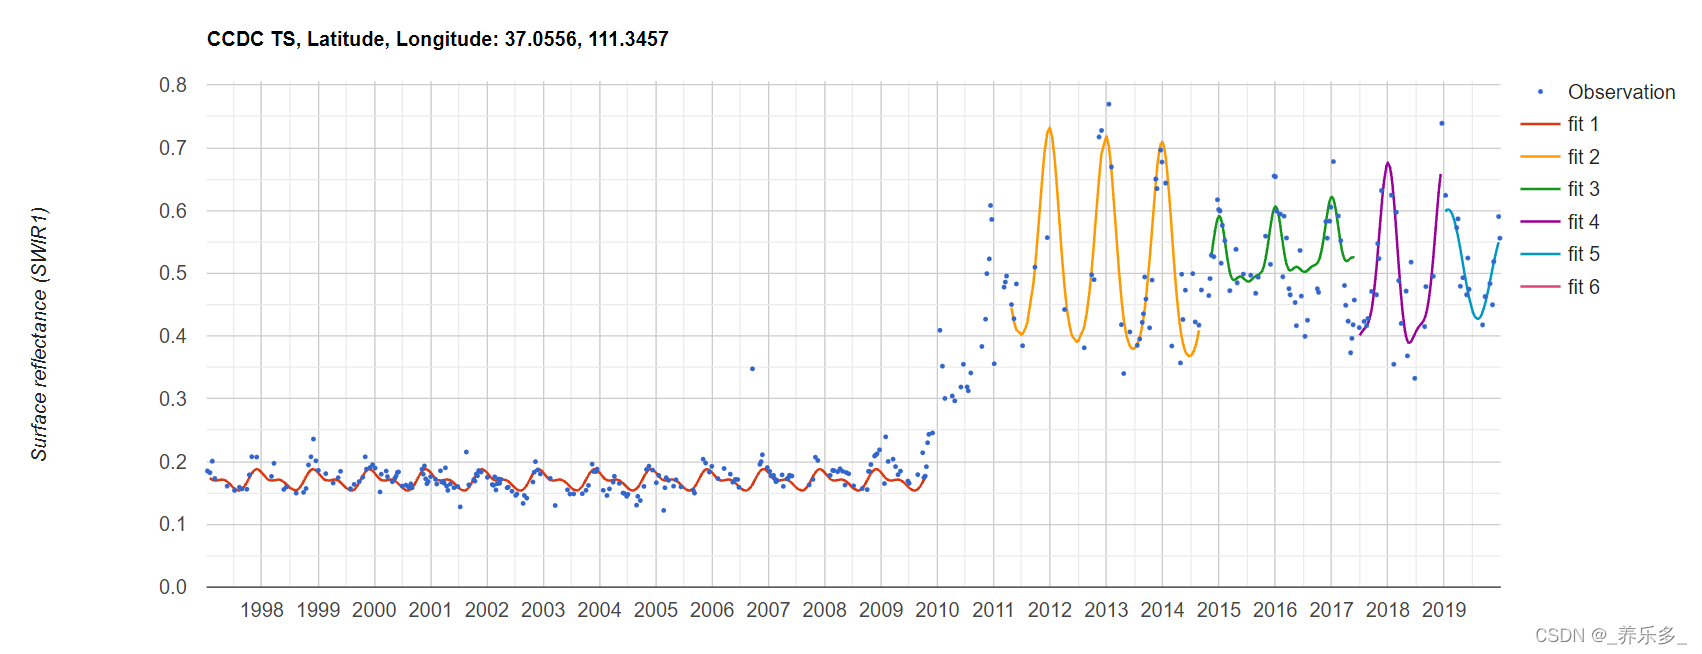
CCDC(连续变化检测和分类)
APP(https://parevalo_bu.users.earthengine.app/)
CCDC的APP和API说明文档(https://gee-ccdc-tools.readthedocs.io/en/latest/ccdc.html)