1.波士顿房价数据集
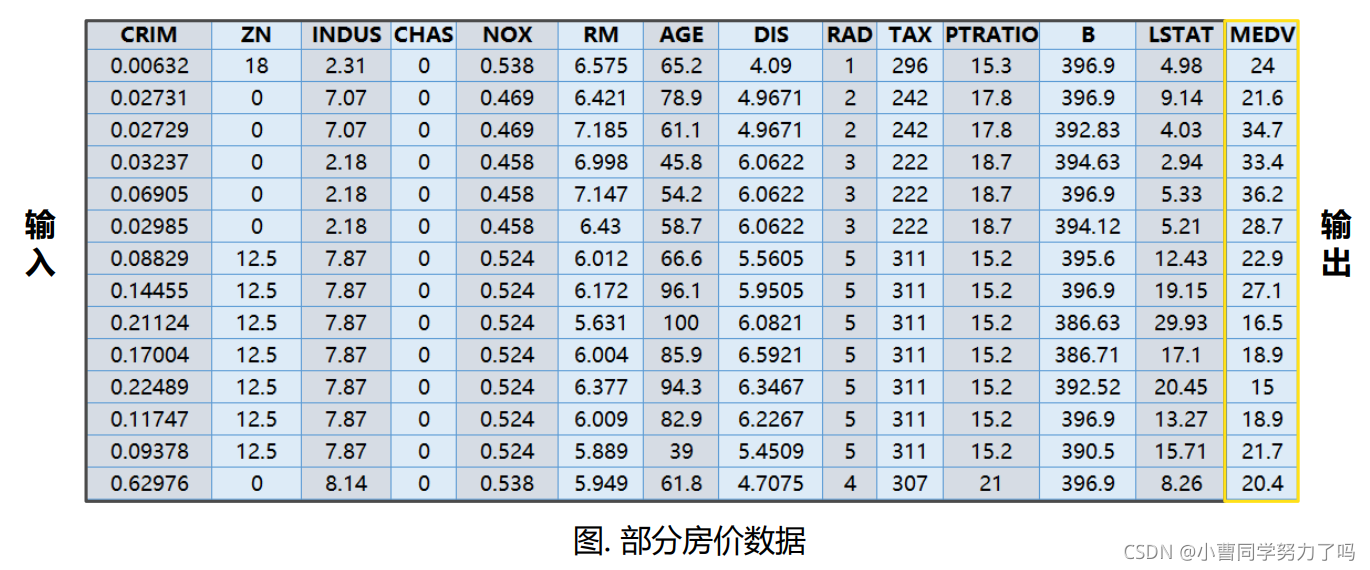

from sklearn.datasets import load_boston
boston = load_boston()
print(boston.data.shape)

from sklearn.datasets import load_boston
data, target = load_boston(return_X_y=True)
print(data.shape)
print(target.shape)#target就是价格 data即属性
2.鸢尾花数据集
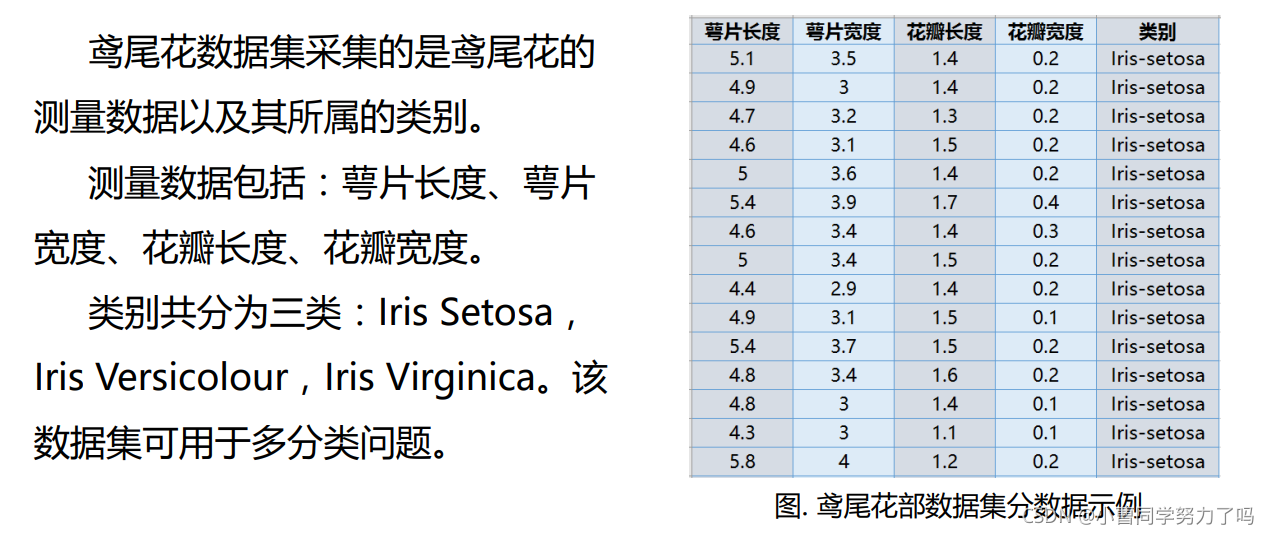
#鸢尾花数据集演示
from sklearn.datasets import load_iris
iris = load_iris()
print(iris.data.shape)
print(iris.target.shape)
print(list(iris.target_names))
3.手写数字数据集
#手写数字数据集演示
#手写数字数据集包括1797个0-9的手写数字数据,每个数字由8*8大小的矩阵构成,矩阵中值的范围是0-16,代表颜色的深度。
from sklearn.datasets import load_digits
digits = load_digits()
print(digits.data.shape)
print(digits.target.shape)
print(digits.images.shape)
import matplotlib.pyplot as plt
plt.matshow(digits.images[641])
plt.show()