多维时序 | MATLAB实现基于VMD-SSA-LSSVM、SSA-LSSVM、VMD-LSSVM、LSSVM的多变量时间序列预测对比
预测效果


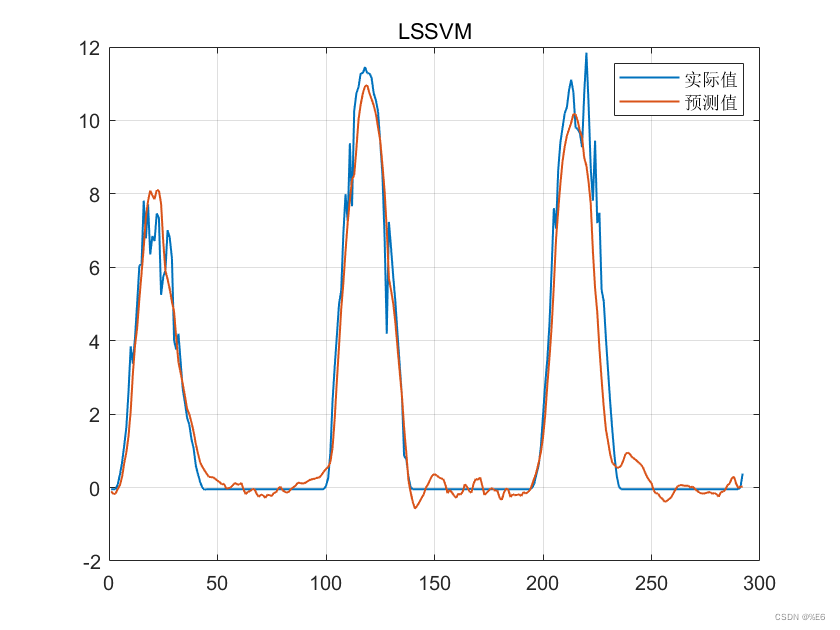
基本介绍
多维时序 | MATLAB实现基于VMD-SSA-LSSVM、SSA-LSSVM、VMD-LSSVM、LSSVM的多变量时间序列预测对比。
1.MATLAB实现基于VMD-SSA-LSSVM、SSA-LSSVM、VMD-LSSVM、LSSVM的多变量时间序列预测对比;
2.运行环境为Matlab2018b;
3.输入多个特征,输出单个变量,多变量时间序列预测;
4.data为数据集,所有文件放在一个文件夹;
5.命令窗口输出RMSE、MAE、MAPE多指标评价;
程序设计
- 完整程序和数据获取方式1:私信博主;
- 完整程序和数据获取方式2:同等价值程序兑换;
clc;clear;close all;format compact
addpath(genpath('LSSVMlabv1_8'));
unction [bestX,Convergence_curve]=ssa_lssvm(typeID,Kernel_type,inputn_train,label_train,inputn_test,label_test)
%% 麻雀优化
pop=10; % 麻雀数
M=10; % Maximum numbef of iterations
c=1;
d=10000;
dim=2;

P_percent = 0.2;    % The population size of producers accounts for "P_percent" percent of the total population size
%%%%%%%%%%%%%%%%%%%%%%%%%%%%%%%%%%%%%%%%%%%%%%%%%%%%%%
pNum = round( pop *  P_percent );    % The population size of the producers
lb= c.*ones( 1,dim );    % Lower limit/bounds/     a vector
ub= d.*ones( 1,dim );    % Upper limit/bounds/     a vector
%Initialization
for i = 1 : pop
    x( i, : ) = lb + (ub - lb) .* rand( 1, dim );
    fit( i )=fitness(x(i,:),inputn_train,label_train,inputn_test,label_test,typeID,Kernel_type);
end
pFit = fit;
pX = x;                            % The individual's best position corresponding to the pFit
[ fMin, bestI ] = min( fit );      % fMin denotes the global optimum fitness value
bestX = x( bestI, : );             % bestX denotes the global optimum position corresponding to fMin

for t = 1 : M

    [ ans, sortIndex ] = sort( pFit );% Sort.
    [fmax,B]=max( pFit );
    worse= x(B,:);
    r2=rand(1);
    %%%%%%%%%%%%%5%%%%%%这一部位为发现者(探索者)的位置更新%%%%%%%%%%%%%%%%%%%%%%%%%
    if(r2<0.8)%预警值较小,说明没有捕食者出现
        for i = 1 : pNum  %r2小于0.8的发现者的改变(1-20)                                                 % Equation (3)
            r1=rand(1);
            x( sortIndex( i ), : ) = pX( sortIndex( i ), : )*exp(-(i)/(r1*M));%对自变量做一个随机变换
            x( sortIndex( i ), : ) = Bounds( x( sortIndex( i ), : ), lb, ub );%对超过边界的变量进行去除

            fit( sortIndex( i ) )=fitness(x(sortIndex( i ),:),inputn_train,label_train,inputn_test,label_test,typeID,Kernel_type);

        end
    else   %预警值较大,说明有捕食者出现威胁到了种群的安全,需要去其它地方觅食
        for i = 1 : pNum   %r2大于0.8的发现者的改变
            x( sortIndex( i ), : ) = pX( sortIndex( i ), : )+randn(1)*ones(1,dim);
            x( sortIndex( i ), : ) = Bounds( x( sortIndex( i ), : ), lb, ub );
            fit( sortIndex( i ) )=fitness(x(sortIndex( i ),:),inputn_train,label_train,inputn_test,label_test,typeID,Kernel_type);

        end

    end
    [ fMMin, bestII ] = min( fit );
    bestXX = x( bestII, : );
    %%%%%%%%%%%%%5%%%%%%这一部位为加入者(追随者)的位置更新%%%%%%%%%%%%%%%%%%%%%%%%%
    for i = ( pNum + 1 ) : pop     %剩下20-100的个体的变换                % Equation (4)

        A=floor(rand(1,dim)*2)*2-1;
        if( i>(pop/2))%这个代表这部分麻雀处于十分饥饿的状态(因为它们的能量很低,也是是适应度值很差),需要到其它地方觅食
            x( sortIndex(i ), : )=randn(1)*exp((worse-pX( sortIndex( i ), : ))/(i)^2);
        else%这一部分追随者是围绕最好的发现者周围进行觅食,其间也有可能发生食物的争夺,使其自己变成生产者
            x( sortIndex( i ), : )=bestXX+(abs(( pX( sortIndex( i ), : )-bestXX)))*(A'*(A*A')^(-1))*ones(1,dim);
        end
        x( sortIndex( i ), : ) = Bounds( x( sortIndex( i ), : ), lb, ub );%判断边界是否超出

        fit( sortIndex( i ) )=fitness(x(sortIndex( i ),:),inputn_train,label_train,inputn_test,label_test,typeID,Kernel_type);

    end
    %%%%%%%%%%%%%5%%%%%%这一部位为意识到危险(注意这里只是意识到了危险,不代表出现了真正的捕食者)的麻雀的位置更新%%%%%%%%%%%%%%%%%%%%%%%%%
    c=randperm(numel(sortIndex));%%%%%%%%%这个的作用是在种群中随机产生其位置(也就是这部分的麻雀位置一开始是随机的,意识到危险了要进行位置移动,
    %处于种群外围的麻雀向安全区域靠拢,处在种群中心的麻雀则随机行走以靠近别的麻雀)
    b=sortIndex(c(1:10));
    for j =  1  : length(b)      % Equation (5)
        if( pFit( sortIndex( b(j) ) )>(fMin) ) %处于种群外围的麻雀的位置改变
            x( sortIndex( b(j) ), : )=bestX+(randn(1,dim)).*(abs(( pX( sortIndex( b(j) ), : ) -bestX)));
        else                       %处于种群中心的麻雀的位置改变
            x( sortIndex( b(j) ), : ) =pX( sortIndex( b(j) ), : )+(2*rand(1)-1)*(abs(pX( sortIndex( b(j) ), : )-worse))/ ( pFit( sortIndex( b(j) ) )-fmax+1e-50);
        end
        x( sortIndex(b(j) ), : ) = Bounds( x( sortIndex(b(j) ), : ), lb, ub );

        fit( sortIndex( b(j) ) )=fitness(x(sortIndex(b(j) ),:),inputn_train,label_train,inputn_test,label_test,typeID,Kernel_type);

    end
    for i = 1 : pop
        if ( fit( i ) < pFit( i ) )
            pFit( i ) = fit( i );
            pX( i, : ) = x( i, : );
        end
        if( pFit( i ) < fMin )
            fMin= pFit( i );
            bestX = pX( i, : );
        end
    end
    Convergence_curve(t,:)=[fMin mean(pFit)];
end
学习总结
- 一些基本的思路和步骤来实现多变量时间序列预测。
VMD-SSA-LSSVM、SSA-LSSVM、VMD-LSSVM是一些用于多变量时间序列预测的方法,它们都涉及到信号分解和机器学习技术。下面是对这些方法的简要介绍:
VMD-SSA-LSSVM:这是一种基于变分模态分解(VMD)和麻雀算法优化(SSA)的支持向量机(SVM)模型。VMD是一种信号分解方法,可以将信号分解成多个振荡模态,并且每个模态具有不同的频率和振幅。SSA是一种智能优化算法的方法,可以将信号分解成多个本征模态。VMD-SSA-LSSVM将VMD和SSA结合起来,用于多变量时间序列的降维和智能优化,并且利用LSSVM进行预测。
SSA-LSSVM:这是一种基于麻雀算法和支持向量机的模型。它使用SSA智能寻参,然后使用LSSVM进行预测。相比于传统的LSSVM模型,SSA-LSSVM可以提高预测的准确性和稳定性。
VMD-LSSVM:这是一种基于变分模态分解和支持向量机的模型。它使用VMD将多变量时间序列分解成多个振荡模态,并且将每个模态作为输入特征向量,然后使用LSSVM进行预测。VMD-LSSVM可以提高预测的准确性和鲁棒性,特别是对于非平稳和非线性的多变量时间序列。
- 以上是一个基本的多变量时间序列预测的实现步骤和思路,具体的实现细节需要根据数据和模型的具体情况进行调整。
参考资料
[1] https://blog.csdn.net/kjm13182345320/category_11799242.html?spm=1001.2014.3001.5482
[2] https://blog.csdn.net/kjm13182345320/article/details/124571691