前情回顾:
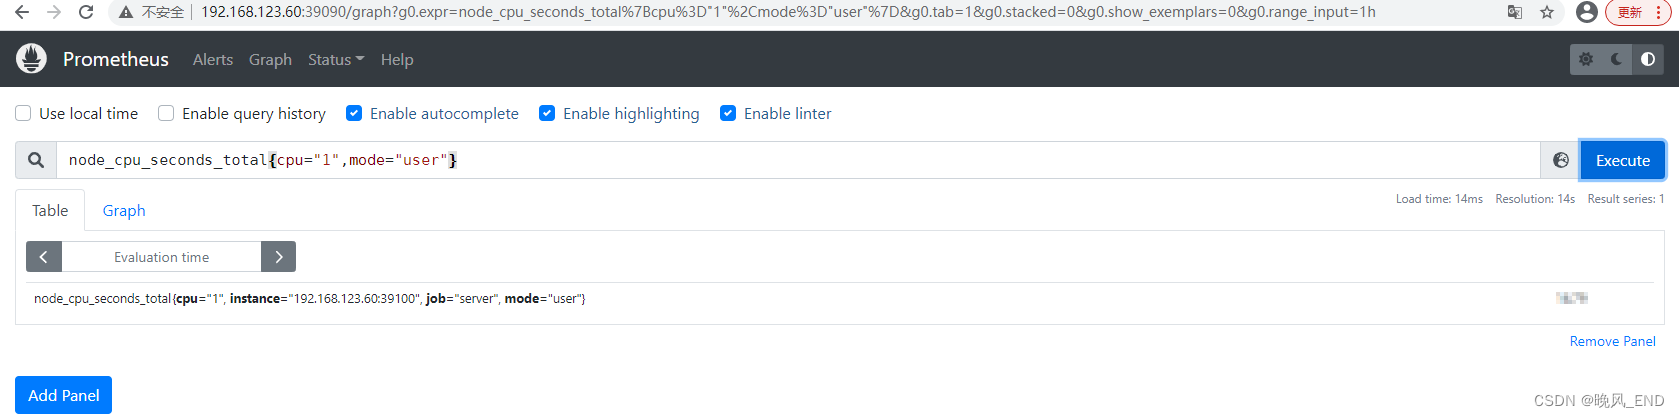
二进制prometheus部署完成后,在prometheus的web界面进行一些数据验证工作。
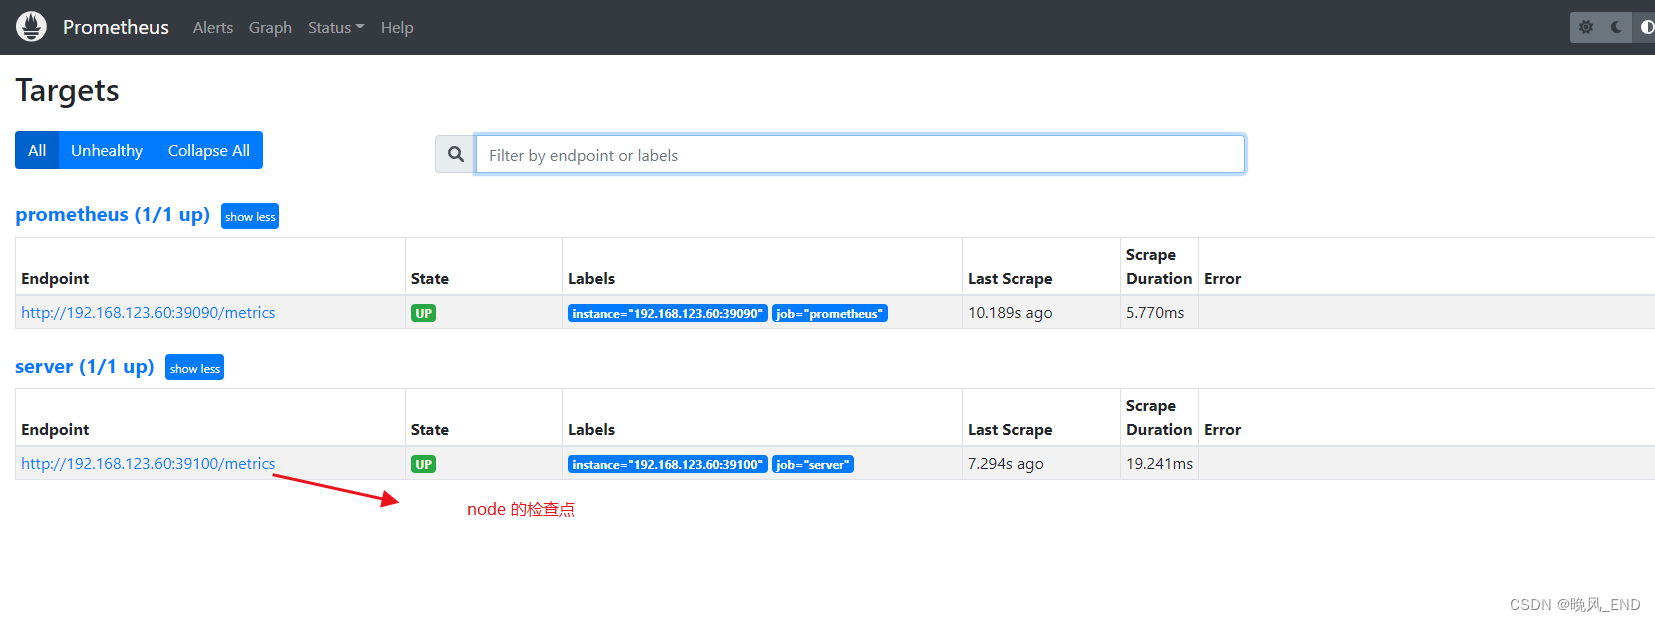
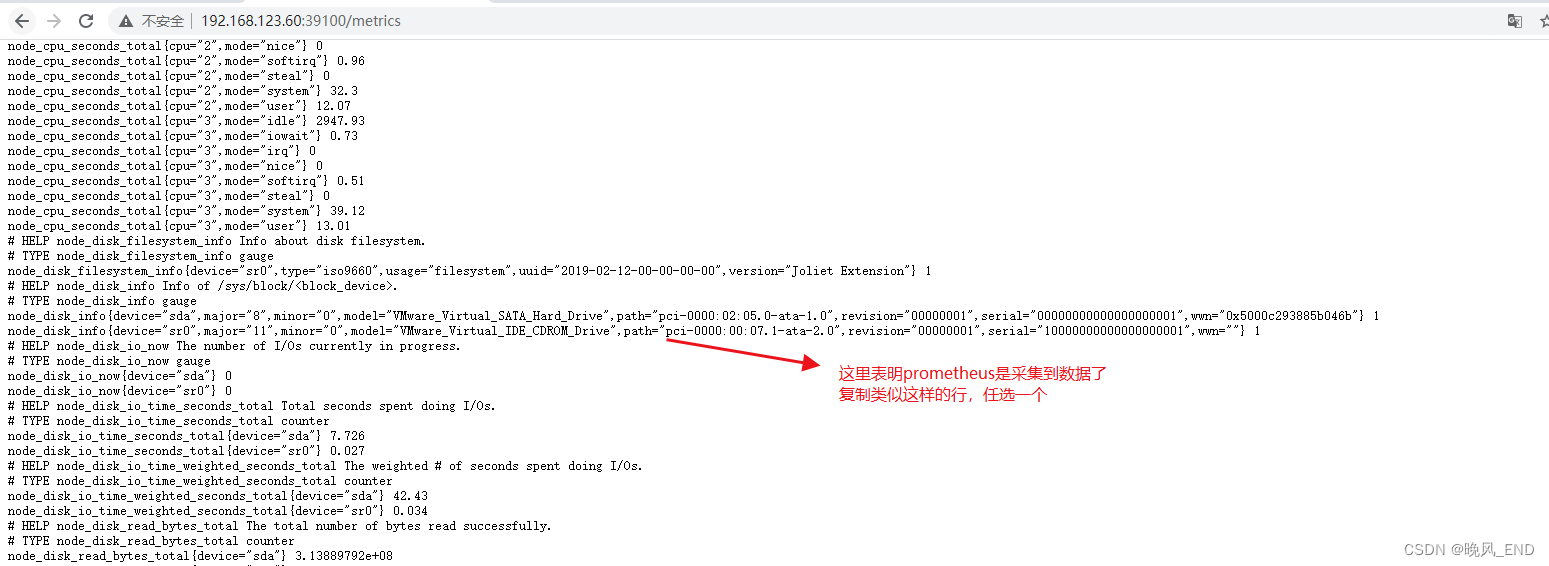
下面这个是我已经恢复正常的,其实是查询不到数据的
grafana也接收不到任何数据
问题排查:
查看系统日志 /var/log/messages ,有很多飘红,内容如下:
2023-03-05T10:04:43.421936+08:00 EULER1 prometheus: ts=2023-03-05T02:04:43.420Z caller=scrape.go:1604 level=warn component="scrape manager" scrape_pool=prometheus target=http://192.168.123.60:39090/metrics msg="Error on ingesting samples that are too old or are too far into the future" num_dropped=585
2023-03-05T10:04:43.422722+08:00 EULER1 prometheus: ts=2023-03-05T02:04:43.420Z caller=scrape.go:1338 level=warn component="scrape manager" scrape_pool=prometheus target=http://192.168.123.60:39090/metrics msg="Append failed" err="out of bounds"
2023-03-05T10:04:46.332122+08:00 EULER1 prometheus: ts=2023-03-05T02:04:46.331Z caller=scrape.go:1604 level=warn component="scrape manager" scrape_pool=server target=http://192.168.123.60:39100/metrics msg="Error on ingesting samples that are too old or are too far into the future" num_dropped=489
2023-03-05T10:04:46.332823+08:00 EULER1 prometheus: ts=2023-03-05T02:04:46.331Z caller=scrape.go:1338 level=warn component="scrape manager" scrape_pool=server target=http://192.168.123.60:39100/metrics msg="Append failed" err="out of bounds"
2023-03-05T10:04:53.220008+08:00 EULER1 grafana: logger=context userId=1 orgId=1 uname=admin t=2023-03-05T10:04:53.218709394+08:00 level=info msg="Request Completed" method=GET path=/api/live/ws status=-1 remote_addr=192.168.123.1 time_ms=34 duration=34.438488ms size=0 referer= handler=/api/live/ws
2023-03-05T10:04:58.421342+08:00 EULER1 prometheus: ts=2023-03-05T02:04:58.420Z caller=scrape.go:1604 level=warn component="scrape manager" scrape_pool=prometheus target=http://192.168.123.60:39090/metrics msg="Error on ingesting samples that are too old or are too far into the future" num_dropped=585
2023-03-05T10:04:58.422096+08:00 EULER1 prometheus: ts=2023-03-05T02:04:58.420Z caller=scrape.go:1338 level=warn component="scrape manager" scrape_pool=prometheus target=http://192.168.123.60:39090/metrics msg="Append failed" err="out of bounds"
2023-03-05T10:05:01.324456+08:00 EULER1 prometheus: ts=2023-03-05T02:05:01.323Z caller=scrape.go:1604 level=warn component="scrape manager" scrape_pool=server target=http://192.168.123.60:39100/metrics msg="Error on ingesting samples that are too old or are too far into the future" num_dropped=489
2023-03-05T10:05:01.324838+08:00 EULER1 prometheus: ts=2023-03-05T02:05:01.323Z caller=scrape.go:1338 level=warn component="scrape manager" scrape_pool=server target=http://192.168.123.60:39100/metrics msg="Append failed" err="out of bounds"
2023-03-05T10:05:13.423583+08:00 EULER1 prometheus: ts=2023-03-05T02:05:13.422Z caller=scrape.go:1604 level=warn component="scrape manager" scrape_pool=prometheus target=http://192.168.123.60:39090/metrics msg="Error on ingesting samples that are too old or are too far into the future" num_dropped=585
2023-03-05T10:05:13.424362+08:00 EULER1 prometheus: ts=2023-03-05T02:05:13.422Z caller=scrape.go:1338 level=warn component="scrape manager" scrape_pool=prometheus target=http://192.168.123.60:39090/metrics msg="Append failed" err="out of bounds"
2023-03-05T10:05:16.330791+08:00 EULER1 prometheus: ts=2023-03-05T02:05:16.329Z caller=scrape.go:1604 level=warn component="scrape manager" scrape_pool=server target=http://192.168.123.60:39100/metrics msg="Error on ingesting samples that are too old or are too far into the future" num_dropped=489
以上报错的意思是由于时间不正常,时序数据库出现异常。
查看系统时间,是正常的,并且已经同步过阿里云的时间服务器,同步命令如下:
[root@EULER1 tsdb_data]# ntpdate ntp.aliyun.com
11 Mar 20:08:29 ntpdate[53501]: adjust time server 203.107.6.88 offset 0.001621 sec
整个就是无语,完全没有想法的状态。
解决方案:
后面仔细考虑了一下部署前后的操作,其中有一个细节,是prometheus server服务启动后,查看了服务状态,确认状态正常后,又修改了时区,因为系统时间不知道怎么回事,又回到了西八区,因此,再次改为东八区,命令如下:
rm -rf /etc/localtime
ln -sf /usr/share/zoneinfo/Asia/Shanghai /etc/localtime
最终确定是由于时区更改的问题,造成prometheus的时序数据库出现数据异常,因此需要重置prometheus的时序数据库。
最终解决方案:
 cat >/etc/systemd/system/prometheus.service <<EOF
[Unit]
Descriptinotallow=Prometheus Monitoring System
Documentatinotallow=Prometheus Monitoring System
[Service]
ExecStart=/opt/prometheus/prometheus --config.file=/opt/prometheus/prometheus.yml --web.listen-address=:39090 \
--storage.tsdb.path="/opt/prometheus/tsdb_data"
# 这里的路径按实际填写
[Install]
WantedBy=multi-user.target
EOF
启动脚本内增加了--storage.tsdb.path="/opt/prometheus/tsdb_data" /opt/prometheus/tsdb_data目录需要新建
再次重启prometheus服务后,发现一切恢复正常。
虽然prometheus的数据仍然是存放在/data 目录下,并不在/opt/prometheus/tsdb_data目录下,但神奇的是prometheus服务竟然恢复了。具体原因还不清楚,留待以后在研究吧。