整理全网Shell脚本合集,Java脚本,运维脚本,告警脚本,监控脚本,日志脚本,docker脚本等---------持续更新!
- 一、ffmpeg脚本
- 二、java jar包启动-剔除Pom中依赖
- 三、Java jar包通用启动脚本
- 四、查看centos配置信息脚本
- 五、Jenkins项目打包发布脚本
- 六、Mysql-使用脚本进行分库分表备份
- 七、实时监控网卡流量的通用脚本
- 八、监控磁盘的监控脚本
- 九、[指定时间内网站访问次数的监控](https://www.cnblogs.com/kevingrace/p/8482444.html)
- 十、[基于Ping和Telnet/NC的监控脚本案例分析](https://www.cnblogs.com/kevingrace/p/8931230.html)
- 十一、[监控某个目录是否被更改](https://www.cnblogs.com/kevingrace/p/8260032.html)
- 十二、[日志文件ERROR监控报警](https://www.cnblogs.com/kevingrace/p/7661498.html)
- 十三、[网站访问状态和超时时间监控报警设置](https://www.cnblogs.com/kevingrace/p/7658394.html)
- 十四、[服务器磁盘监控脚本分享(含报警邮件)](https://www.cnblogs.com/kevingrace/p/5970305.html)
- 十五、[业务日志清理脚本](https://www.cnblogs.com/kevingrace/p/11556219.html)
- 十六、[Linux下间隔多少秒 (即以秒为单位) 去执行某条命令或某个shell脚本的操作方法](https://www.cnblogs.com/kevingrace/p/10220837.html)
- 十七、[Linux下批量ping某个网段ip的脚本](https://www.cnblogs.com/kevingrace/p/9070402.html)
- 十八、查看系统运行情况
- 十九、管理docker
- 二十、shell多线程备份数据库
一、ffmpeg脚本
1.1 打开进程,并判断进程数量
原版本:
#!/bin/bash
ffmpegPid = $( ps -ef | grep -E 'ffmpeg.*$1$2$3' | grep -v 'grep' | awk '{print $2}')
if [ -z "$ffmpegPid" ]
then
	threadNum = $( ps -ef | grep ffmpeg | grep -v 'grep' | wc -l | awk '{print $1}')
	if [$threadNum -gt 10]
	then
		# 线程数大于10个,需要干掉ffmpeg线程
		echo threadNum too more!
		for thread in $threadNum
		do
			kill -9 ${thread}
		done
	else
		nohup ffmpeg -re  -rtsp_transport tcp -i "rtsp://ip:port/dss/monitor/params?cameraid=$1%24$2&substream=$3" -vcodec libx264 -vprofile baseline -acodec aac -ar 44100 -strict -2 -ac 1 -f flv -s 1280x720 -q 10 $4 > /Users/chuxiaowei/ffmpeg$1$2$3.log 2>&1 &
		ps -ef | grep -E 'ffmpeg.*$1$2$3' | grep -v 'grep' | awk '{print $2}'
	fi
else
	ps -ef | grep -E 'ffmpeg.*$1$2$3' | grep -v 'grep' | awk '{print $2}'
fi
改进之后:
#!/bin/bash
ffmpegPid = $( ps -ef | grep -E 'ffmpeg.*$1$2$3' | grep -v 'grep' | awk '{print $2}')
if [ -z "$ffmpegPid" ]
then
    nohup ffmpeg -re  -rtsp_transport tcp -i "rtsp://ip:port/dss/monitor/params?cameraid=$1%24$2&substream=$3" -vcodec libx264 -vprofile baseline -acodec aac -ar 44100 -strict -2 -ac 1 -f flv -s 1280x720 -q 10 $4 > /root/ffmpeg$1$2$3.log 2>&1 &
    ps -ef | grep -E 'ffmpeg.*$4*' | grep -v 'grep' | awk '{print $2}'
fi
1.2 关闭进程
#关闭进程
#!/bin/bash
ps -ef | grep -E 'ffmpeg.*$1*' | grep -v 'grep' | awk '{print $2}' | xargs kill
二、java jar包启动-剔除Pom中依赖
#!/bin/bash
pid=$(ps -ef | grep java | grep -E '*rtsptortmp.*' | awk '{print $2}')
echo "pid = $pid"
if [ $pid ];then
    kill -9 $pid
    echo "kill the process rtsptortmp pid = $pid"
fi

nohup java -Dloader.path=/root/rtsptortmplib -jar rtsptortmp-1.0-SNAPSHOT.jar --spring.profiles.active=prod > /root/logs/rtsptortmp.log 2>&1 &
tail -f /root/logs/rtsptortmp.log
三、Java jar包通用启动脚本
eg:
./start.sh java.jar
#!/bin/bash
pid=$(ps -ef | grep java | grep -E '*$1*' | awk '{print $2}')
echo "pid = $pid"
if [ $pid ];then
    kill -9 $pid
    echo "kill the process pid = $pid"
fi

nohup java -jar -Xms256m -Xmx256m $1 --spring.profiles.active=prod > /root/logs/$1.log 2>&1 &
tail -f /root/logs/$1.log
四、查看centos配置信息脚本
#!/bin/bash

echo ======= cpu个数: =======
grep 'physical id' /proc/cpuinfo | sort -u | wc -l

echo ======= cpu核数: =======
cat /proc/cpuinfo | grep "cpu cores" | uniq

echo ======= cpu型号: =======
cat /proc/cpuinfo | grep 'model name' |uniq

echo ======= cpu内核频率: =======
cat /proc/cpuinfo |grep MHz|uniq

echo ======= cpu统计信息: =======
lscpu

echo ======= 内存总数: =======
cat /proc/meminfo | grep MemTotal

echo ======= 内核版本: =======
cat /proc/version

echo ======= 操作系统内核信息: =======
uname -a

echo ======= 磁盘信息: =======
fdisk -l
五、Jenkins项目打包发布脚本
#!/bin/bash

//传入的war包名称
name=$1
//war包所在目录
path=$2
//上传的war包位置
path_w=$3
//如果项目正在运行就杀死进程
if [ -f "$path/$name" ];then
	echo "delete the file $name"
	rm -f  $path/$name
else
	echo "the file $name is not exist"
fi
//把jenkins上传的war包拷贝到我们所在目录
cp $path_w/$name $path/
echo "copy the file $name from $path_w to $path"

//获取该项目正在运行的pid
pid=$(ps -ef | grep java | grep $name | awk '{print $2}')
echo "pid = $pid"
//如果项目正在运行就杀死进程
if [ $pid ];then
	kill -9 $pid
	echo "kill the process $name pid = $pid"
else
	echo "process is not exist"
fi
//要切换到项目目录下才能在项目目录下生成日志
cd $path
//防止被jenkins杀掉进程 BUILD_ID=dontKillMe
BUILD_ID=dontKillMe
//启动项目
nohup java -server -Xms256m -Xmx512m -jar -Dserver.port=20000 $name >> nohup.out 2>&1 &
//判断项目是否启动成功
pid_new=$(ps -ef | grep java | grep $name | awk '{print $2}')
if [ $? -eq 0 ];then
echo "this application  $name is starting  pid_new = $pid_new"
else
echo "this application  $name  startup failure"
fi
echo $! > /var/run/myClass.pid
echo "over"
六、Mysql-使用脚本进行分库分表备份
[root@ctos3 ~]# cat bak.sh
#!/bin/bash

MYUSER="root"
MYPASS="guoke123"
MYLOG="mysql -u$MYUSER -p$MYPASS -e"
MYDUMP="mysqldump -u$MYUSER -p$MYPASS -x -F"
DBLIST=$($MYLOG  "show databases;" | sed 1d | grep -Ev 'info|mysq|per|sys')
DIR=/backup
[ ! -d $DIR ] && mkdir $DIR
cd $DIR

for dbname in $DBLIST
do
 TABLIST=$($MYLOG "show tables from $dbname;" | sed 1d)
for tabname in $TABLIST
do
  mkdir -p $DIR/$dbname
   $MYDUMP $dbname $tabname  --events |gzip > $DIR/${dbname}/${tabname}_$(date +%F_%T).sql.gz
done
done
七、实时监控网卡流量的通用脚本
[root@ceph-node1 ~]# cat /root/net_monit.sh
#!/bin/bash
PATH=/bin:/usr/bin:/sbin:/usr/sbin:/usr/local/bin:/usr/local/sbin;
export PATH
function traffic_monitor {


  OS_NAME=$(sed -n '1p' /etc/issue)

  eth=$1

  if [ ! -d /sys/class/net/$eth ];then
      echo -e "Network-Interface Not Found"
      echo -e "You system have network-interface:\n`ls /sys/class/net`"
      exit 5
  fi
  while [ "1" ]
  do

    STATUS="fine"

    RXpre=$(cat /proc/net/dev | grep $eth | tr : " " | awk '{print $2}')
    TXpre=$(cat /proc/net/dev | grep $eth | tr : " " | awk '{print $10}')

    sleep 1
    RXnext=$(cat /proc/net/dev | grep $eth | tr : " " | awk '{print $2}')
    TXnext=$(cat /proc/net/dev | grep $eth | tr : " " | awk '{print $10}')
    clear

    RX=$((${RXnext}-${RXpre}))
    TX=$((${TXnext}-${TXpre}))

    if [[ $RX -lt 1024 ]];then
      RX="${RX}B/s"
    elif [[ $RX -gt 1048576 ]];then
      RX=$(echo $RX | awk '{print $1/1048576 "MB/s"}')
      $STATUS="busy"
    else
      RX=$(echo $RX | awk '{print $1/1024 "KB/s"}')
    fi

    if [[ $TX -lt 1024 ]];then
      TX="${TX}B/s"
      elif [[ $TX -gt 1048576 ]];then
      TX=$(echo $TX | awk '{print $1/1048576 "MB/s"}')
    else
      TX=$(echo $TX | awk '{print $1/1024 "KB/s"}')
    fi

    echo -e "==================================="
    echo -e "Welcome to Traffic_Monitor stage"
    echo -e "version 1.0"
    echo -e "Since 2018.7.2"
    echo -e "Created by wangshibo"
    echo -e "BLOG: http://www.cnblogs.cn/kevingrace"
    echo -e "==================================="
    echo -e "System: $OS_NAME"
    echo -e "Date:   `date +%F`"
    echo -e "Time:   `date +%k:%M:%S`"
    echo -e "Port:   $1"
    echo -e "Status: $STATUS"
    echo -e  " \t     RX \tTX"
    echo "------------------------------"

    echo -e "$eth \t $RX   $TX "
    echo "------------------------------"

    echo -e "Press 'Ctrl+C' to exit"
  done
}

if [[ -n "$1" ]];then
  traffic_monitor $1
else
  echo -e "None parameter,please add system netport after run the script! \nExample: 'sh traffic_monitor eth0'"
fi


[root@ceph-node1 ~]# chmod 755 /root/net_monit.sh
[root@ceph-node1 ~]# sh /root/net_monit.sh eth0               #eth0是网卡设备名称,如果是网卡绑定bond0,后面就跟bond0
===================================
Welcome to Traffic_Monitor stage
version 1.0
Since 2018.7.2
Created by wangshibo
BLOG: http://www.cnblogs.cn/kevingrace
===================================
System: CentOS release 6.9 (Final)
Date:   2018-07-02
Time:   15:19:34
Port:   eth0
Status: fine
        RX  TX
------------------------------
eth0   417B/s   390B/s
------------------------------
Press 'Ctrl+C' to exit
===================================
Welcome to Traffic_Monitor stage
version 1.0
Since 2018.7.2
Created by wangshibo
BLOG: http://www.cnblogs.cn/kevingrace
===================================
System: CentOS release 6.9 (Final)
Date:   2018-07-02
Time:   15:19:35
Port:   eth0
Status: fine
        RX  TX
------------------------------
eth0   1.49902KB/s   1.3252KB/s
------------------------------
Press 'Ctrl+C' to exit
八、监控磁盘的监控脚本
[root@ceph-node1 ~]# cat disk_monit.sh
#!/bin/bash
#filename:Monitor_Disk
Monitor_Disk(){


mkdir -p /mnt/Monitor_Disk
fdisk -l|grep "Disk /dev/" | awk '{print $2,$3$4}'|tr -d ',:'>/mnt/Monitor_Disk/device_list.log
N=1;ECHO 90
while read device_line
do
Device=`echo $device_line|awk '{print $1}'`
Sum=`echo $device_line|awk '{print $2}'`
df -h |grep "$Device"|sort>/mnt/Monitor_Disk/${N}_partitions.log
echo
echo "** 第$N块硬盘($Device):${Sum} **"| grep -E "$Device|$Sum|$N" --color=yes
echo "------------------------------------"
echo -e "linux分区 挂载目录 总大小 已用 剩余 已用百分比 文件系统 ID system  \
块大小  预留空间  ">/mnt/Monitor_Disk/${N}_Over.log
echo -e "========= ======== =====  ===  ===  ==========  ======= == ======  \
======  ======== ">>/mnt/Monitor_Disk/${N}_Over.log
Num_Partition=`cat /mnt/Monitor_Disk/${

     N}_partitions.log|wc -l`
n=0
while read partition_line
do
    Partition_Name=`echo $partition_line|awk '{print $1}'`
    Mount_Dir=`echo $partition_line|awk '{print $6}'`
    Partition_Sum=`echo $partition_line|awk '{print $2}'`
    Partition_Used=`echo $partition_line|awk '{print $3}'`
    Partition_Leave=`echo $partition_line| awk '{print $4}'`
    Partition_Percent=`echo $partition_line|awk '{print $5}'`
    Partition_Type=`mount|grep $Partition_Name|awk '{print $5$6}'`
    Partition_Id=`fdisk -l | grep $Partition_Name|tr -d '\*'|awk '{print $5}'`
    Partition_System=`fdisk -l | grep $Partition_Name|tr -d '\*'|awk '{print $6}'`
    Part_Block_Size_B=`tune2fs -l $Partition_Name|grep "Block size"|awk '{print $3}'`
    Part_Lift_For_Root_Blocks=`tune2fs -l $Partition_Name|grep "Reserved block count:"|\
    awk '{print $4}'`
    Part_Block_Size=`echo $Part_Block_Size_B/1024|bc`
    Part_Lift_For_Root=`echo ${

     Part_Lift_For_Root_Blocks}*${

     Part_Block_Size}/1024|bc`
    echo -e "$Partition_Name $Mount_Dir $Partition_Sum $Partition_Used $Partition_Leave \
$Partition_Percent $Partition_Type  $Partition_Id $Partition_System  \
${Part_Block_Size}K ${Part_Lift_For_Root}M">>/mnt/Monitor_Disk/${N}_Over.log
    let n++

    [ $n -eq $Num_Partition ]&&(cat /mnt/Monitor_Disk/${N}_Over.log|column -t;echo)
done</mnt/Monitor_Disk/${N}_partitions.log
let N++
done</mnt/Monitor_Disk/device_list.log
ECHO 90
rm -fr /mnt/Monitor_Disk
}
ECHO(){


for ((i=1;i<=$1;i++))
do
echo -n "#"
[ $i -eq $1 ]&&(echo;echo)
done
}
Monitor_Disk


[root@ceph-node1 ~]# chmod 755 disk_monit.sh
[root@ceph-node1 ~]# sh disk_monit.sh
##########################################################################################


** 第1块硬盘(/dev/sdb):577.4GB **
------------------------------------
linux分区  挂载目录  总大小  已用  剩余  已用百分比  文件系统  ID  system  块大小  预留空间
=========  ========  =====   ===   ===   ==========  =======   ==  ======  ======  ========
/dev/sdb1  /data     530G    42G   461G  9%          ext4(rw)  83  Linux   4K      27532M


** 第2块硬盘(/dev/sda):322.1GB **
------------------------------------
linux分区  挂载目录  总大小  已用  剩余  已用百分比  文件系统  ID  system  块大小  预留空间
=========  ========  =====   ===   ===   ==========  =======   ==  ======  ======  ========
/dev/sda1  /boot     283M    76M   193M  29%         ext4(rw)  83  Linux   1K      15M
/dev/sda3  /         265G    3.1G  248G  2%          ext4(rw)  83  Linux   4K      13744M

##########################################################################################
8.1 监控磁盘IO使用率的脚本,实时查看IO使用情况,防止因为磁盘IO效率低而导致MySQL查询慢的问题。
#!/bin/bash
#监控磁盘IO使用率并告警

#定义收件人邮箱
mail="/usr/local/sbin/mail.py"
mail_user=[email protected]

if ! which iostat &>/dev/null
then
    yum install -y sysstat
fi

if ! which iotop &>/dev/null
then
    yum install -y iotop
fi

logdir=/data/iolog

dt=`date +%F`           #以日期作为日志名字

#获取IO,取5次平均值
get_io()
{


    iostat -dx 1 5 > $logdir/iostat.log
    sum=0

    for ut in `grep "^$1" $logdir/iostat.log |awk '{print $NF}' |cut -d '.' -f 1`
    do
        sum=$[$sum+$ut]
    done
    echo $[$sum/5]
}

while ture
do
    for d in `iostat -dx |egrep -v '^$|Device:|CPU\}' |awk '{print $1}'
    do
        io=`get_io $d`

        if [ $io -gt 90 ]
        then
            date >> $logdir/$dt
            cat $logdir/iostat.log >> $logdir/$dt
            iotop -obn2 >> $logdir/$dt
            echo "###################" >> $logdir/$dt

            python $mail $mail_user "磁盘IO使用率超过90%" "`cat $logdir/$dt`" 2>/dev/null
        fi
    done
    sleep 10
done
九、指定时间内网站访问次数的监控
需求说明:
在日常运维工作中,为了防止一些恶意访问的行为,例如不断的请求刷流量,通过实时过滤Nginx访问日志,将单位时间内访问次数达到指定阀值的来源ip查找出来,并通过邮件报警方式及时通知运维人员!
比如针对url为http://192.168.10.202:8888的访问进行监控,当在1分钟内访问次数超过300次数,就邮件报警给运维人员。
9.1 nginx日志监控脚本
[root@Fastdfs_storage_s1 ~]# cat /opt/nginx_log_monit.sh
#!/bin/bash
#日志文件
logfile=/usr/local/nginx/logs/access.log

#开始时间
start_time=`date -d"$last_minutes minutes ago" +"%H:%M:%S"`

#结束时间
stop_time=`date +"%H:%M:%S"`

#过滤出单位之间内的日志并统计最高ip数
tac $logfile | awk -v st="$start_time" -v et="$stop_time" '{t=substr($4,RSTART+14,21);if(t>=st && t<=et) {print $0}}' \
| awk '{print $1}' | sort | uniq -c | sort -nr > /root/log_ip_top10
ip_top=`cat /root/log_ip_top10 | head -1 | awk '{print $1}'`
# 单位时间[1分钟]内单ip访问次数超过300次,则触发邮件报警
if [[ $ip_top -gt 300 ]];then
 /usr/bin/python /opt/send_mail.py &
fi
9.2 python报警脚本
[root@Fastdfs_storage_s1 ~]# cat /opt/send_mail.py
# -*- coding: utf-8 -*-
from email import encoders
from email.header import Header
from email.mime.text import MIMEText
from email.utils import parseaddr, formataddr
from email.mime.multipart import MIMEMultipart
from email.mime.base import MIMEBase
from datetime import datetime
import os
import smtplib
def _format_addr(s):
 name, addr = parseaddr(s)
 return formataddr((Header(name, 'utf-8').encode(), addr))
# 邮箱定义
smtp_server = 'smtp.kevin.com'
smtp_port = 465
from_addr = '[email protected]'
password = os.environ.get('monit@123')
to_addr = ['[email protected]']
# 邮件对象
msg = MIMEMultipart()
msg['From'] = _format_addr('发件人 <%s>' % from_addr)
msg['To'] = _format_addr('收件人 <%s>' % to_addr)
msg['Subject'] = Header('Warning:单ip请求次数异常', 'utf-8').encode()
# 获取系统中要发送的文本内容
with open('/root/log_ip_top10', 'r') as f:
 line = f.readline().strip()
 line = line.split(" ")
print(line)
# 邮件正文是MIMEText:
html = '<html><body><h2>一分钟内单ip请求次数超过阀值</h2>' + \
 '<p>ip:%s  请求次数/min:%s</p>' % (line[1],line[0]) + \
 '</body></html>'
msg.attach(MIMEText(html, 'html', 'utf-8'))
server = smtplib.SMTP_SSL(smtp_server, smtp_port)
server.login(from_addr, password)
server.sendmail(from_addr, to_addr, msg.as_string())
server.quit()
9.3 写个测试脚本不停curl请求资源触发报警
[root@Fastdfs_storage_s1 ~]# cat /opt/curl.sh
#!/bin/bash
#example:curl.sh http://www.kevin.com 100
usage()
{


 echo "usage: `basename $0` url count"
}
if [ $# -ne 2 ]; then
 usage
 exit 1
fi
for i in `seq 1 $2`;do
 http_code=`curl -o /dev/null -s -w %{

     http_code} $1`
 echo $1 $http_code
done


手动执行测试脚本
[root@Fastdfs_storage_s1 ~]# /bin/bash /opt/curl.sh http://192.168.10.202:8888 300
http://192.168.10.202:8888 200
http://192.168.10.202:8888 200
http://192.168.10.202:8888 200
http://192.168.10.202:8888 200
http://192.168.10.202:8888 200
http://192.168.10.202:8888 200
http://192.168.10.202:8888 200
http://192.168.10.202:8888 200
http://192.168.10.202:8888 200
http://192.168.10.202:8888 200
http://192.168.10.202:8888 200
...........
9.4 定时任务,由于上面脚本是监控一分钟内的日志,因此每分钟执行一次
[root@Fastdfs_storage_s1 ~]# crontab -e
* * * * * /bin/bash -x /opt/nginx_log_monit.sh >/dev/null 2>&1
这里仅仅是实现了邮件告警功能,实际上还可以实现自动屏蔽恶意访问的ip。
可以通过Nginx deny来实现,也可以通过iptables屏蔽("iptables -I INPUT -s x.x.x.x -j DROP"方式)。
十、基于Ping和Telnet/NC的监控脚本案例分析
10.1 通过shell脚本,判断172.16.60.0/24网络里,当前在线的ip有哪些?能ping通则认为在线。
[root@python2 ~]# cat /tmp/ip.sh
#!/bin/bash

for i in $(seq 1 254)                  #这一行或者换成"for i in {1..254}"
do
  IP=172.16.60.${i}
  ping -c2 ${IP} >/dev/null 2>&1
  if [ $? = 0 ];then
    echo "${IP} is online!"
  else
    echo "${IP} is failed"
  fi
done

执行脚本:
[root@python2 ~]# sh /tmp/ip.sh
172.16.60.1 is online!
172.16.60.2 is failed
172.16.60.3 is failed
172.16.60.4 is failed
......
案例一:单纯地对某些ip进行ping监控
[root@test opt]# cat /opt/hosts_ip_list
192.168.10.10
192.168.10.11
192.168.10.12
192.168.10.13
192.168.10.14
192.168.10.15
192.168.10.16
192.168.10.17

[root@test opt]# cat /opt/hosts_ip_monit.sh
#!/bin/bash
for ip in $(cat /opt/hosts_ip_list)
  do
     ping -c 1 $ip &>/dev/null                      #ping 3次,当3次ping都失败时,则判定此ip网络通信失败。
     a=$?
     sleep 2
     ping -c 1 $ip &>/dev/null
     b=$?
     sleep 2
     ping -c 1 $ip &>/dev/null
     c=$?
     sleep 2
     DATE=$(date +%F" "%H:%M)
     if [ $a -ne 0 -a $b -ne 0 -a $c -ne 0 ];then
         echo -e "Date : $DATE\nHost : $ip\nProblem : Ping is failed."
         /bin/sed -i 's/^'$ip'/'#$ip'/g' /etc/hosts
     else
         echo "$ip ping is successful."
        /bin/sed -i 's/^'#$ip'/'$ip'/g' /etc/hosts
     fi
done

[root@test opt]# chmod 755 /opt/hosts_ip_monit.sh

[root@test opt]# sh /opt/hosts_ip_monit.sh
Date : 2018-04-24 15:49
Host : 192.168.10.10
Problem : Ping is failed.
Date : 2018-04-24 15:50
Host : 192.168.10.11
Problem : Ping is failed.
192.168.10.12 ping is successful.
192.168.10.13 ping is successful.
192.168.10.14 ping is successful.
192.168.10.15 ping is successful.
192.168.10.16 ping is successful.
Date : 2018-04-24 15:51
Host : 192.168.10.17
Problem : Ping is failed.
案例二:对/etc/hosts列表里的ip映射关系进行ping监控报警
测试系统服务器需要访问域名www.test.com,该域名解析的DNS地址有很多个,需要在测试系统服务器上的做host绑定。在/etc/hosts文件了做了www.test.com域名的很多绑定,
在域名解析时,会从host绑定配置里从上到下匹配,如果上面绑定的ip不通,则域名解析就会失败,不会主动去解析到下一个绑定的地址,除非将这个不通的ip绑定注释掉或删除掉。

现在要求:
当/etc/hosts文件里绑定的ip出现故障,ping不通的时候,将该ip的绑定自动注释,并发出邮件报警;如果该ip恢复了正常通信,将自动打开该ip的绑定设置。

[root@cx-app01 ~]# cat /etc/hosts
#192.168.10.10 www.test.com
#192.168.10.11 www.test.com
192.168.10.12 www.test.com
192.168.10.13 www.test.com
192.168.10.14 www.test.com
192.168.10.15 www.test.com
192.168.10.16 www.test.com
#192.168.10.17 www.test.com

[root@cx-app01 ~]# ping www.test.com
PING www.test.com (192.168.10.12) 56(84) bytes of data.
64 bytes from www.test.com (192.168.10.12): icmp_seq=1 ttl=50 time=31.1 ms
64 bytes from www.test.com (192.168.10.12): icmp_seq=2 ttl=50 time=30.7 ms
64 bytes from www.test.com (192.168.10.12): icmp_seq=3 ttl=50 time=30.8 ms
.......

[root@cx-app01 ~]# cat /opt/hosts_ip_list
192.168.10.10
192.168.10.11
192.168.10.12
192.168.10.13
192.168.10.14
192.168.10.15
192.168.10.16
192.168.10.17

[root@cx-app01 ~]# cat /opt/hosts_ip_monit.sh
#!/bin/bash
for ip in $(cat /opt/hosts_ip_list)
  do
     ping -c 1 $ip &>/dev/null
     a=$?
     sleep 2
     ping -c 1 $ip &>/dev/null
     b=$?
     sleep 2
     ping -c 1 $ip &>/dev/null
     c=$?
     sleep 2
     DATE=$(date +%F" "%H:%M)
     if [ $a -ne 0 -a $b -ne 0 -a $c -ne 0 ];then
         echo -e "Date : $DATE\nHost : $ip\nProblem : Ping is failed."
         cat /etc/hosts|grep "^#$ip"
         d=$?
           if [ $d -ne 0 ];then
              /bin/bash /opt/sendemail.sh [email protected] "测试系统跟www.test.com通信情况" "$HOSTNAME跟$ip连接失败,现已在/etc/hosts文件里注释掉该ip的映射关系"
              /bin/bash /opt/sendemail.sh [email protected] "测试系统跟www.test.com通信情况" "$HOSTNAME跟$ip连接失败,现已在/etc/hosts文件里注释掉该ip的映射关系"
              /bin/bash /opt/sendemail.sh [email protected] "测试系统跟www.test.com通信情况" "$HOSTNAME跟$ip连接失败,现已在/etc/hosts文件里注释掉该ip的映射关系"
              /bin/sed -i 's/^'$ip'/'#$ip'/g' /etc/hosts
           else
              echo "$ip is not conneted,and it has been done"
           fi
     else
         echo "$ip ping is successful."
         cat /etc/hosts|grep "^#$ip"
         f=$?
           if [ $f -eq 0 ];then
              /bin/bash /opt/sendemail.sh [email protected] "测试系统跟www.test.com通信情况" "$HOSTNAME跟$ip连接成功,现已在/etc/hosts文件里恢复该ip的映射关系"
              /bin/bash /opt/sendemail.sh [email protected] "测试系统跟www.test.com通信情况" "$HOSTNAME跟$ip连接成功,现已在/etc/hosts文件里恢复该ip的映射关系"
              /bin/bash /opt/sendemail.sh [email protected] "测试系统跟www.test.com通信情况" "$HOSTNAME跟$ip连接成功,现已在/etc/hosts文件里恢复该ip的映射关系"
              /bin/sed -i 's/^'#$ip'/'$ip'/g' /etc/hosts
           else
              echo "$ip connection has been restored"
           fi
     fi
done


采用sendemail进行邮件告警发送,sendemail部署参考:http://www.cnblogs.com/kevingrace/p/5961861.html
[root@cx-app01 ~]# cat /opt/sendemail.sh
#!/bin/bash
# Filename: SendEmail.sh
# Notes: 使用sendEmail
#
# 脚本的日志文件
LOGFILE="/tmp/Email.log"
:>"$LOGFILE"
exec 1>"$LOGFILE"
exec 2>&1
SMTP_server='smtp.test.com'
username='[email protected]'
password='monit@123'
from_email_address='[email protected]'
to_email_address="$1"
message_subject_utf8="$2"
message_body_utf8="$3"
# 转换邮件标题为GB2312,解决邮件标题含有中文,收到邮件显示乱码的问题。
message_subject_gb2312=`iconv -t GB2312 -f UTF-8 << EOF
$message_subject_utf8
EOF`
[ $? -eq 0 ] && message_subject="$message_subject_gb2312" || message_subject="$message_subject_utf8"
# 转换邮件内容为GB2312,解决收到邮件内容乱码
message_body_gb2312=`iconv -t GB2312 -f UTF-8 << EOF
$message_body_utf8
EOF`
[ $? -eq 0 ] && message_body="$message_body_gb2312" || message_body="$message_body_utf8"
# 发送邮件
sendEmail='/usr/local/bin/sendEmail'
set -x
$sendEmail -s "$SMTP_server" -xu "$username" -xp "$password" -f "$from_email_address" -t "$to_email_address" -u "$message_subject" -m "$message_body" -o message-content-type=text -o message-charset=gb2312


每10分钟定时执行该监控脚本
[root@cx-app01 ~]# crontab -l
*/10 * * * *  /bin/bash -x /opt/hosts_ip_monit.sh > /dev/null 2>&1
10.3 案例三:通过nc工具对/etc/hosts列表里的ip的443端口跟本机通信是否正常进行探测
案例二是针对ping编写的监控脚本,下面介绍下利用nc探测端口通信是否正常的脚本:

探测本机对下面/etc/hosts文件里的ip地址的443端口通信是否正常,如果通信失败,则发出报警,并在/etc/hosts文件里注释掉该ip地址的绑定关系。
如果注释掉的ip的443端口跟本机恢复了通信,则去掉/etc/hosts文件里该ip的注释!

[root@cx-app01 ~]# cat /etc/hosts
192.168.10.201 www.test.com
192.168.10.205  www.test.com
192.168.10.17  www.test.com
192.168.10.85  www.test.com
192.168.10.176   www.test.com
192.168.10.245  www.test.com
192.168.10.25    www.test.com
192.168.10.47  www.test.com

[root@cx-app01 ~]# cat /opt/hosts_ip_list
192.168.10.201
192.168.10.205
192.168.10.17
192.168.10.85
192.168.10.176
192.168.10.245
192.168.10.25
192.168.10.47

采用nc工具去探测端口是否正常通信(yum install -y nc)
[root@cx-app01 ~]# /usr/bin/nc -z  -w 10 192.168.10.201 443
Connection to 192.168.10.201 443 port [tcp/https] succeeded!

针对上面ip列表里的地址,进行批量ip的443端口通信的探测。脚本如下:
[root@cx-app01 ~]# cat /opt/host_ip_nc_monit.sh
#!/bin/bash
for ip in $(cat /opt/hosts_ip_list)
do
    echo -e "Date : $DATE\nHost : $ip\nProblem : Port 443 is connected."
    cat /etc/hosts|grep "^#$ip"
    a=$?
    if [ $a -ne 0 ];then
       /usr/bin/nc -z  -w 10 $ip 443
       b=$?
       if [ $b -ne 0 ];then
          /bin/bash /opt/sendemail.sh [email protected] "测试系统跟www.test.com通信情况" "$HOSTNAME跟$ip的443端口连接失败,现已在/etc/hosts文件里注释掉该ip的映射关系"
          /bin/bash /opt/sendemail.sh [email protected] "测试系统跟www.test.com通信情况" "$HOSTNAME跟$ip的443端口连接失败,现已在/etc/hosts文件里注释掉该ip的映射关系"
          /bin/sed -i 's/^'$ip'/'#$ip'/g' /etc/hosts
       else
       echo "$HOSTNAME跟$ip的443端口正常连接"
       fi
    else
       /usr/bin/nc -z  -w 10 $ip 443
       c=$?
       if [ $c -eq 0 ];then
         /bin/bash /opt/sendemail.sh [email protected] "测试系统跟www.test.com通信情况" "$HOSTNAME跟$ip的443端口连接成功,现已在/etc/hosts文件里恢复该ip的映射关系"
         /bin/bash /opt/sendemail.sh [email protected] "测试系统跟www.test.com通信情况" "$HOSTNAME跟$ip的443端口连接成功,现已在/etc/hosts文件里恢复该ip的映射关系"
         /bin/sed -i 's/^'#$ip'/'$ip'/g' /etc/hosts
       else
         echo "$HOSTNAME跟$ip的443端口连接失败"
       fi
    fi
done

给脚本赋权
[root@cx-app01 ~]# chmod 755 /opt/host_ip_nc_monit.sh

执行脚本:
[root@cx-app01 ~]# sh /opt/host_ip_nc_monit.sh
Date :
Host : 192.168.10.201
Problem : Port 443 is connected.
Connection to 192.168.10.201 443 port [tcp/https] succeeded!
cx-app01.veredholdings.cn跟192.168.10.201的443端口正常连接
Date :
Host : 192.168.10.205
Problem : Port 443 is connected.
Connection to 192.168.10.205 443 port [tcp/https] succeeded!
cx-app01.veredholdings.cn跟192.168.10.205的443端口正常连接
Date :
Host : 192.168.10.17
Problem : Port 443 is connected.
Connection to 192.168.10.17 443 port [tcp/https] succeeded!
cx-app01.veredholdings.cn跟192.168.10.17的443端口正常连接
Date :
Host : 192.168.10.85
Problem : Port 443 is connected.
Connection to 192.168.10.85 443 port [tcp/https] succeeded!
cx-app01.veredholdings.cn跟192.168.10.85的443端口正常连接
Date :
Host : 192.168.10.176
Problem : Port 443 is connected.
Connection to 192.168.10.176 443 port [tcp/https] succeeded!
cx-app01.veredholdings.cn跟192.168.10.176的443端口正常连接
Date :
Host : 192.168.10.245
Problem : Port 443 is connected.
Connection to 192.168.10.245 443 port [tcp/https] succeeded!
cx-app01.veredholdings.cn跟192.168.10.245的443端口正常连接
Date :
Host : 192.168.10.25
Problem : Port 443 is connected.
Connection to 192.168.10.25 443 port [tcp/https] succeeded!
cx-app01.veredholdings.cn跟192.168.10.25的443端口正常连接
Date :
Host : 192.168.10.47
Problem : Port 443 is connected.
Connection to 192.168.10.47 443 port [tcp/https] succeeded!
cx-app01.veredholdings.cn跟192.168.10.47的443端口正常连接

结合crontab进行计划任务
[root@cx-app01 ~]# crontab -l
*/10 * * * *  /bin/bash -x /opt/host_ip_nc_monit.sh > /dev/null 2>&1
十一、监控某个目录是否被更改
需求:对一个目录(比如/data/test)进行监控,当这个目录下文件或子目录出现变动(如修改、创建、删除、更名等操作)时,就发送邮件!
针对上面的需求,编写shell脚本如下:
[root@centos6-vm01 opt]# vim file_monit.sh
#!/bin/bash
#此脚本用于检测linux系统重要文件是否被改动,如果改动则用邮件报警
#建议用定时任务执行此脚本,如每5分钟执行一次,也可修改此脚本用于死循环检测
#Ver:1.0
#http://www.cnblogs.com/kevingrace

#定义验证文件所在目录
FileDir='/var/CheckFile'

#获取主机名或自己定义
HostName=$(hostname)

#定义邮件参数:xmtp地址,发送邮件帐号,发送邮件密码,接收邮件地址,邮件主题,邮件内容
Mail_Smtp="smtp.wangshibo.com"
Mail_User="[email protected]"
Mail_Pass="notice@123"
Mail_From="[email protected]"
Mail_To="[email protected]"
Mail_Subject="${HostName}:There are changes to system files"
Mail_Conntent="${HostName}:There are changes to system files"

#定义需要验证的文件目录。这里我监控的是/data/test目录
CheckDir=(
/data/test
)

#生成所定义需验证的文件样本日志函数
OldFile () {


for i in ${CheckDir[@]}
do
/bin/find ${i} -type f |xargs md5sum >> ${FileDir}/old.log
done
}
NewFile () {


for i in ${CheckDir[@]}
do
/bin/find ${i} -type f |xargs md5sum >> ${FileDir}/new.log
done
}

#生成所定义文件新日志函数(注意后面发送邮件内容,\n表示换行)
SendEMail () {


/usr/local/bin/sendEmail -f $Mail_From -t $Mail_To -s $Mail_Smtp -u $Mail_Subject -xu $Mail_User -xp $Mail_Pass -m "$Mail_Conntent"\n
}
if [ ! -d ${FileDir} ]
then
mkdir ${FileDir}
fi

#假如验证文件目录不存在则创建
if [ ! -f ${FileDir}/old.log ]
then
OldFile
fi

#假如没有安装sendEmail则安装
if [ ! -f /usr/local/bin/sendEmail ]
then
cd /usr/local/src/
wget http://caspian.dotconf.net/menu/Software/SendEmail/sendEmail-v1.56.tar.gz
tar -xf sendEmail-v1.56.tar.gz
cd sendEmail-v1.56
cp sendEmail /usr/local/bin
chmod 0755 /usr/local/bin/sendEmail
fi

#生成新验证日志
NewFile

#新验证日志与样本日志进行比较
/usr/bin/diff ${FileDir}/new.log ${FileDir}/old.log >${FileDir}/diff.log
Status=$?

#假如比较结果有变化,则发送邮件报警
if [ ${Status} -ne 0 ]
then
Mail_Conntent="$(grep '<' ${

      FileDir}/diff.log |awk '{print $3}')"
SendEMail
fi

#清除新旧日志,把比较结果进行备份
/bin/mv -f ${FileDir}/diff.log ${FileDir}/diff$(date +%F__%T).log
cat /dev/null > ${FileDir}/old.log
cat /dev/null > ${FileDir}/new.log

#重新生成样本日志
OldFile

#删除目录内30天以前的比较结果备份文件
/bin/find ${FileDir} -type f -mtime +30 |xargs rm -f
确保本机能连上shell脚本中指定的smtp服务器的25好端口
[root@centos6-vm01 opt]# telnet smtp.wangshibo.com 25
Trying 223.252.214.65...
Connected to smtp.wangshibo.com.
Escape character is '^]'.
220 icoremail.net Anti-spam GT for Coremail System (icoremail-gateway-smtp[20170531])
下面开始测试
[root@centos6-vm01 test]# cd /opt/
[root@centos6-vm01 opt]# cd /data/test/
[root@centos6-vm01 test]# ll
total 0
[root@centos6-vm01 test]# mkdir haha
[root@centos6-vm01 test]# echo "123456" > haha/heihei
[root@centos6-vm01 test]# ll
total 4
drwxr-xr-x. 2 root root 4096 Jan 10 01:42 haha
[root@centos6-vm01 test]# echo "abcdef" > test.txt
[root@centos6-vm01 test]# ll
total 8
drwxr-xr-x. 2 root root 4096 Jan 10 01:42 haha
-rw-r--r--. 1 root root 7 Jan 10 01:42 test.txt
执行监控脚本
[root@centos6-vm01 test]# sh -x /opt/file_monit.sh
注意:当首次执行脚本的时候,由于所监控的目录下的文件没有变动,所以不会发送邮件!
查看对比后的日志
[root@centos6-vm01 test]# ll -d /var/CheckFile/
drwxr-xr-x. 2 root root 4096 Jan 10 01:44 /var/CheckFile/
[root@centos6-vm01 test]# ll /var/CheckFile/
total 4
-rw-r--r--. 1 root root 0 Jan 10 01:44 diff2018-01-10__01:44:30.log
-rw-r--r--. 1 root root 0 Jan 10 01:44 new.log
-rw-r--r--. 1 root root 166 Jan 10 01:44 old.log
[root@centos6-vm01 test]# cat /var/CheckFile/diff2018-01-10__01\:44\:30.log
[root@centos6-vm01 test]# cat /var/CheckFile/new.log
[root@centos6-vm01 test]# cat /var/CheckFile/old.log
237267ea7fefa88360c22ab6fd582d7e /data/test/.hhhh.swp
5ab557c937e38f15291c04b7e99544ad /data/test/test.txt
f447b20a7fcbf53a5d5be013ea0b15af /data/test/haha/heihei
==============================================================================================================================
现在开始对/data/test目录下的文件做下变动
[root@centos6-vm01 test]# echo "aaaaaa" >> test.txt
[root@centos6-vm01 test]# touch haha/bobo
[root@centos6-vm01 test]# mkdir heihei
[root@centos6-vm01 test]# ll
total 12
drwxr-xr-x. 2 root root 4096 Jan 10 01:47 haha
drwxr-xr-x. 2 root root 4096 Jan 10 01:47 heihei
-rw-r--r--. 1 root root 14 Jan 10 01:47 test.txt
执行监控脚本
[root@centos6-vm01 test]# sh -x /opt/file_monit.sh
查看对比后的日志
[root@centos6-vm01 test]# ll /var/CheckFile/
total 8
-rw-r--r--. 1 root root 0 Jan 10 01:44 diff2018-01-10__01:44:30.log
-rw-r--r--. 1 root root 179 Jan 10 01:47 diff2018-01-10__01:47:41.log
-rw-r--r--. 1 root root 0 Jan 10 01:47 new.log
-rw-r--r--. 1 root root 221 Jan 10 01:47 old.log
[root@centos6-vm01 test]# cat /var/CheckFile/diff2018-01-10__01\:47\:41.log
2,3c2
< 4533551682ca49b2f9b1f2829bf3b29d /data/test/test.txt
< d41d8cd98f00b204e9800998ecf8427e /data/test/haha/bobo
---
> 5ab557c937e38f15291c04b7e99544ad /data/test/test.txt
[root@centos6-vm01 test]# cat /var/CheckFile/old.log
237267ea7fefa88360c22ab6fd582d7e /data/test/.hhhh.swp
4533551682ca49b2f9b1f2829bf3b29d /data/test/test.txt
d41d8cd98f00b204e9800998ecf8427e /data/test/haha/bobo
f447b20a7fcbf53a5d5be013ea0b15af /data/test/haha/heihei
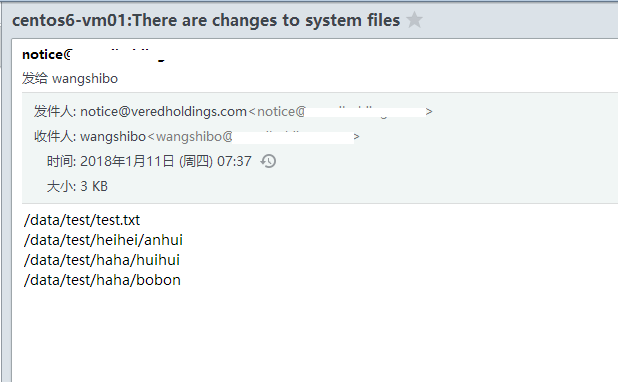
通过上面的diff日志,可以看到新变动的文件或子目录已经记录到日志里了。
查看邮件,就能看到/data/test目录下变动的文件或子目录信息了
通过crontab定时任务,每5分钟执行一次检查:
[root@centos6-vm01 test]# crontab -e
*/5 * * * *  /bin/bash -x /opt/file_monit.sh > /dev/null 2>&1
以上脚本也可以用于检测linux系统重要文件是否被更改,只需将检查的目录由脚本中的/data/test改为/etc即可!
十二、日志文件ERROR监控报警
即对日志文件中的error进行监控,当日志文件中出现error关键字时,即可报警!(grep -i error 不区分大小写进行搜索"error"关键字,但是会将包含error大小写字符的单词搜索出来)
1)第一类日志
在每天的日志目录下生产的error日志,此日志文件每天都会自动生成,里面有没有error日志内容不一定,日志内容写入不频繁,日志文件比较小。
举例说明:
[root@fk-databus01 ~]# ll /data/log/sedsb/20180628/DEJ_0001_error_20180628.0.log
-rw-rw-r-- 1 zquser zquser 63059 Jun 28 15:32 /data/log/sedsb/20180628/DEJ_0001_error_20180628.0.log

采用sendemail发送告警邮件,sendemail安装参考:http://www.cnblogs.com/kevingrace/p/5961861.html

监控脚本路径:
[root@fk-databus01 ~]# cd /opt/log_error_script/
[root@fk-databus01 log_error_script]# ll
total 20
-rw-r--r-- 1 root root 3782 Jun 29 12:13 DEJ_0001_error.log
-rwxr-xr-x 1 root root 4274 Jun 29 11:38 prcc_log_error.sh
-rwxr-xr-x 1 root root 1142 Feb 13 10:51 sendemail.sh

监控脚本内容
[root@fk-databus01 log_error_script]# cat prcc_log_error.sh
#!/bin/sh
ERROR_LOG=`/bin/ls /data/log/sedsb/$(date +%Y%m%d)/DEJ_0001_error*`
ERROR_NEW_LOG=/opt/log_error_script/DEJ_0001_error.log
DATE=`date +%Y年%m月%d日%H时%M分%S秒`
HOST=`/bin/hostname`
IP=`/sbin/ifconfig|grep "inet addr"|grep "Bcast"|cut -d":" -f2|awk -F" " '{print $1}'`
ERROR_MESSAGE=$(/bin/grep -A20 "$(grep "ERROR" $ERROR_LOG|tail -1|awk '{print $1,$2,$3,$4}')" $ERROR_LOG)

DIR=/data/log/sedsb/$(date +%Y%m%d)
FILE=/data/log/sedsb/$(date +%Y%m%d)/DEJ_0001_error_$(date +%Y%m%d).0.log

if [ ! -d $DIR ];then
   /bin/mkdir $DIR
fi

if [ ! -f $FILE ];then
   /bin/touch $FILE
fi

/bin/chown -R zquser.zquser $DIR

sleep 3

if [ ! -f $ERROR_NEW_LOG ];then
/bin/touch $ERROR_NEW_LOG
fi

NUM1=$(/bin/cat $ERROR_LOG|wc -l)
NUM2=$(/bin/cat $ERROR_NEW_LOG|wc -l)

if [ -f $ERROR_LOG ] && [ $NUM1 -ne 0 ] && [ $NUM2 -eq 0 ];then
/bin/bash /opt/log_error_script/sendemail.sh [email protected] "风控系统${HOSTNAME}机器prcc服务日志的error监控" "告警主机:${HOSTNAME} \n告警IP:${IP} \n告警时间:${DATE} \n告警等级:严重,抓紧解决啊! \n告警人员:王士博 \n告警详情:prcc服务日志中出现error了! \n告警日志文件:${ERROR_LOG} \n当前状态: PROBLEM  \n  \nerror信息:\n$ERROR_MESSAGE"
/bin/cat $ERROR_LOG > $ERROR_NEW_LOG
fi

/usr/bin/cmp $ERROR_LOG $ERROR_NEW_LOG >/dev/null 2>&1
if [ $? -ne 0 ];then
/bin/bash /opt/log_error_script/sendemail.sh [email protected] "风控系统${HOSTNAME}机器prcc服务日志的error监控" "告警主机:${HOSTNAME} \n告警IP:${IP} \n告警时间:${DATE} \n告警等级:严重,抓紧解决啊! \n告警人员:王士博 \n告警详情:prcc服务日志中出现error了! \n告警日志文件:${ERROR_LOG} \n当前状态: PROBLEM  \n  \nerror信息:\n$ERROR_MESSAGE"
/bin/cat $ERROR_LOG > $ERROR_NEW_LOG
fi

结合crontab进行定时监控(每15秒执行一次)
[root@fk-databus01 ~]# crontab -l
#监控pcrr日志的error
* * * * * /bin/bash -x /opt/log_error_script/prcc_log_error.sh >/dev/null 2>&1
* * * * * sleep 15;/bin/bash -x /opt/log_error_script/prcc_log_error.sh >/dev/null 2>&1
* * * * * sleep 30;/bin/bash -x /opt/log_error_script/prcc_log_error.sh >/dev/null 2>&1
* * * * * sleep 45;/bin/bash -x /opt/log_error_script/prcc_log_error.sh >/dev/null 2>&1

==================================================================================
针对上面脚本中的某些变量说明
[root@fk-databus01 ~]# /bin/ls /data/log/sedsb/$(date +%Y%m%d)/DEJ_0001_error*
/data/log/sedsb/20180629/DEJ_0001_error_20180629.0.log

[root@fk-databus01 ~]# grep "ERROR" /data/log/sedsb/20180629/DEJ_0001_error_20180629.0.log
ERROR DEJ 2018-06-29 12:13:29.191 [pool-4-thread-10] n.s.p.r.thread.OuterCheThdInterface - cx201806291213288440016车300接口异常!
ERROR DEJ 2018-06-29 12:13:29.196 [nioEventLoopGroup-3-12] n.s.p.r.c.MessageControllerImpl - cx201806291213288440016:

[root@fk-databus01 ~]# grep "ERROR" /data/log/sedsb/20180629/DEJ_0001_error_20180629.0.log |tail -1|awk '{print $1,$2,$3,$4}'
ERROR DEJ 2018-06-29 12:13:29.196

[root@fk-databus01 ~]# /bin/grep -A20 "$(grep "ERROR" /data/log/sedsb/20180629/DEJ_0001_error_20180629.0.log |tail -1|awk '{print $1,$2,$3,$4}')" /data/log/sedsb/20180629/DEJ_0001_error_20180629.0.log
ERROR DEJ 2018-06-29 12:13:29.196 [nioEventLoopGroup-3-12] n.s.p.r.c.MessageControllerImpl - cx201806291213288440016:
net.sinocredit.pre.rcc.utils.exception.OuterDataException: 外部数据:cheFixPrice:mile里程  is null;
   at net.sinocredit.pre.rcc.datafactory.OuterDataProcess.execute(OuterDataProcess.java:51)
   at net.sinocredit.pre.rcc.datafactory.OuterDataProcess.execute(OuterDataProcess.java:23)
   at net.sinocredit.pre.rcc.service.getOtherDataService.MessageServiceImpl.getOrderData(MessageServiceImpl.java:34)
   at net.sinocredit.pre.rcc.controller.MessageControllerImpl.divMessage(MessageControllerImpl.java:110)
   at net.sinocredit.pre.rcc.handler.ServerHandler.channelRead(ServerHandler.java:28)
   at io.netty.channel.AbstractChannelHandlerContext.invokeChannelRead(AbstractChannelHandlerContext.java:373)
   at io.netty.channel.AbstractChannelHandlerContext.invokeChannelRead(AbstractChannelHandlerContext.java:359)
   at io.netty.channel.AbstractChannelHandlerContext.fireChannelRead(AbstractChannelHandlerContext.java:351)
   at io.netty.handler.codec.MessageToMessageDecoder.channelRead(MessageToMessageDecoder.java:102)
   at io.netty.channel.AbstractChannelHandlerContext.invokeChannelRead(AbstractChannelHandlerContext.java:373)
   at io.netty.channel.AbstractChannelHandlerContext.invokeChannelRead(AbstractChannelHandlerContext.java:359)
   at io.netty.channel.AbstractChannelHandlerContext.fireChannelRead(AbstractChannelHandlerContext.java:351)
   at io.netty.handler.codec.ByteToMessageDecoder.fireChannelRead(ByteToMessageDecoder.java:293)
   at io.netty.handler.codec.ByteToMessageDecoder.channelRead(ByteToMessageDecoder.java:267)
   at io.netty.channel.AbstractChannelHandlerContext.invokeChannelRead(AbstractChannelHandlerContext.java:373)
   at io.netty.channel.AbstractChannelHandlerContext.invokeChannelRead(AbstractChannelHandlerContext.java:359)
   at io.netty.channel.AbstractChannelHandlerContext.fireChannelRead(AbstractChannelHandlerContext.java:351)
   at io.netty.channel.DefaultChannelPipeline$HeadContext.channelRead(DefaultChannelPipeline.java:1334)
   at io.netty.channel.AbstractChannelHandlerContext.invokeChannelRead(AbstractChannelHandlerContext.java:373)
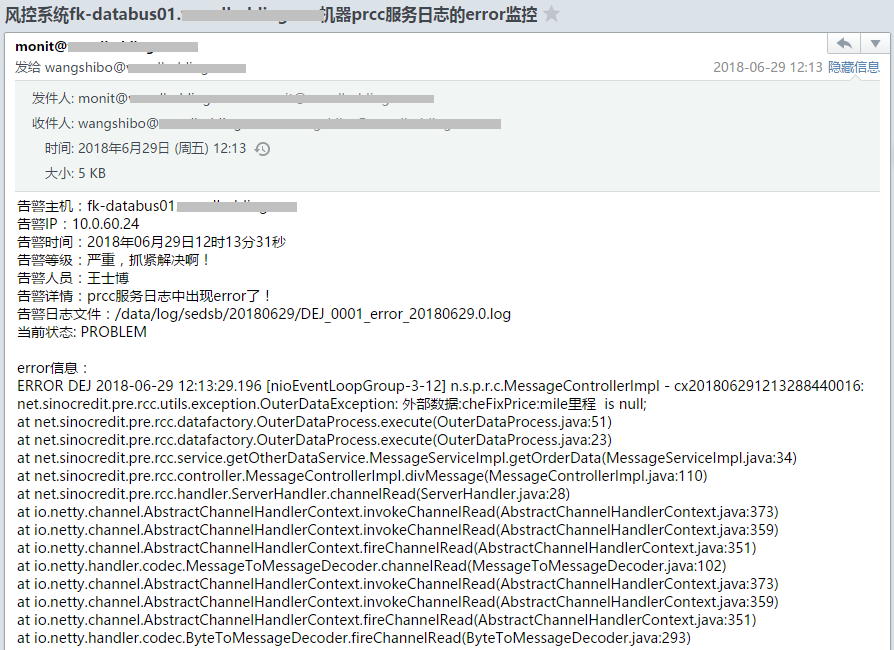
报警邮件效果如下:
**
2)第二类日志
此日志是固定文件,日志内容写入频繁,日志文件比较大。对于此文件的监控,通过采用tail -1000方式获取日志文件的最新1000行的方式进行error监控!
举例说明:
[root@fk-zqjcweb01 ~]# ll /data/log/decision/decision.log
-rw-rw-r-- 1 zquser zquser 5108 Jun 28 16:02 /data/log/decision/decision.log

采用sendemail发送告警邮件,sendemail安装参考:http://10.0.8.50/software/sendemail_install.sh

监控脚本路径:
[root@fk-zqjcweb01 ~]# cd /opt/log_error_script/
[root@fk-zqjcweb01 log_error_script]# ls
decision sendemail.sh
[root@fk-zqjcweb01 log_error_script]# ls decision/
decision.log_diff_error.log decision.log_error.log decision.log_monit.sh

脚本内容:
[root@fk-zqjcweb01 log_error_script]# cat decision/decision.log_monit.sh
#!/bin/sh
ERROR_LOG=/data/log/decision/decision.log
ERROR_NEW_LOG=/opt/log_error_script/decision/decision.log_error.log
ERROR_DIFF_LOG=/opt/log_error_script/decision/decision.log_diff_error.log
DATE=`date +%Y年%m月%d日%H时%M分%S秒`
HOST=`/bin/hostname`
IP=`/sbin/ifconfig|grep "inet addr"|grep "Bcast"|cut -d":" -f2|awk -F" " '{print $1}'`

if [ ! -f $ERROR_NEW_LOG ];then
/bin/touch $ERROR_NEW_LOG
fi

NUM1=$(/usr/bin/tail -1000 $ERROR_LOG|grep error|wc -l)
NUM2=$(/bin/cat $ERROR_NEW_LOG|wc -l)

if [ -f $ERROR_LOG ] && [ $NUM1 -ne 0 ] && [ $NUM2 -eq 0 ];then
/bin/bash /opt/log_error_script/sendemail.sh [email protected] "风控系统${HOSTNAME}机器的decision.log日志中的error监控" "告警主机:${HOSTNAME} \n告警IP:${IP} \n告警时间:${DATE} \n告警等级:严重,抓紧解决啊! \n告警人员:王士博 \n告警详情:decision.log日志中出现error了! \n告警日志文件:${ERROR_LOG} \n当前状态: PROBLEM "
/usr/bin/tail -1000 $ERROR_LOG|grep error > $ERROR_NEW_LOG
fi

/usr/bin/tail -1000 $ERROR_LOG|grep error > $ERROR_DIFF_LOG
/usr/bin/cmp $ERROR_DIFF_LOG $ERROR_NEW_LOG >/dev/null 2>&1
if [ $? -ne 0 ];then
/bin/bash /opt/log_error_script/sendemail.sh [email protected] "风控系统${HOSTNAME}机器的decision.log日志中的error监控" "告警主机:${HOSTNAME} \n告警IP:${IP} \n告警时间:${DATE} \n告警等级:严重,抓紧解决啊! \n告警人员:王士博 \n告警详情:decision.log日志中出现error了! \n告警日志文件:${ERROR_LOG} \n当前状态: PROBLEM "
/usr/bin/tail -1000 $ERROR_LOG|grep error > $ERROR_NEW_LOG
fi
You have new mail in /var/spool/mail/root

结合crontab进行定时监控
[root@fk-zqjcweb01 log_error_script]# crontab -l
#decision.log日志的error监控
* * * * * /bin/bash -x /opt/log_error_script/decision/decision.log_monit.sh >/dev/null 2>&1
* * * * * sleep 15;/bin/bash -x /opt/log_error_script/decision/decision.log_monit.sh >/dev/null 2>&1
* * * * * sleep 30;/bin/bash -x /opt/log_error_script/decision/decision.log_monit.sh >/dev/null 2>&1
* * * * * sleep 45;/bin/bash -x /opt/log_error_script/decision/decision.log_monit.sh >/dev/null 2>&1
上面提到的sendemail.sh邮件发送脚本
[root@fk-zqjcweb01 ~]# cat /opt/log_error_script/sendemail.sh
#!/bin/bash
# Filename: SendEmail.sh
# Notes: 使用sendEmail
#
# 脚本的日志文件
LOGFILE="/tmp/Email.log"
:>"$LOGFILE"
exec 1>"$LOGFILE"
exec 2>&1
SMTP_server='smtp.kevin.com'
username='[email protected]'
password='monit@123'
from_email_address='[email protected]'
to_email_address="$1"
message_subject_utf8="$2"
message_body_utf8="$3"
# 转换邮件标题为GB2312,解决邮件标题含有中文,收到邮件显示乱码的问题。
message_subject_gb2312=`iconv -t GB2312 -f UTF-8 << EOF
$message_subject_utf8
EOF`
[ $? -eq 0 ] && message_subject="$message_subject_gb2312" || message_subject="$message_subject_utf8"
# 转换邮件内容为GB2312,解决收到邮件内容乱码
message_body_gb2312=`iconv -t GB2312 -f UTF-8 << EOF
$message_body_utf8
EOF`
[ $? -eq 0 ] && message_body="$message_body_gb2312" || message_body="$message_body_utf8"
# 发送邮件
sendEmail='/usr/local/bin/sendEmail'
set -x
$sendEmail -s "$SMTP_server" -xu "$username" -xp "$password" -f "$from_email_address" -t "$to_email_address" -u "$message_subject" -m "$message_body" -o message-content-type=text -o message-charset=gb2312
3)第三类日志
日志规则说明:
- 在etl服务器下的EXP、MDB、MID、ODB、PDB、PUS、SDB系统里有很多任务日志,日志都存放在当天的日期目录下。
- 现在需要对这些任务日志的error进行监控,当出现error报错信息时立刻发出报警!
- 当这些任务日志文件里有出现error报错信息的,那么该任务日志文件就不会被写入了。也就是说一个任务日志文件只会出现一次error报错。
- 出现error报错信息的任务日志不能删除和更改,因为这些任务日志会被其他程序调用展示。
[root@bigdata-etl01 ~]# ll /data/etluser/LOG/
drwxrwx--- 33 etluser etluser     4096 Jul  6 02:00 EXP
drwxrwx--- 33 etluser etluser     4096 Jul  6 02:00 MDB
drwxrwx--- 33 etluser etluser     4096 Jul  6 02:00 MID
drwxrwx--- 33 etluser etluser     4096 Jul  6 02:00 ODB
drwxrwx--- 33 etluser etluser     4096 Jul  6 02:00 PDB
drwxrwx--- 32 etluser etluser     4096 Jul  6 00:47 PUS
drwxrwx--- 33 etluser etluser     4096 Jul  6 02:00 SDB
[root@bigdata-etl01 ~]# ls /data/etluser/LOG/EXP/
20180606  20180609  20180612  20180615  20180618  20180621  20180624  20180627  20180630  20180703  20180706
20180607  20180610  20180613  20180616  20180619  20180622  20180625  20180628  20180701  20180704
20180608  20180611  20180614  20180617  20180620  20180623  20180626  20180629  20180702  20180705
[root@bigdata-etl01 ~]# ls /data/etluser/LOG/EXP/20180706/
EXP_EXP_V_CUST_CRDT_SITU_20180705[1][1].54.log                exp_v_opr_size_curr_stats_0010601[1].pl.56.log
EXP_EXP_V_DAILY_BIZ_AMT_SITU_20180705[1][1].45.log            exp_v_opr_size_curr_stats_0010602[1].pl.56.log
EXP_EXP_V_MATR_RMND_INTFC_QG6_001_20180705[1][1].83.log       exp_v_prvs_provs_int_intfc_f0_0010600[1].pl.103.log
EXP_EXP_V_OPR_SIZE_CURR_STATS_001_20180705[1][1].56.log       exp_v_prvs_provs_int_intfc_f0_0010601[1].pl.103.log
EXP_EXP_V_PRVS_PROVS_INT_INTFC_F0_001_20180705[1][1].103.log  exp_v_prvs_provs_int_intfc_f0_0020600[1].pl.98.log
EXP_EXP_V_PRVS_PROVS_INT_INTFC_F0_002_20180705[1][1].98.log   exp_v_prvs_provs_int_intfc_f0_0020601[1].pl.98.log
EXP_EXP_V_PRVS_PROVS_INT_INTFC_F0_003_20180705[1][1].90.log   exp_v_prvs_provs_int_intfc_f0_0030600[1].pl.90.log
EXP_EXP_V_PRVS_PROVS_INT_INTFC_F0_007_20180705[1][1].48.log   exp_v_prvs_provs_int_intfc_f0_0030601[1].pl.90.log
EXP_EXP_V_PRVS_PROVS_INT_INTFC_F0_008_20180705[1][1].78.log   exp_v_prvs_provs_int_intfc_f0_0070600[1].pl.48.log
EXP_EXP_V_PRVS_PROVS_INT_INTFC_F0_009_20180705[1][1].15.log   exp_v_prvs_provs_int_intfc_f0_0070601[1].pl.48.log
EXP_EXP_V_PRVS_PROVS_INT_INTFC_F0_010_20180705[1][1].48.log   exp_v_prvs_provs_int_intfc_f0_0080600[1].pl.78.log
EXP_EXP_V_PRVS_PROVS_INT_INTFC_F1_004_20180705[1][1].16.log   exp_v_prvs_provs_int_intfc_f0_0080601[1].pl.78.log
EXP_EXP_V_PRVS_PROVS_INT_INTFC_F1_006_20180705[1][1].8.log    exp_v_prvs_provs_int_intfc_f0_0090600[1].pl.15.log
EXP_EXP_V_QRY_FACT_AGT_INTFC_20180705[1][1].47.log            exp_v_prvs_provs_int_intfc_f0_0090601[1].pl.15.log
exp_v_cust_crdt_situ0600[1].pl.54.log                         exp_v_prvs_provs_int_intfc_f0_0100600[1].pl.48.log
exp_v_cust_crdt_situ0601[1].pl.54.log                         exp_v_prvs_provs_int_intfc_f0_0100601[1].pl.48.log
exp_v_cust_crdt_situ0602[1].pl.54.log                         exp_v_prvs_provs_int_intfc_f1_0040600[1].pl.16.log
exp_v_daily_biz_amt_situ0600[1].pl.45.log                     exp_v_prvs_provs_int_intfc_f1_0040601[1].pl.16.log
exp_v_daily_biz_amt_situ0601[1].pl.45.log                     exp_v_prvs_provs_int_intfc_f1_0060600[1].pl.8.log
exp_v_daily_biz_amt_situ0602[1].pl.45.log                     exp_v_prvs_provs_int_intfc_f1_0060601[1].pl.8.log
exp_v_matr_rmnd_intfc_qg6_0010600[1].pl.83.log                exp_v_qry_fact_agt_intfc0600[1].pl.47.log
exp_v_matr_rmnd_intfc_qg6_0010601[1].pl.83.log                exp_v_qry_fact_agt_intfc0601[1].pl.47.log
exp_v_matr_rmnd_intfc_qg6_0010602[1].pl.83.log                exp_v_qry_fact_agt_intfc0602[1].pl.47.log
exp_v_opr_size_curr_stats_0010600[1].pl.56.log

监控脚本思路:
1)对这些任务日志进行批量搜索error关键字(不区分大小写)
2)将出现error关键字的任务日志拷贝到一个专门的目录下(error日志文件的列表目录)。
3)对搜索到error关键字的任务日志做判断,判断它是否存在于那个列表目录下:
   如果不存在,说明是新出现error的日志文件,就立刻报警!
   如果存在,说明出现的error是之前的信息,不报警!

监控脚本编写情况如下:
error_log为error日志文件的列表目录;
sendemail.sh为邮件发送脚本(上面介绍过)
[root@bigdata-etl01 log_error_script]# ls
EXP  MDB  MID  ODB  PDB  PUS  SDB  sendemail.sh
[root@bigdata-etl01 log_error_script]# ls EXP/
error_log  EXP_error_monit.sh
[root@bigdata-etl01 log_error_script]# ls MDB/
error_log  MDB_error_monit.sh
[root@bigdata-etl01 log_error_script]# ls MID/
error_log  MID_error_monit.sh
[root@bigdata-etl01 log_error_script]# ls ODB/
error_log  ODB_error_monit.sh
[root@bigdata-etl01 log_error_script]# ls PDB/
error_log  PDB_error_monit.sh
[root@bigdata-etl01 log_error_script]# ls PUS/
error_log  PUS_error_monit.sh
[root@bigdata-etl01 log_error_script]# ls SDB/
error_log  SDB_error_monit.sh
[root@bigdata-etl01 log_error_script]#

这里贴出SDB系统的任务日志的error监控报警脚本(其他几个系统的监控脚本与这个一样,只需要将脚本中的SDB替换成对应的系统名称即可!)
[root@bigdata-etl01 log_error_script]# cat /opt/log_error_script/SDB/SDB_error_monit.sh
#!/bin/sh
DATE_DIR=$(date +%Y%m%d)
DATE=`date +%Y年%m月%d日%H时%M分%S秒`
HOST=`/bin/hostname`
IP=`/sbin/ifconfig|grep "inet addr"|grep "Bcast"|cut -d":" -f2|awk -F" " '{print $1}'`

cd /data/etluser/LOG/SDB
if [ ! -d $DATE_DIR ];then
/bin/mkdir $DATE_DIR
/bin/chown -R etluser.etluser $DATE_DIR
fi

cd /data/etluser/LOG/SDB/$DATE_DIR
for FILE in $(/bin/ls *.log)
do
   NUM=$(/bin/grep -i "error" /data/etluser/LOG/SDB/$DATE_DIR/$FILE|wc -l)
   ERROR_MESSAGE=$(/bin/grep -i "error" /data/etluser/LOG/SDB/$DATE_DIR/$FILE)
   if [ $NUM -ne 0 ];then
      /bin/ls /opt/log_error_script/SDB/error_log/$FILE
      a=$?
      if [ $a -ne 0 ];then
          /opt/log_error_script/sendemail.sh [email protected] "大数据平台etl服务器${HOSTNAME}的SDB任务日志里出现error了" "告警主机:${HOSTNAME} \n告警IP:${IP} \n告警时间:${DATE} \n告警等级:严重 \n告警人员:王士博 \n告警详情:SDB的任务日志里出现error了,抓紧解决啊! \n当前状态: PROBLEM \n告警日志文件:/data/etluser/LOG/SDB/$DATE_DIR/$FILE \n\n\n------请看下面error报错信息------- \nerror信息:\n$ERROR_MESSAGE"
          cp /data/etluser/LOG/SDB/$DATE_DIR/$FILE /opt/log_error_script/SDB/error_log/
      else
          echo "$FILE日志中error报错信息是之前发生的,无需报警!"
      fi
   else
      echo "$FILE 日志里没有error报错啦"
   fi
done

给脚本赋予执行权限
[root@bigdata-etl01 log_error_script]# chmod 755 /opt/log_error_script/SDB/SDB_error_monit.sh
[root@bigdata-etl01 log_error_script]# sh /opt/log_error_script/SDB/SDB_error_monit.sh
qbl_biz_cst_bsc_inf0100[1].pl.73.log 日志里没有error报错啦
qbl_biz_cst_bsc_inf0101[1].pl.73.log 日志里没有error报错啦
qbl_biz_fnc_bsc_inf0100[1].pl.73.log 日志里没有error报错啦
qbl_biz_fnc_bsc_inf0101[1].pl.73.log 日志里没有error报错啦
qbl_biz_fnc_mod_inf0100[1].pl.73.log 日志里没有error报错啦
qbl_biz_fnc_mod_inf0101[1].pl.73.log 日志里没有error报错啦
qbl_biz_pd_bsc_inf0100[1].pl.73.log 日志里没有error报错啦
qbl_biz_pd_bsc_inf0101[1].pl.73.log 日志里没有error报错啦
qbl_biz_pre_ctr_bsc_inf0100[1].pl.73.log 日志里没有error报错啦
qbl_biz_pre_ctr_bsc_inf0101[1].pl.73.log 日志里没有error报错啦
qbl_biz_repy_base_inf0100[1].pl.73.log 日志里没有error报错啦
qbl_biz_repy_base_inf0101[1].pl.73.log 日志里没有error报错啦
qbl_biz_repy_pl_dtl0100[1].pl.78.log 日志里没有error报错啦
qbl_biz_repy_pl_dtl0101[1].pl.78.log 日志里没有error报错啦
qbl_biz_repy_pl_inf0100[1].pl.78.log 日志里没有error报错啦
qbl_biz_repy_pl_inf0101[1].pl.78.log 日志里没有error报错啦
qbl_biz_repy_rcrd_jrnl0100[1].pl.73.log 日志里没有error报错啦
qbl_biz_repy_rcrd_jrnl0101[1].pl.73.log 日志里没有error报错啦
.......
.......

结合crontab指定脚本定时执行任务(每30秒执行一次)
[root@bigdata-etl01 ~]# crontab -l
#etl相关任务日志的error监控报警
* * * * * /bin/bash -x /opt/log_error_script/EXP/EXP_error_monit.sh >/dev/null 2>&1
* * * * * sleep 30;/bin/bash -x /opt/log_error_script/EXP/EXP_error_monit.sh >/dev/null 2>&1

* * * * * /bin/bash -x /opt/log_error_script/MDB/MDB_error_monit.sh >/dev/null 2>&1
* * * * * sleep 30;/bin/bash -x /opt/log_error_script/MDB/MDB_error_monit.sh >/dev/null 2>&1

* * * * * /bin/bash -x /opt/log_error_script/MID/MID_error_monit.sh >/dev/null 2>&1
* * * * * sleep 30;/bin/bash -x /opt/log_error_script/MID/MID_error_monit.sh >/dev/null 2>&1

* * * * * /bin/bash -x /opt/log_error_script/ODB/ODB_error_monit.sh >/dev/null 2>&1
* * * * * sleep 30;/bin/bash -x /opt/log_error_script/ODB/ODB_error_monit.sh >/dev/null 2>&1

* * * * * /bin/bash -x /opt/log_error_script/PDB/PDB_error_monit.sh >/dev/null 2>&1
* * * * * sleep 30;/bin/bash -x /opt/log_error_script/PDB/PDB_error_monit.sh >/dev/null 2>&1

* * * * * /bin/bash -x /opt/log_error_script/PUS/PUS_error_monit.sh >/dev/null 2>&1
* * * * * sleep 30;/bin/bash -x /opt/log_error_script/PUS/PUS_error_monit.sh >/dev/null 2>&1

* * * * * /bin/bash -x /opt/log_error_script/SDB/SDB_error_monit.sh >/dev/null 2>&1
* * * * * sleep 30;/bin/bash -x /opt/log_error_script/SDB/SDB_error_monit.sh >/dev/null 2>&1
邮件报警效果如下:
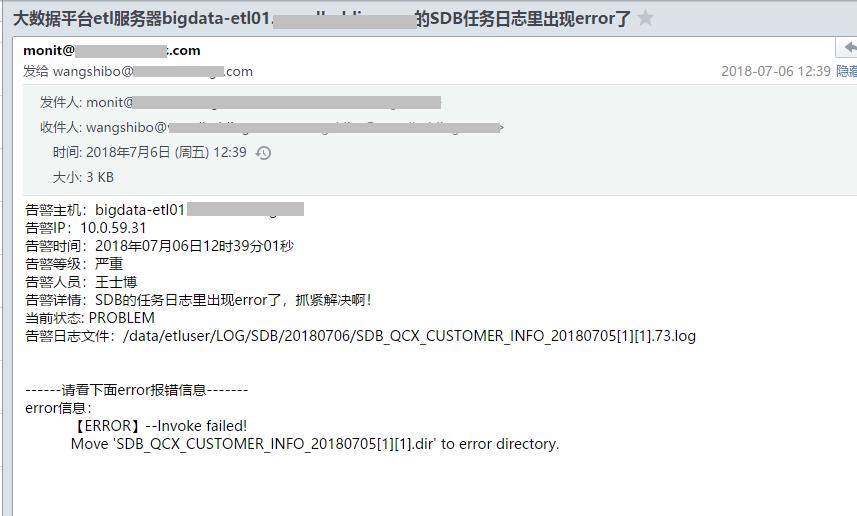
如上可以看出,SDB系统的任务日志里发现了error信息,现在去日志列表目录里查看下,发现出现error信息的任务日志已经拷贝到列表目录里了。
当下次脚本执行,搜索到这些日志发现error时就会去做判断,判断这些日志是否存在列表目录里,如果出现,就不会再次发出报警。
[root@bigdata-etl01 ~]# ll /opt/log_error_script/SDB/error_log/
total 12
-rw-r--r-- 1 root root 1978 Jul  6 10:36 SDB_QCX_CUSTOMER_INFO_20180705[1][1].73.log
-rw-r--r-- 1 root root 1939 Jul  6 10:19 SDB_QCX_FTTYPE_STC_20180705[1][1].51.log
-rw-r--r-- 1 root root 1939 Jul  6 10:19 SDB_QCX_SETTLE_STC_20180705[1][1].17.log
十三、网站访问状态和超时时间监控报警设置
对网站访问状态和超时时间进行监控:当code状态为5xx或者访问超时时间大于10s时进行报警。脚本脚本如下:
[root@qd-inf-logcollector01 web_monit]$ pwd
/app/script/web_monit

[root@qd-inf-logcollector01 web_monit]$ ll
total 12
-rwxr-xr-x 1 root root 870 Oct 12 21:34 http_monit.sh      //监控脚本
-rwxr-xr-x 1 root root 857 Oct 12 21:25 sms.py             //短信报警脚本,里面有报警联系人
-rw-r--r-- 1 root root 377 Oct 12 21:27 weblist.txt        //监控的网站域名列表

[root@qd-inf-logcollector01 web_monit]$ cat http_monit.sh
#!/bin/sh
weblist=/app/script/web_monit/weblist.txt
for list in `cat $weblist|grep -E -v "#|^$"`
do
httpcode=`curl -o /dev/null -s -w %{

     http_code} "$list"`
httptime=`curl -o /dev/null -s -w "time_connect: %{time_connect}\ntime_starttransfer: %{time_starttransfer}\ntime_total: %{time_total}\n" "$list"|grep time_total|awk -F ":" '{print $2*1000}'`
if [ $httpcode = 500 ]||[ $httpcode = 502 ]||[ $httpcode = 503 ]||[ $httpcode = 504 ]
then
   python /app/script/web_monit/sms.py $list "$list 访问有误!状态码为$httpcode!请收到报警后尽快查看并处理!"
else
   echo "$list is checked ok!"
fi

if [ $httptime -ge 10000 ]
then
   python /app/script/web_monit/sms.py $list " $list访问超时!超时时间为$httptime毫秒!请收到报警后尽快查看并处理!"
else
  echo "$list is connect ok!"
fi
done
手动检查网站访问的code状态码
[root@qd-inf-logcollector01 web_monit]$ curl -o /dev/null -s -w %{

    http_code} http://www.wang.com
200
手动检查网站访问的超时时间(单位:毫秒,如下网址访问的时间为0.8秒)
[root@qd-inf-logcollector01 web_monit]$ curl -o /dev/null -s -w "time_connect: %{time_connect}\ntime_starttransfer: %{time_starttransfer}\ntime_total: %{time_total}\n" http://www.wang.com |grep time_total|awk -F ":" '{print $2*1000}'
800
网站列表和脚本执行
[root@qd-inf-logcollector01 web_monit]$cat weblist.txt
http://nop.kevin.cn
http://ap.kevin.cn
http://ope.kevin.cn
http://opr.kevin.cn
http://www.kevin.cn
http://kevin.cn
http://tb.kevin.cn
http://www.wang.com
https://www.wang.com

http://doc.kevin.cn
http://docs.kevin.cn
http://git.wang.com
http://monitor.kevin.cn
http://dash.kevin.cn

[root@qd-inf-logcollector01 web_monit]$sh http_monit.sh
http://nop.kevin.cn is checked ok!
http://nop.kevin.cn is connect ok!
http://ap.kevin.cn is checked ok!
http://ap.kevin.cn is connect ok!
http://ope.kevin.cn is checked ok!
http://ope.kevin.cn is connect ok!
http://opr.kevin.cn is checked ok!
http://opr.kevin.cn is connect ok!
http://www.kevin.cn is checked ok!
http://www.kevin.cn is connect ok!
http://kevin.cn is checked ok!
http://kevin.cn is connect ok!
http://tb.kevin.cn is checked ok!
http://tb.kevin.cn is connect ok!
http://www.wang.com is checked ok!
http://www.wang.com is connect ok!
https://www.wang.com is checked ok!
https://www.wang.com is connect ok!
http://doc.kevin.cn is checked ok!
http://doc.kevin.cn is connect ok!
http://docs.kevin.cn is checked ok!
http://docs.kevin.cn is connect ok!
http://git.wang.com is checked ok!
http://git.wang.com is connect ok!
http://monitor.kevin.cn is checked ok!
http://monitor.kevin.cn is connect ok!
http://dash.kevin.cn is checked ok!
http://dash.kevin.cn is connect ok!
定时监控任务(每两分钟监控一次)
[root@qd-inf-logcollector01 web_monit]$ crontab -l
*/2 * * * * /bin/bash -x /app/script/web_monit/http_monit.sh  > /dev/null 2>&1
简单注意下:比较运算符只有==和!=是用于字符串比较的,不可用于整数比较;整数比较只能使用-eq, -gt这种形式
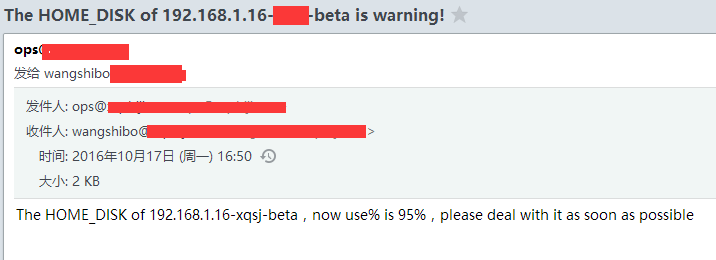
十四、服务器磁盘监控脚本分享(含报警邮件)
在日常的运维工作中,我们经常会对服务器的磁盘使用情况进行巡检,以防止磁盘爆满导致的业务故障。如果能编写一个合理完善的监控脚本,当磁盘使用率达到我们设置的阀值时,就自动发送报警邮件,以便我们及时获悉到快爆满的磁盘情况!
下面分享一个脚本:
监控本机的根磁盘和home盘,当根磁盘使用率达到90%和home磁盘使用率达到95%的时候,发报警邮件至[email protected]和[email protected]
[root@kevin ~]# df -h
Filesystem                    Size  Used Avail Use% Mounted on
/dev/mapper/VolGroup-lv_root   50G   46G   12G  90% /
tmpfs                          32G   68K   32G   1% /dev/shm
/dev/sda1                     485M   40M  421M   9% /boot
/dev/mapper/VolGroup-lv_home  836G  795G  673G  95% /home

取根磁盘当前利用率的百分值
[root@kevin ~]# /bin/df -h|grep /dev/mapper/VolGroup-lv_root|awk -F" " '{print $5}'|cut -d"%" -f1
90

取home盘当前利用率的百分值
[root@kevin ~]# /bin/df -h|grep /dev/mapper/VolGroup-lv_home|awk -F" " '{print $5}'|cut -d"%" -f1
95

编写邮件报警脚本
[root@kevin ~]# vim /root/root_disk.sh
#!/bin/bash
SERVER_IP=`ifconfig|grep 192.168.1|awk -F":" '{print $2}'|cut -d" " -f1`
ROOT_DISK=`/bin/df -h|grep /dev/mapper/VolGroup-lv_root|awk -F" " '{print $5}'|cut -d"%" -f1`
HOME_DISK=`/bin/df -h|grep /dev/mapper/VolGroup-lv_home|awk -F" " '{print $5}'|cut -d"%" -f1`

if [ $ROOT_DISK -ge 90 ];then
/usr/local/bin/sendEmail -f [email protected] -t [email protected] -s smtp.kevin.cn -u " The ROOT_DISK of $SERVER_IP-$HOSTNAME is warning!" -o message-content-type=html -o message-charset=utf8 -xu [email protected] -xp zh@123bj -m "The ROOT_DISK of $SERVER_IP-$HOSTNAME,now use% is 90%,please deal with it as soon as possible"
/usr/local/bin/sendEmail -f [email protected] -t [email protected] -s smtp.kevin.cn -u " The ROOT_DISK of $SERVER_IP-$HOSTNAME is warning!" -o message-content-type=html -o message-charset=utf8 -xu [email protected] -xp zh@123bj -m "The ROOT_DISK of $SERVER_IP-$HOSTNAME,now use% is 90%,please deal with it as soon as possible"
else
echo "The ROOT_DISK of $SERVER_IP-$HOSTNAME is Enough to use"
fi

sleep 5

if [ $HOME_DISK -ge 95 ];then
/usr/local/bin/sendEmail -f [email protected] -t [email protected] -s smtp.kevin.cn -u " The HOME_DISK of $SERVER_IP-$HOSTNAME is warning!" -o message-content-type=html -o message-charset=utf8 -xu [email protected] -xp zh@123bj -m "The HOME_DISK of $SERVER_IP-$HOSTNAME,now use% is 95%,please deal with it as soon as possible"
/usr/local/bin/sendEmail -f [email protected] -t [email protected] -s smtp.kevin.cn -u " The HOME_DISK of $SERVER_IP-$HOSTNAME is warning!" -o message-content-type=html -o message-charset=utf8 -xu [email protected] -xp zh@123bj -m "The HOME_DISK of $SERVER_IP-$HOSTNAME,now use% is 95%,please deal with it as soon as possible"
else
echo "The ROOT_DISK of $SERVER_IP-$HOSTNAME is Enough to use"
fi

===============================================================
设置计划任务
[root@kevin ~]# crontab -e
*/30 * * * * /bin/bash -x /root/root_disk.sh > /dev/null 2>&1
上面脚本中的邮件报警用的是sendemail,需要提前安装sendemail环境,安装操作如下:
1)先下载安装包到本地,解压。
[root@kevin ~]# cd /usr/local/src/
[root@kevin src]# wget -c http://caspian.dotconf.net/menu/Software/SendEmail/sendEmail-v1.56.tar.gz
[root@kevin src]# tar -zvxf sendEmail-v1.56.tar.gz
[root@kevin src]# cd sendEmail-v1.56
[root@kevin sendEmail-v1.56]# cp -a sendEmail /usr/local/bin/
[root@kevin sendEmail-v1.56]# chmod +x /usr/local/bin/sendEmail
[root@kevin sendEmail-v1.56]# file /usr/local/bin/sendEmail
/usr/local/bin/sendEmail: a /usr/bin/perl -w script text executable
2)安装下依赖
[root@kevin sendEmail-v1.56]# yum install perl-Net-SSLeay perl-IO-Socket-SSL -y
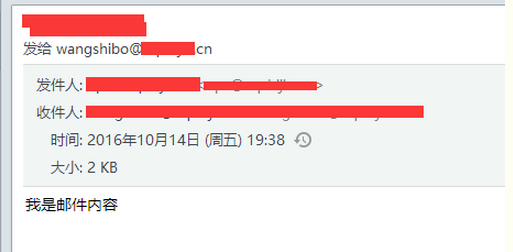
[root@kevin sendEmail-v1.56]# /usr/local/bin/sendEmail -f [email protected] -t [email protected] -s smtp.kevin.cn -u "我是邮件主题" -o message-content-type=html -o message-charset=utf8 -xu [email protected] -xp zh@123bj -m "我是邮件内容"
命令说明:
/usr/local/bin/sendEmail #命令主程序
-f [email protected] #发件人邮箱
-t [email protected] #收件人邮箱
-s smtp.huanqi.cn #发件人邮箱的smtp服务器
-u "我是邮件主题" #邮件的标题
-o message-content-type=html #邮件内容的格式,html表示它是html格式
-o message-charset=utf8 #邮件内容编码
-xu [email protected] #发件人邮箱的用户名
-xp zh@123bj #发件人邮箱密码
-m "我是邮件内容" #邮件的具体内容
例如:
[root@kevin alertscripts]# /usr/local/bin/sendEmail -f [email protected] -t [email protected] -s smtp.kevin.cn -u "我是邮件主题" -o message-content-type=html -o message-charset=utf8 -xu [email protected] -xp zh@123bj -m "我是邮件内容"
Oct 14 19:38:29 kevin sendEmail[65454]: Email was sent successfully!
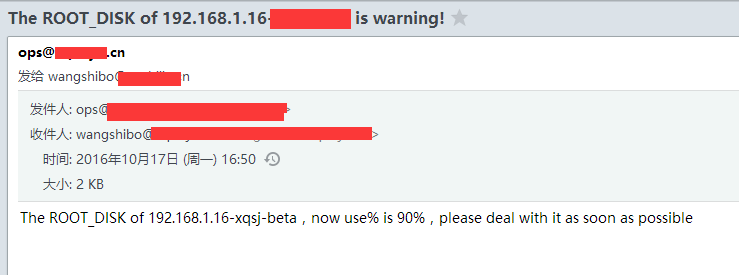
登陆[email protected]邮箱,发现已经收到了上面发送的邮件:
十五、业务日志清理脚本
线上某些系统业务跑一段时间后,日志就会越来越多,考虑到业务机器磁盘有限,需要添加业务日志清理功能。根据日志所在分区磁盘使用情况来判断是否清理日志,比如当日志分区磁盘空间使用超过90%时,将一周前的日志打包转移到别处 (别的分区下或远程存储设备上)。脚本 (/opt/script/log_clear.sh) 如下:
#!/bin/bash

#定义日志所在分区当前空间所占比例数(去掉%)。grep -w表示精准匹配,只匹配"/"这个分区
LOG_PARTITION=$(`which df` -h|awk '{print $5,$6}'|grep -w "/"|cut -d" " -f1|awk -F"%" '{print $1}')
#定义一周前的日期,用于日志分区空间超过设定的阈值后保留的份数(这里保留一周的日志)
KEEP_DATE=`date -d '-7 days' +%Y%m%d`
#定义日志路径
LOG_DIR=/opt/log/kevin
#定义日志备份路径(即当日志分区空间超过阈值后,将日志转移到该处。这里就转移到了本地home分区下,也可以转移到别的机器或远程存储设备上)
LOG_BACK_DIR=/home/log/kevin

#确保日志备份路径存在,如果不存在,则创建该路径。
if [ ! -d ${LOG_BACK_DIR} ];then
   `which mkdir` -p ${LOG_BACK_DIR}
else
   echo "${LOG_BACK_DIR} is exist" >/dev/null 2>&1
fi

#当日志分区当前空间超过90%时执行的动作
if [ ${LOG_PARTITION} -ge 90 ];then

   #切换到日志路径下
   cd ${LOG_DIR}
   #截取日志文件中的日期,比如stepweb_20190915.log日志文件,则截取20190915
   for LOG_DATE in $(ls -l ${

     LOG_DIR}|awk '{print $9}'|cut -d"_" -f2|awk -F"." '{print $1}')
   do
     #当日志文件中截取的日期是一周之前的日志时执行的动作
     if [ ${LOG_DATE} -lt ${KEEP_DATE} ];then
       #打包,转移,删除
       #注意这里tar使用-P参数,因为tar默认为相对路径,使用绝对路径的话会报错"Removing leading `/’ from member names",使用-P参数就解决了该问题
       `which tar` -zvPcf ${LOG_DIR}/stepweb_${LOG_DATE}.log.tar.gz ${LOG_DIR}/stepweb_${LOG_DATE}.log
       mv ${LOG_DIR}/stepweb_${LOG_DATE}.log.tar.gz ${LOG_BACK_DIR}/
       rm -rf ${LOG_DIR}/stepweb_${LOG_DATE}.log
     else
       echo "keep stepweb_${LOG_DATE}.log" >/dev/null 2>&1
     fi
   done
else
   echo "${LOG_PARTITION} is available" >/dev/null 2>&1
fi
根据上面脚本验证下:
查看本机磁盘使用情况,日志所在分区磁盘当前使用率达到92%了
[root@yyweb kevin]# df -h
Filesystem               Size  Used Avail Use% Mounted on
/dev/mapper/centos-root   50G  46G   4G     92% /
devtmpfs                 3.9G     0  3.9G   0% /dev
tmpfs                    3.9G     0  3.9G   0% /dev/shm
tmpfs                    3.9G   34M  3.8G   1% /run
tmpfs                    3.9G     0  3.9G   0% /sys/fs/cgroup
/dev/sda1               1014M  183M  832M  19% /boot
/dev/mapper/centos-home  142G   33M  142G   1% /home

日志所在路径
[root@yyweb kevin]# pwd
/opt/log/kevin

日志情况
[root@yyweb kevin]# ls
stepweb_20190810.log  stepweb_20190817.log  stepweb_20190824.log  stepweb_20190901.log  stepweb_20190908.log  stepweb_20190915.log
stepweb_20190811.log  stepweb_20190818.log  stepweb_20190825.log  stepweb_20190902.log  stepweb_20190909.log  stepweb_20190916.log
stepweb_20190812.log  stepweb_20190819.log  stepweb_20190826.log  stepweb_20190903.log  stepweb_20190910.log  stepweb_20190917.log
stepweb_20190813.log  stepweb_20190820.log  stepweb_20190827.log  stepweb_20190904.log  stepweb_20190911.log  stepweb_20190918.log
stepweb_20190814.log  stepweb_20190821.log  stepweb_20190828.log  stepweb_20190905.log  stepweb_20190912.log  stepweb_20190919.log
stepweb_20190815.log  stepweb_20190822.log  stepweb_20190829.log  stepweb_20190906.log  stepweb_20190913.log
stepweb_20190816.log  stepweb_20190823.log  stepweb_20190830.log  stepweb_20190907.log  stepweb_20190914.log

[root@yyweb kevin]# ls /home/
[root@yyweb kevin]#

执行日志清理脚本
[root@yyweb kevin]# sh /opt/script/log_clear.sh
/opt/log/kevin/stepweb_20190810.log
/opt/log/kevin/stepweb_20190811.log
/opt/log/kevin/stepweb_20190812.log
/opt/log/kevin/stepweb_20190813.log
/opt/log/kevin/stepweb_20190814.log
/opt/log/kevin/stepweb_20190815.log
/opt/log/kevin/stepweb_20190816.log
/opt/log/kevin/stepweb_20190817.log
/opt/log/kevin/stepweb_20190818.log
/opt/log/kevin/stepweb_20190819.log
/opt/log/kevin/stepweb_20190820.log
/opt/log/kevin/stepweb_20190821.log
/opt/log/kevin/stepweb_20190822.log
/opt/log/kevin/stepweb_20190823.log
/opt/log/kevin/stepweb_20190824.log
/opt/log/kevin/stepweb_20190825.log
/opt/log/kevin/stepweb_20190826.log
/opt/log/kevin/stepweb_20190827.log
/opt/log/kevin/stepweb_20190828.log
/opt/log/kevin/stepweb_20190829.log
/opt/log/kevin/stepweb_20190830.log
/opt/log/kevin/stepweb_20190901.log
/opt/log/kevin/stepweb_20190902.log
/opt/log/kevin/stepweb_20190903.log
/opt/log/kevin/stepweb_20190904.log
/opt/log/kevin/stepweb_20190905.log
/opt/log/kevin/stepweb_20190906.log
/opt/log/kevin/stepweb_20190907.log
/opt/log/kevin/stepweb_20190908.log
/opt/log/kevin/stepweb_20190909.log
/opt/log/kevin/stepweb_20190910.log
/opt/log/kevin/stepweb_20190911.log
/opt/log/kevin/stepweb_20190912.log

日志清理后,日志路径下只保留了最近一周的日志
[root@yyweb kevin]# ls
stepweb_20190913.log  stepweb_20190915.log  stepweb_20190917.log  stepweb_20190919.log
stepweb_20190914.log  stepweb_20190916.log  stepweb_20190918.log

一周之前的日志被打包转移到/home/log/kevin下了
[root@yyweb kevin]# ls /home/log/kevin/
stepweb_20190810.log.tar.gz  stepweb_20190817.log.tar.gz  stepweb_20190824.log.tar.gz  stepweb_20190901.log.tar.gz  stepweb_20190908.log.tar.gz
stepweb_20190811.log.tar.gz  stepweb_20190818.log.tar.gz  stepweb_20190825.log.tar.gz  stepweb_20190902.log.tar.gz  stepweb_20190909.log.tar.gz
stepweb_20190812.log.tar.gz  stepweb_20190819.log.tar.gz  stepweb_20190826.log.tar.gz  stepweb_20190903.log.tar.gz  stepweb_20190910.log.tar.gz
stepweb_20190813.log.tar.gz  stepweb_20190820.log.tar.gz  stepweb_20190827.log.tar.gz  stepweb_20190904.log.tar.gz  stepweb_20190911.log.tar.gz
stepweb_20190814.log.tar.gz  stepweb_20190821.log.tar.gz  stepweb_20190828.log.tar.gz  stepweb_20190905.log.tar.gz  stepweb_20190912.log.tar.gz
stepweb_20190815.log.tar.gz  stepweb_20190822.log.tar.gz  stepweb_20190829.log.tar.gz  stepweb_20190906.log.tar.gz
stepweb_20190816.log.tar.gz  stepweb_20190823.log.tar.gz  stepweb_20190830.log.tar.gz  stepweb_20190907.log.tar.gz
再贴一个简单的日志处理脚本
#!/usr/bin/sh
#根据系统/服务/日志保留天数三个参数压缩日志
#usage: sh clearlog.sh sysname appname keepdays
sysName=$1
appName=$2
keepDay=$3
logDir=/var/log/${sysName}/${appName}
logFile=${appName}.log
cd ${logDir}
find ./ -name "${logFile}.*[0-9][0-9]" -mtime +${keepDay} -exec gzip {

    } \;
十六、Linux下间隔多少秒 (即以秒为单位) 去执行某条命令或某个shell脚本的操作方法
在日常运维工作中, 经常会碰到以秒为单位去定时执行某些命令或监控脚本的需求。 说到定时任务就要用到crontab,通常来说,crontab的最小单位是分钟级别,要想实现秒级别的定时任务,就要进行特殊设置了。
[root@test ~]# cat /root/kevin.sh
#!/bin/bash
echo "beijing is so good!" >> /root/test.log

添加脚本执行权限,并配置到crontab计划任务里(使用&& 或者 ;都是一样的效果)。思路:先过一分钟执行第一次,接着就是每隔2秒钟执行一次。
[root@test ~]# chmod 755 /root/kevin.sh
[root@test ~]# crontab -e
* * * * * /bin/bash -x /root/kevin.sh >/dev/null 2>&1
* * * * * sleep 2 &&  /bin/bash -x /root/kevin.sh >/dev/null 2>&1
* * * * * sleep 4; /bin/bash -x /root/kevin.sh >/dev/null 2>&1
* * * * * sleep 6; /bin/bash -x /root/kevin.sh >/dev/null 2>&1
* * * * * sleep 8; /bin/bash -x /root/kevin.sh >/dev/null 2>&1
* * * * * sleep 10; /bin/bash -x /root/kevin.sh >/dev/null 2>&1
* * * * * sleep 12; /bin/bash -x /root/kevin.sh >/dev/null 2>&1
* * * * * sleep 14; /bin/bash -x /root/kevin.sh >/dev/null 2>&1
* * * * * sleep 16; /bin/bash -x /root/kevin.sh >/dev/null 2>&1
* * * * * sleep 18; /bin/bash -x /root/kevin.sh >/dev/null 2>&1
* * * * * sleep 20; /bin/bash -x /root/kevin.sh >/dev/null 2>&1
* * * * * sleep 22; /bin/bash -x /root/kevin.sh >/dev/null 2>&1
* * * * * sleep 24; /bin/bash -x /root/kevin.sh >/dev/null 2>&1
* * * * * sleep 26; /bin/bash -x /root/kevin.sh >/dev/null 2>&1
* * * * * sleep 28; /bin/bash -x /root/kevin.sh >/dev/null 2>&1
* * * * * sleep 30; /bin/bash -x /root/kevin.sh >/dev/null 2>&1
* * * * * sleep 32; /bin/bash -x /root/kevin.sh >/dev/null 2>&1
* * * * * sleep 34; /bin/bash -x /root/kevin.sh >/dev/null 2>&1
* * * * * sleep 36; /bin/bash -x /root/kevin.sh >/dev/null 2>&1
* * * * * sleep 38; /bin/bash -x /root/kevin.sh >/dev/null 2>&1
* * * * * sleep 40; /bin/bash -x /root/kevin.sh >/dev/null 2>&1
* * * * * sleep 42; /bin/bash -x /root/kevin.sh >/dev/null 2>&1
* * * * * sleep 44; /bin/bash -x /root/kevin.sh >/dev/null 2>&1
* * * * * sleep 46; /bin/bash -x /root/kevin.sh >/dev/null 2>&1
* * * * * sleep 48; /bin/bash -x /root/kevin.sh >/dev/null 2>&1
* * * * * sleep 50; /bin/bash -x /root/kevin.sh >/dev/null 2>&1
* * * * * sleep 52; /bin/bash -x /root/kevin.sh >/dev/null 2>&1
* * * * * sleep 54; /bin/bash -x /root/kevin.sh >/dev/null 2>&1
* * * * * sleep 56; /bin/bash -x /root/kevin.sh >/dev/null 2>&1
* * * * * sleep 58; /bin/bash -x /root/kevin.sh >/dev/null 2>&1

[root@test ~]# tail -f /root/test.log
beijing is so good!
beijing is so good!
beijing is so good!
beijing is so good!
beijing is so good!
beijing is so good!
beijing is so good!
beijing is so good!
beijing is so good!
..........
..........
十七、Linux下批量ping某个网段ip的脚本
比如现在需要对172.16.50.0/24网段的ip进行检查,检查哪些ip现在被占用,哪些ip没有被占用,可以通过ping命令来检查,脚本如下:
[root@uatdns01 opt]# vim /opt/ping.sh
#!/bin/bash
. /etc/init.d/functions
for var in {

    1..254};
do
ip=172.16.50.$var
ping -c2 $ip >/dev/null 2>&1
if [ $? = 0 ];then
action "$ip" /bin/true
else
action "$ip" /bin/false
fi
done

[root@uatdns01 opt]# chmod 755 /opt/ping.sh
[root@uatdns01 opt]# sh /opt/ping.sh
172.16.50.1                                                [  OK  ]
172.16.50.2                                                [FAILED]
172.16.50.3                                                [FAILED]
172.16.50.4                                                [FAILED]
172.16.50.5                                                [FAILED]
.........
.........
172.16.50.99                                             [  OK  ]
172.16.50.100                                            [  OK  ]
172.16.50.101                                            [  OK  ]
172.16.50.102                                            [  OK  ]
172.16.50.103                                            [  OK  ]
172.16.50.104                                            [  OK  ]
172.16.50.105                                            [  OK  ]
172.16.50.106                                            [  OK  ]
172.16.50.107                                            [  OK  ]
172.16.50.108                                            [  OK  ]
172.16.50.109                                            [  OK  ]
172.16.50.110                                            [  OK  ]
172.16.50.111                                            [FAILED]
172.16.50.112                                            [  OK  ]
获取172.16.60.0/24网段可用ip的shell脚本
[root@ansible-server ~]# cat ip_ping.sh
#!/bin/bash
ip=1
while [ $ip != "254" ]; do
ping 172.16.60.$ip -c 2 | grep -q "ttl=" && echo "172.16.60.$ip yes" || echo "172.16.60.$ip no"
ip=`expr "$ip" "+" "1"`
done

执行:
[root@ansible-server ~]# sh ip_ping.sh
172.16.60.1 yes
172.16.60.2 no
172.16.60.3 no
.............
172.16.60.24 yes
172.16.60.25 yes
172.16.60.26 no
.............

如果只打印可用ip, 则脚本修改如下:
[root@ansible-server ~]# cat ip_ping.sh
#!/bin/bash
ip=1
while [ $ip != "254" ]; do
ping 172.16.60.$ip -c 2 | grep -q "ttl=" && echo "172.16.60.$ip yes" || echo "172.16.60.$ip no" >/dev/null 2>&1
ip=`expr "$ip" "+" "1"`
done

执行:
[root@ansible-server ~]# sh ip_ping.sh
172.16.60.1 yes
172.16.60.21 yes
172.16.60.22 yes
172.16.60.23 yes
172.16.60.24 yes
172.16.60.25 yes
172.16.60.31 yes
172.16.60.32 yes
172.16.60.33 yes
172.16.60.34 yes
172.16.60.35 yes
172.16.60.36 yes
172.16.60.37 yes
172.16.60.38 yes
172.16.60.39 yes


获取172.16.50.0/24, 172.16.51.0/24, 172.16.60.0/24 三个网段的可用ip
[root@ansible-server ~]# cat ip_ping.sh
#!/bin/bash
ip=1
while [ $ip != "254" ]; do

ping 172.16.50.$ip -c 2 | grep -q "ttl=" && echo "172.16.50.$ip yes" || echo "172.16.50.$ip no" >/dev/null 2>&1
ip=`expr "$ip" "+" "1"`

ping 172.16.51.$ip -c 2 | grep -q "ttl=" && echo "172.16.51.$ip yes" || echo "172.16.51.$ip no" >/dev/null 2>&1
ip=`expr "$ip" "+" "1"`

ping 172.16.60.$ip -c 2 | grep -q "ttl=" && echo "172.16.60.$ip yes" || echo "172.16.60.$ip no" >/dev/null 2>&1
ip=`expr "$ip" "+" "1"`

done

执行:
[root@ansible-server ~]# sh ip_ping.sh
172.16.50.1 yes
172.16.51.11 yes
172.16.50.16 yes
172.16.50.19 yes
172.16.51.20 yes
172.16.60.21 yes
172.16.50.22 yes
172.16.60.24 yes
172.16.50.25 yes
172.16.50.31 yes
172.16.60.33 yes
172.16.51.35 yes
172.16.60.36 yes
172.16.60.39 yes
172.16.51.41 yes
172.16.51.44 yes
172.16.50.52 yes
172.16.51.53 yes
172.16.50.55 yes
172.16.50.58 yes
172.16.51.65 yes
..................
十八、查看系统运行情况
#!/bin/bash
#用于查看系统运行情况

#功能选择菜单
menu(){


        echo -e "\033[31;32m                              查看系统运行情况                                 \033[0m"
        echo -e "\033[31;32m================================================================================\033[0m"
        echo -e "\033[34m请选择:\033[0m"
        echo -e "\033[33m1、查看系统负载   2、查看CPU消耗%   3、查看内存消耗%   4、查看SWAP消耗%   \033[0m"
        echo -e "\033[33m5、查看磁盘消耗%   6、查看inode消耗%   7、查看磁盘IO   8、查看网络流量   \033[0m"
        echo -e "\033[33m9、一键查看所有情况   10、退出脚本   \033[0m"
        echo -e "\033[31;32m================================================================================\033[0m"
        echo
        read -p "请输入数字:1-8[单独查看],9[一键查看],10[退出脚本]: " num
}

#(1)查看系统负载
load_average(){


    cpu_core=`grep 'model name' /proc/cpuinfo | wc -l`
    echo -e "\033[36mCPU核数: $cpu_core\033[0m"

    load=`uptime |awk -F ',' '{print $3 $4 $5}' |sed 's/^ *//'`
    echo -e "\033[36m$load\033[0m"
    echo ""
}

#(2)查看CPU消耗%
cpu_use_percent(){


    cpu_idle=`vmstat |awk '{print $15}' |sed '1,2d'`
    cpu_use=$[100-$cpu_idle]
    echo -e "\033[36mCPU使用率%: $cpu_use\033[0m"
    echo ""
}

#(3)查看内存消耗%
mem_use_percent(){


    mem_used=`free -m |grep Mem |awk '{print $3}'`
    mem_tol=`free -m |grep Mem |awk '{print $2}'`
    mem_use=`awk 'BEGIN{print '$mem_used'/'$mem_tol'*100}'`
    echo -e "\033[36m内存已使用"$mem_used"M,总内存"$mem_tol"M,内存使用率%: $mem_use\033[0m"
    echo ""
}

#(4)查看SWAP消耗%
swap_use_percent(){


    swap_used=`free -m |grep Swap |awk '{print $3}'`
    swap_tol=`free -m |grep Swap |awk '{print $2}'`
    swap_use=`awk 'BEGIN{print '$swap_used'/'$swap_tol'*100}'`
    echo -e "\033[36mSwap已使用"$swap_used"M,总Swap"$swap_tol"M,Swap使用率%: $swap_use\033[0m"
    echo ""
}

#(5)查看磁盘消耗%
disk_use_percent(){


    disk_use=`df -h |sed '1d'`
    echo -e "\033[36m磁盘使用情况: \n$disk_use\033[0m"
    echo ""
}

#(6)查看inode消耗%
inode_use_percent(){


    inode_use=`df -i |sed '1d'`
    echo -e "\033[36minode使用情况: \n$inode_use\033[0m"
    echo ""
}

#(7)查看磁盘IO
disk_io(){


    disk_io_bi=`vmstat |awk '{print $9}' |sed '1,2d'`
    echo -e "\033[36m发送到块设备的块数: "$disk_io_bi"块每秒\033[0m"

    disk_io_bo=`vmstat |awk '{print $10}' |sed '1,2d'`
    echo -e "\033[36m从块设备接收到的块数: "$disk_io_bo"块每秒\033[0m"
    echo ""
}

#(8)查看网络流量
network_flow(){


    #安装所需命令sysstat
    if  ! rpm -q sysstat > /dev/null
    then
        yum install -y sysstat &>/dev/null
        if [ $? -ne 0 ]
        then
            echo -e "\033[31msysstat 安装失败\033[0m"
            exit 1
        fi
    fi
    explain=`sar -n DEV |sed -n '3p'`
    echo -e "\033[35m网络流量使用情况: \n$explain\033[0m"

    network_ifs=`ifconfig |grep "<UP,BROADCAST,RUNNING,MULTICAST>" |awk -F ':' '{print $1}'`
    network_flow=`sar -n DEV |grep -v Average |grep $network_ifs |tail`
    echo -e "\033[36m$network_flow\033[0m"
}

#脚本运行入口
run(){


        while true;do
        menu

        case $num in
        "1")
                #1、查看系统负载
                    load_average
                    ;;
        "2")
                #2、查看CPU消耗%
                    cpu_use_percent
                    ;;
        "3")
                #3、查看内存消耗%
                    mem_use_percent
                    ;;
        "4")    #4、查看SWAP消耗%
                    swap_use_percent
                    ;;
        "5")    #5、查看磁盘消耗%
                    disk_use_percent
                    ;;
        "6")    #6、查看inode消耗%
                    inode_use_percent
                    ;;
        "7")    #7、查看磁盘IO
                    disk_io
                    ;;
        "8")    #8、查看网络流量
                    network_flow
                    ;;
        "9")    #9、一键查看所有情况
                    load_average
                    cpu_use_percent
                    mem_use_percent
                    swap_use_percent
                    disk_use_percent
                    inode_use_percent
                    disk_io
                    network_flow
                    exit 0
                    ;;
        "10")   #10、退出脚本
                    exit 0
                    ;;
          *)
                    ;;
        esac
        done
}

#调用脚本运行入口
run
十九、管理docker
具体要求如下:
1)脚本支持启动全部容器、关闭全部容器、删除全部容器;
2)需要提示用户如何使用该脚本,需给出范例。
#!/bin/bash
#用于管理docker容器

while ture
do
    read -p "请输入你要执行的操作:(stop/start/rm)" opt

    if [ -z "$opt" ]
    then
        echo "请输入你的操作"
        continue
    else
        break
    fi
done

docker ps -a |awk '{print $1}' > /tmp/id.txt

case $opt in
  stop)
    for id in `cat /tmp/id.txt`
    do
        docker stop $id
    done
    ;;
  start)
    for id in `cat /tmp/id.txt`
    do
        docker start $id
    done
    ;;
  rm)
    for id in `cat /tmp/id.txt`
    do
        read -p "将要删除容器$id,是否继续?(y|n)" c
        case $c in
          y|Y)
            docker rm -f $id
            ;;
          n|N)
            echo "容器$id不会被删除"
            ;;
          *)
            echo "你只能输入 y/Y或者n/N"
            ;;
        esac
    done
  *)
    echo "你只能输入 start/stop/rm"
    ;;
  esac
二十、shell多线程备份数据库
本案例就是实现shell多线程备份数据库,具体要求如下:
1)公司的业务量比较大,有100个数据库需要全量备份,而每个数据库的数据量高达几十GB
(注意:每一个库都为一个独立的实例,即有着独立的ip:port);
2)预估每一个库的备份时间为30分钟左右,要求在5个小时内完成;
3)假设100个库的库名、host、port以及配置文件路径都存到一个文件里,文件名字为 /tmp/databases.list ;
4)格式为:db1 10.10.10.2 3308 /data/mysql/db1/my.cnf 。
#!/bin/bash
#多线程备份数据库
#备份数据库使用xtrabackup(由于涉及到myisam,命令为innobackupex)

exec &> /tmp/mysql_bak.log

if ! which inoobackupex &>/dev/null
then
    echo "安装xtrabackup工具"
    yum install https://repo.percona.com/yum/percona-release-latest.noarch.rpm
    yum install percona-xtrabackup-24

    if [ $? -ne 0 ]
    then
        echo -e "\033[31m安装xtrabackup工具出错,请检查\033[0m"
        exit 1
    fi
fi

bakdir=/data/backup/mysql
bakuser=vyNctM
bakpass=99omeaBHh

bak_data()
{


    db_name=$1
    db_host=$2
    db_port=$3
    cnf=$4

    [ -d $bakdir/$db_name ] || mkdir -p $bakdir/$db_name
    innobackupex --defaults-file=$4 --host=$2 --port=$3 --user=$bakuser --password=$bakpass --databases=$1 $bakdir

    if [ $? -ne 0 ]
    then
        echo -e "\033[31m备份数据库$1出现问题\033[0m"
    fi
}

fifofile=/tmp/$$
mkfifo $fifofile
exec 1000<>$fifofile

n=10
for ((i=0;i<$n;i++))
do
    echo >&1000         # 0-9,创建10个线程
done

cat /tmp/databases.list |while read line
do
    read -u1000
    {


        bak_data `echo $line`
        echo >&1000
    } &
done

wait
exec 1000>&-        #删除fd1000
rm -f $fifofile     #删除命名管道
脚本中,
- exec &> /tmp/mysql_bak.log ,将正确输出和错误输出都重定向到 /tmp/mysql_bak.log
- $$表示本进程PID,mkfifo命令创建命名管道
- read line ,line为变量名,将接下来的输入赋值给line