文章目录
6∶监控一台服务器主机
6.1 监控zabbix-server
yum install zabbix-agent -y
systemctl start zabbix-agent.service
systemctl enable zabbix-agent.service
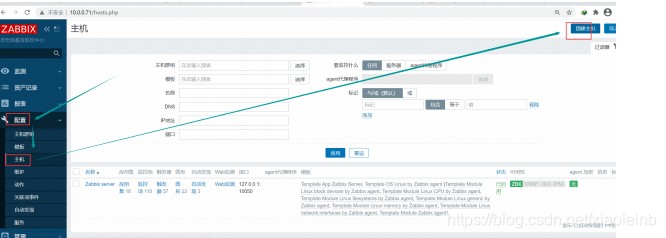
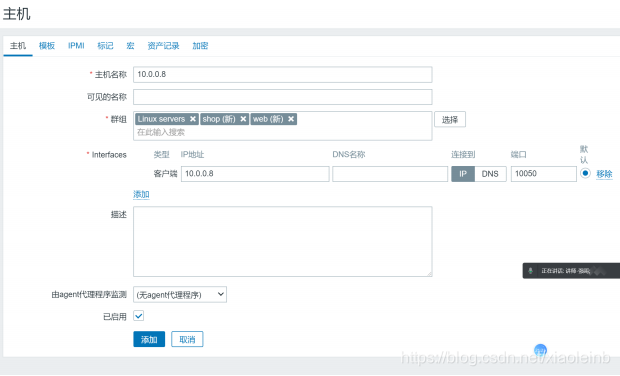
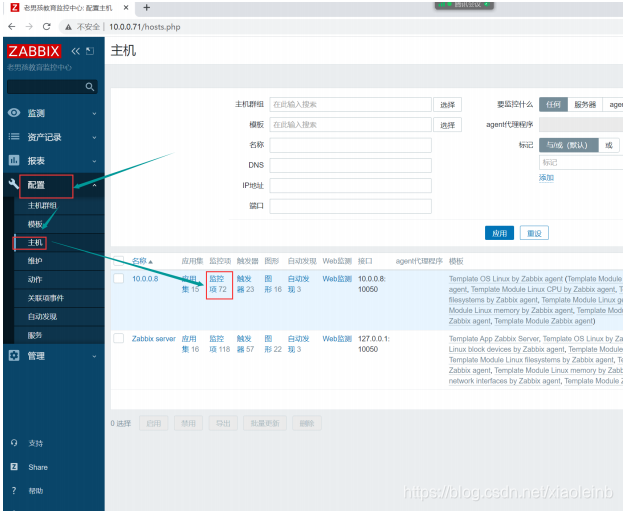
6.2 监控其他linux主机
添加监控前准备
#安装
rpm -ivhhttps://mirrors.tuna.tsinghua.edu.cn/zabbix/zabbix/5.0/rhel/7/x86_64/zabbix-agent2-5.0.8-1.el7.x86_64.rpm
#配置
vim /etc/zabbix/zabbix_agent2.conf
Server=10.0.0.71
#启动
systemctl start zabbix-agent2.service
systemctl enable zabbix-agent2.service
7∶自定义监控项
7.1:什么是监控项
监控项:就是我们想要监控的指标,例如剩余内存,磁盘空间,服务的状
态等等
每一个监控项,都有一个唯一的key,简洁明了(相当于shell脚本的变量名)
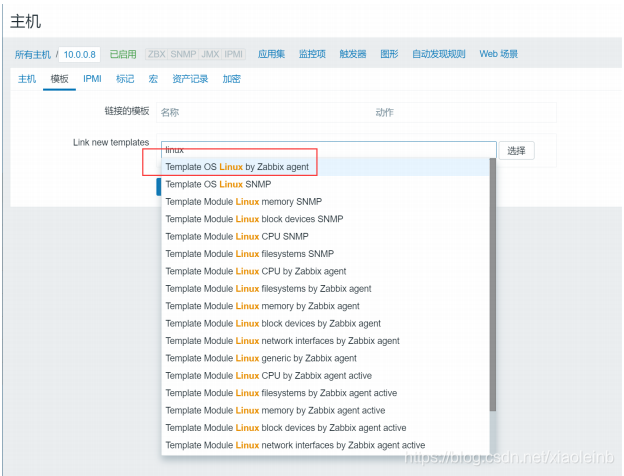
只需要安装zabbix-agent,默认就支持大量的监控项,但是linux模板并没
有使用所有监控项
Template OS Linux by Zabbix agent主要监控了cpu,内存,磁盘,网卡,
安全,它们都属于通用监控
应用集是监控项的分组
7.2 使用内置key监控nginx的状态

#只在zabbix-server上安装
yum install zabbix-get -y
zabbix_get -s 127.0.0.1 -k proc.num[nginx]
#注释
-s 被监控主机的ip地址
-p 端口
-k 指定监控项的key
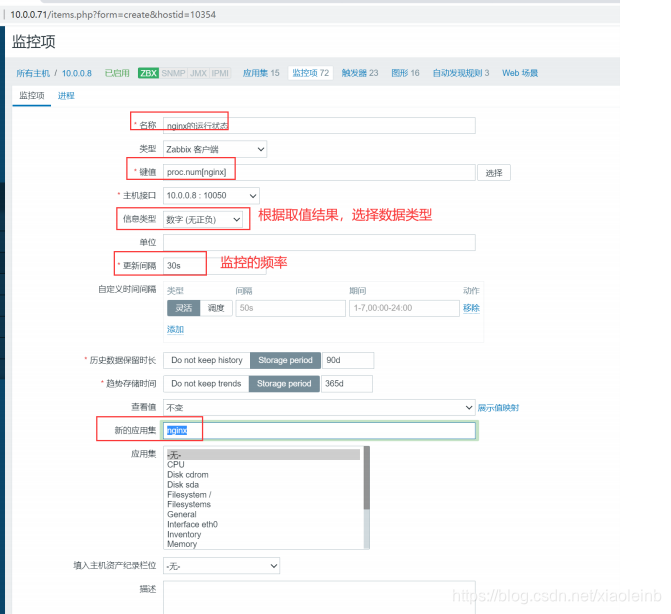
7.3 使用自定义的监控项来监控nginx
修改agent配置文件
#zabbix-agent
vim /etc/zabbix/zabbix_agentd.conf
#zabbix-agent2
vim /etc/zabbix/zabbix_agent2.conf
#增加一行
UserParameter=nginx_status,netstat -lntp|grep -c nginx
重启agent生效
1 systemctl restart zabbix-agent2.service
使用zabbix-get测试取值
#只能在zabbix-server上执行
zabbix_get -s 10.0.0.8 -k nginx_status
注意 zabbix-agent 取值的时候权限不足解决方法:
1:使用sudo来执行
2:使用suid来执行
3:使用root用户来运行zabbix-agent
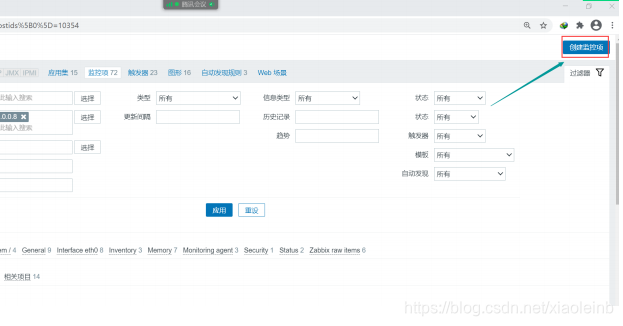
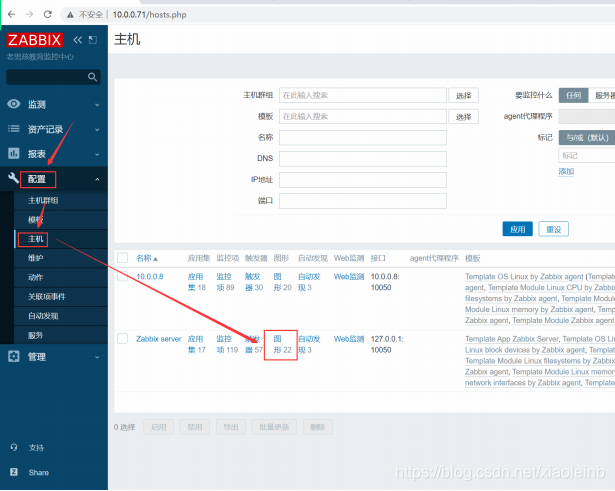
web界面添加监控项过程,同上
7.4 自定义带参数的监控项
建议把agent自定义监控项独立成一个配置文件
vim /etc/zabbix/zabbix_agent2.d/zbx_nginx.conf
UserParameter=nginx_status,netstat -lntp|grep -c nginx
好处:可以复用,管理更方便
对应有规律的监控项:
UserParameter=mysql_Uptime,echo 'show status;'|mysql -uroot|grep -w 'Uptime'|awk '{print $2}'
UserParameter=mysql_Com_select,echo 'show status;'|mysql -uroot|grep -w 'Com_select'|awk '{print$2}'
UserParameter=mysql_Com_delete,echo 'showstatus;'|mysql -uroot|grep -w 'Com_delete'|awk '{print $2}'
适合使用带参考的自定义监控项
UserParameter=mysql_define[*],echo 'show status;'|mysql -uroot|grep -w "$1"|awk '{print $$2}'
取值效果
[root@zabbix-server ~]# zabbix_get -s 10.0.0.8 -k mysql_define[Uptime]
827
[root@zabbix-server ~]# zabbix_get -s 10.0.0.8 -k mysql_define[Com_select]
1
[root@zabbix-server ~]# zabbix_get -s 10.0.0.8 -k mysql_define[Com_insert]
0
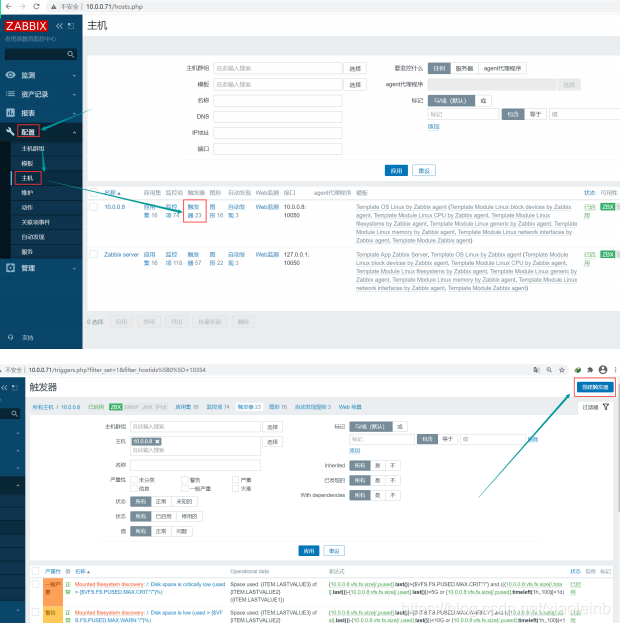
8∶自定义触发器
触发器:设置一个报警条件
一个触发器至少对应一个监控项
触发器表达式的格式
例子1:
{

    10.0.0.8:vfs.file.cksum[/etc/passwd].diff()}>0
主机:10.0.0.8
key值:vfs.file.cksum[/etc/passwd]
函数方法:diff() 对比两次监控项的值
例子2:
{
10.0.0.8:proc.num.last()}/{
10.0.0.8:kernel.maxproc.las
t()}*100>80
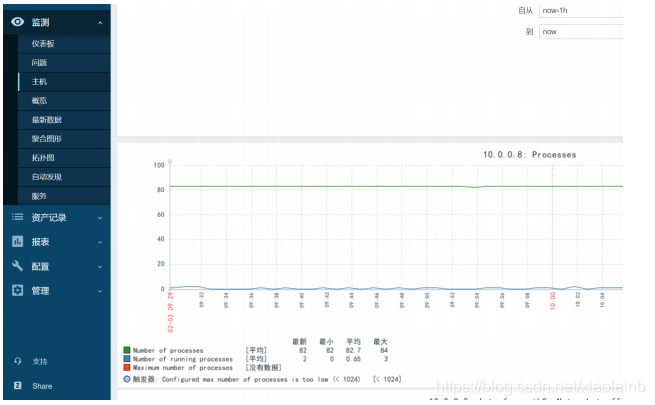
10.0.0.8:proc.num:当前运行进程
10.0.0.8:kernel.maxproc 系统最大允许进程的数量
函数方法:last() 最新值
例子3:
{

    10.0.0.8:vm.memory.size[available].min(5m)}<{

    $MEMORY.AVAILABLE.MIN} and
{

    10.0.0.8:vm.memory.size[total].last()}>0
函数方法 mim(5m),max(5m),avg(5m)
{

    $MEMORY.AVAILABLE.MIN}=20m
and 同时
10.0.0.8:vm.memory.size[total] 最新的总内存大小
自定义触发器表达
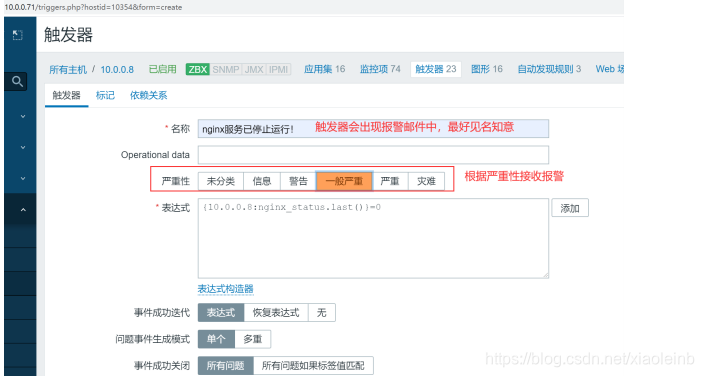
单条件
1 {

    10.0.0.8:nginx_status.last()}=0
多条件
{10.0.0.8:disk_free.last()}<100M and
{10.0.0.8:disk_free_per.last()}< 3
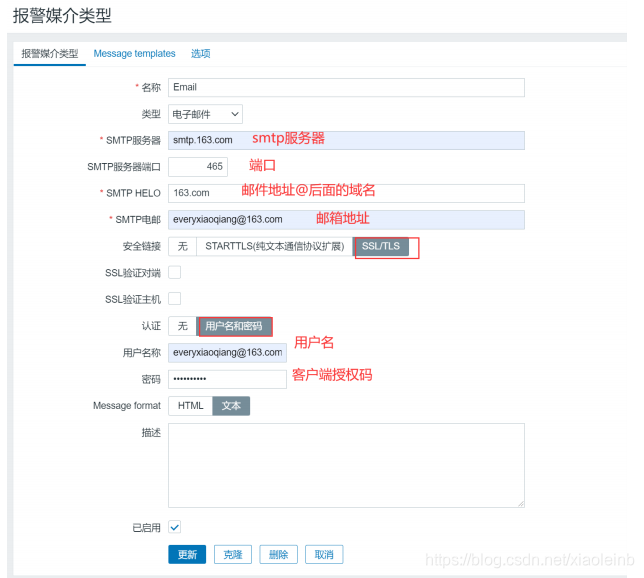
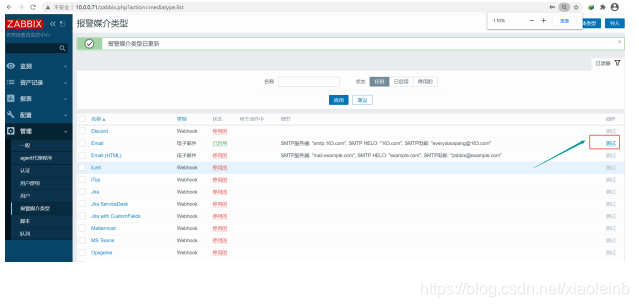
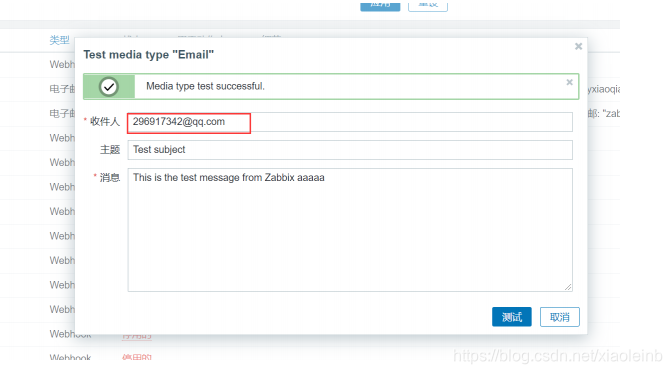
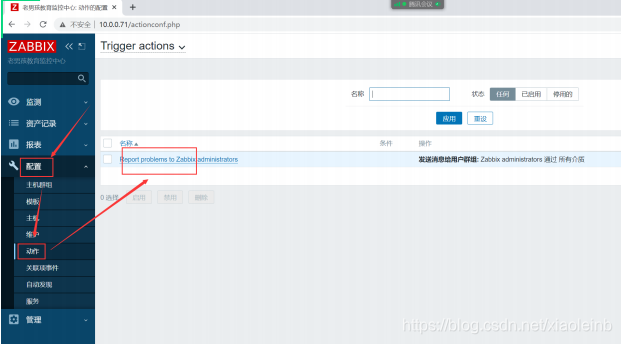
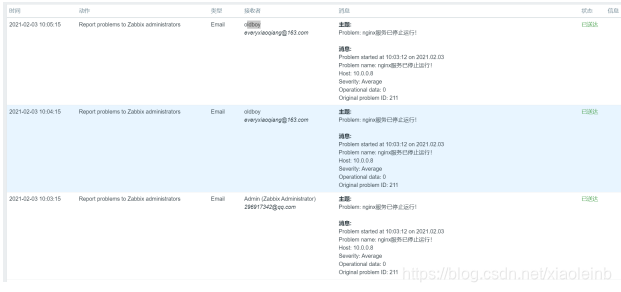
9:自定义报警
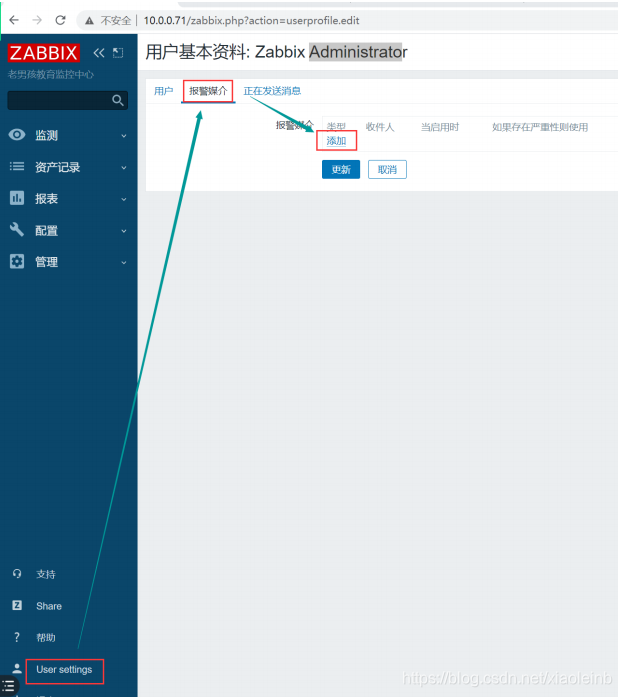
9.1 邮件报警
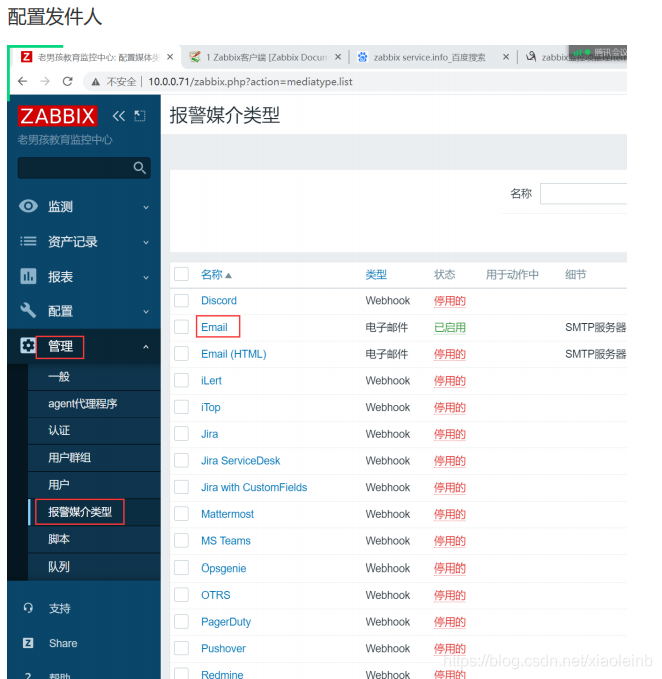
配置收件人

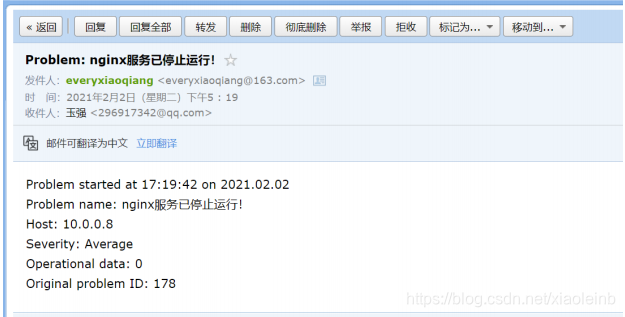
systemctl stop nginx.service
效果
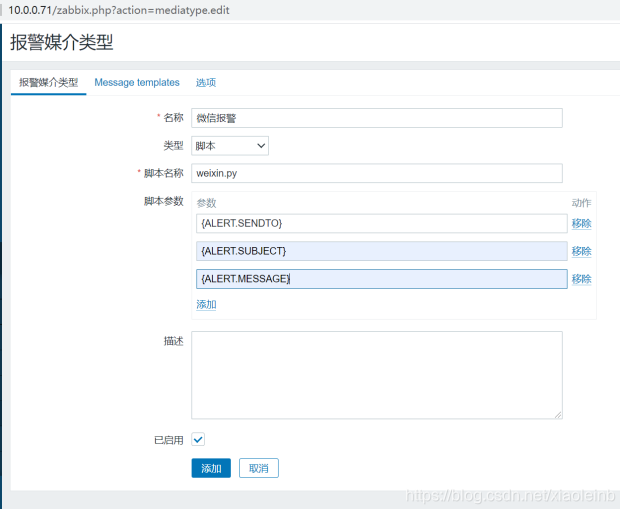
9.2 微信报警(自定义脚本报警)
准备好企业微信号
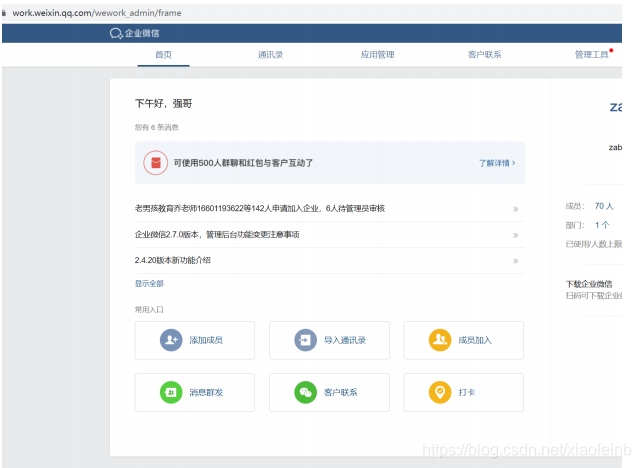
加入企业微信

使用微信关联企业微信

测试微信报警脚本
#修改脚本
corpid='wxd074861951c67ba6'
appsecret='QtraZrI936DZ0jZ3aSWTZlFVheAMgLmq3toM4B9U1A'
agentid=1
#安装python模板
yum install python-pip -y
pip install requests -i
https://pypi.tuna.tsinghua.edu.cn/simple
#测试发送微信消息
python weixin.py 'BuYuanTouLuXingShiDeCuiXianSheng'
'天气真好' '阳光明媚,春暖花开!'
#第一个参数,企业微信的用户
#第二个参数,报警标题
#第三个参数,报警内容
将脚本放在指定的位置
#查看报警脚本路径
grep -Ev '^$|#' /etc/zabbix/zabbix_server.conf
AlertScriptsPath=/usr/lib/zabbix/alertscripts
mv weixin.py /usr/lib/zabbix/alertscripts/
chmod +x /usr/lib/zabbix/alertscripts/weixin.py
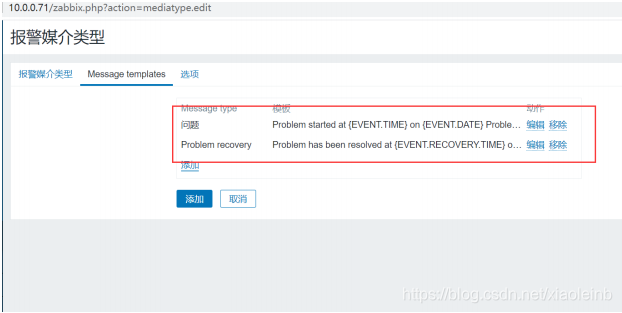
配置发件人
{

    ALERT.SENDTO}
{

    ALERT.SUBJECT}
{

    ALERT.MESSAGE}
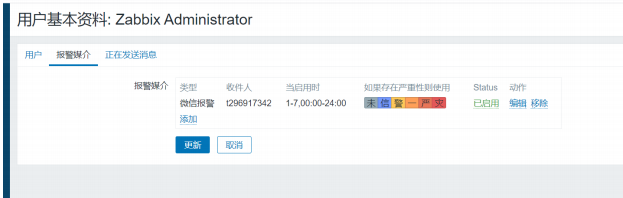
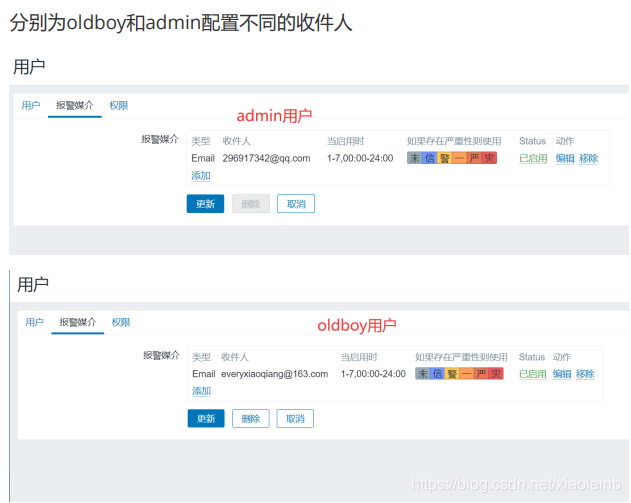
配置收件人
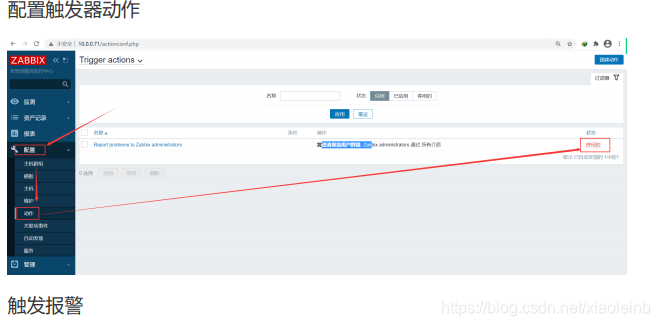
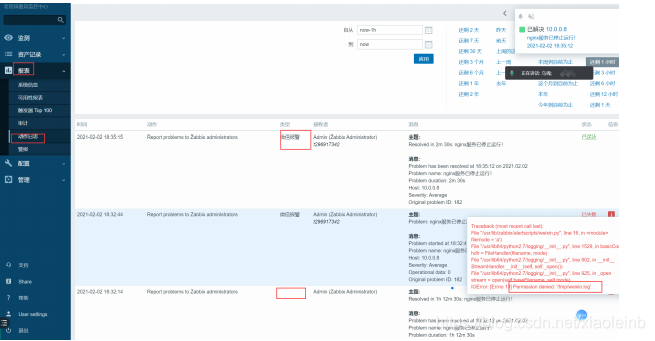
重新触发报警
1 systemctl stop nginx.service
注意权限问题
9.3 报警升级
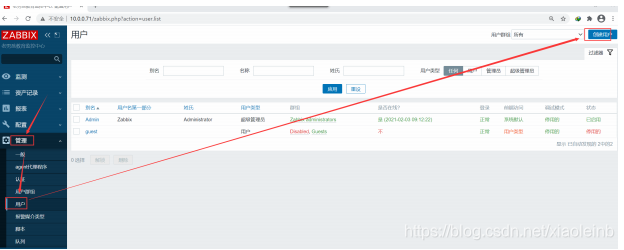
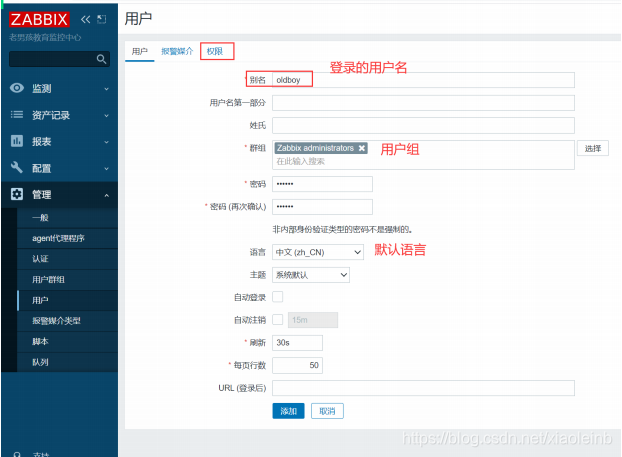
增加一个用户
报警升级设置
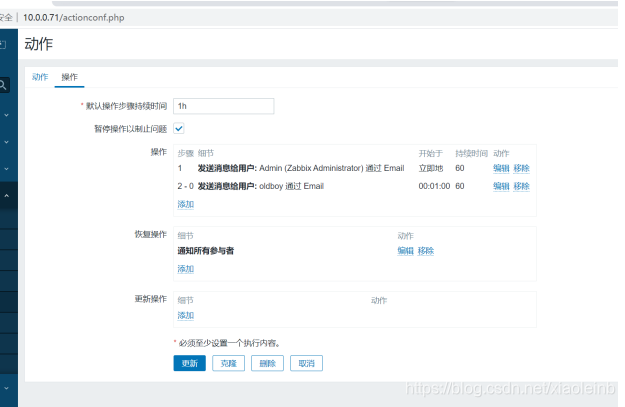
效果
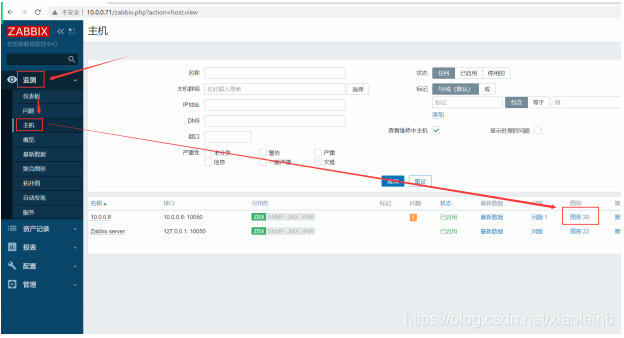
10:自定义图形和grafana出图

解决中文乱码
cd /html/
cd assets/fonts/
#上传中文字体
rz -E
[root@zabbix-server fonts]# ls
DejaVuSans.ttf SIMHEI.TTF
mv SIMHEI.TTF DejaVuSans.ttf
自定义图形

使用grafana给zabbix出图
安装grafana
wget https://mirrors.tuna.tsinghua.edu.cn/grafana/yum/rpm/grafana-7.3.7-1.x86_64.rpm
yum localinstall grafana-7.3.7-1.x86_64.rpm -y
systemctl start grafana-server.service
systemctl enable grafana-server.service
#访问grafana
http://10.0.0.8:3000
默认账号密码:admin/admin
grafana的概念
a:插件,丰富原有功能plugin
b:数据源 datasource
c:dashboard 效果图
安装zabbix插件
grafana-cli plugins install alexanderzobnin-zabbix-app4.1.2
service grafana-server restart
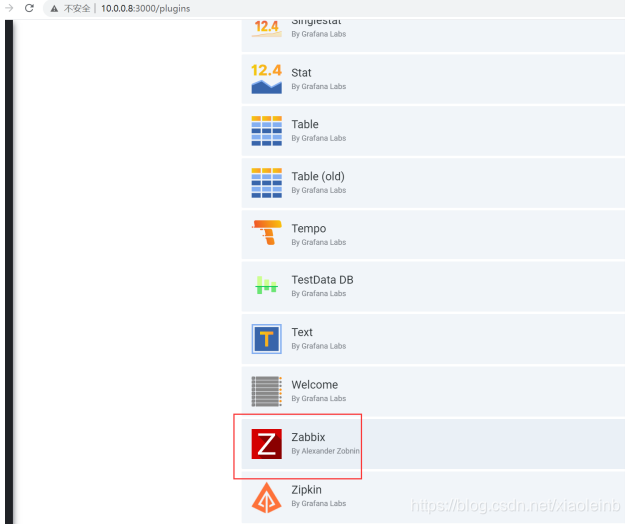
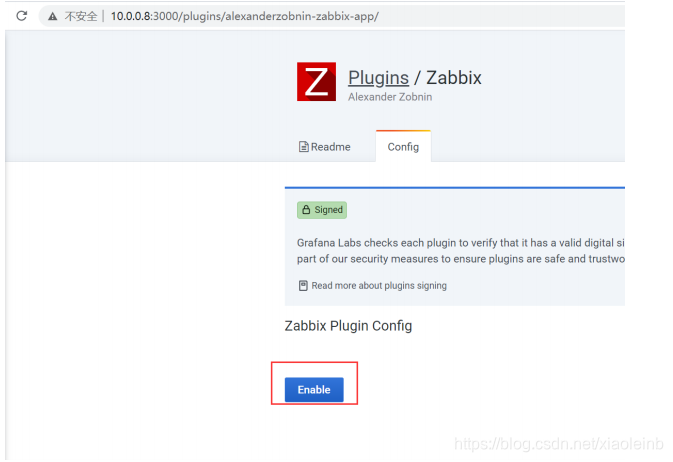
启用zabbix插件
新建zabbix数据源
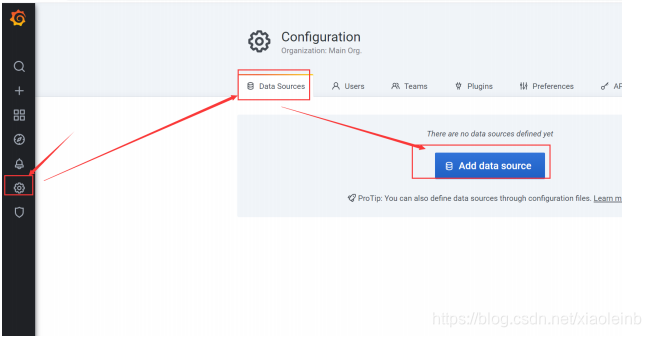
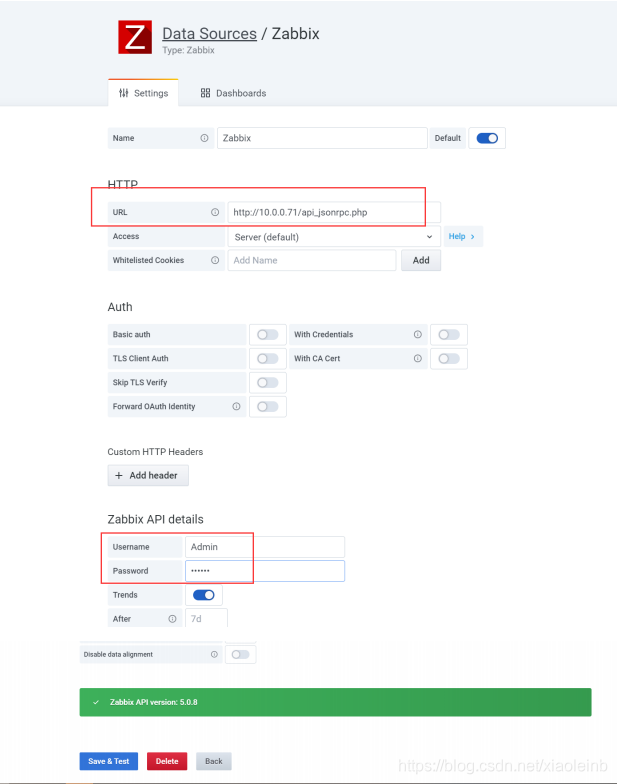
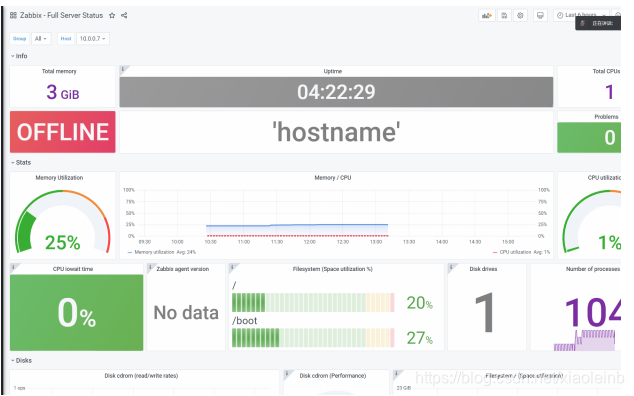
效果
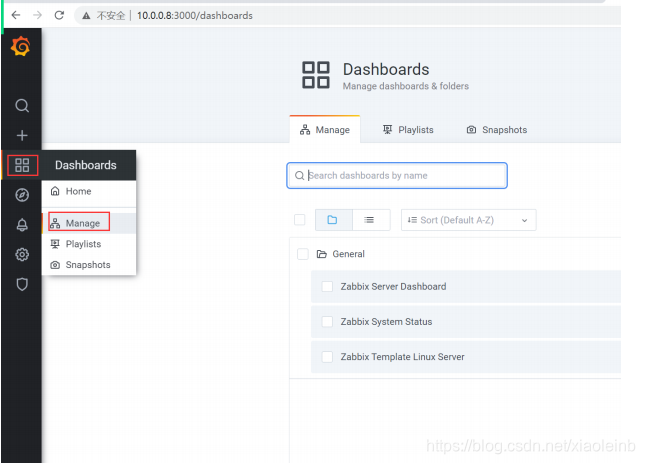
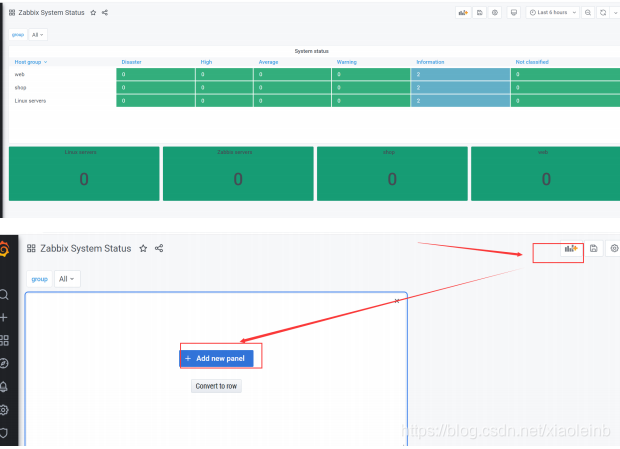
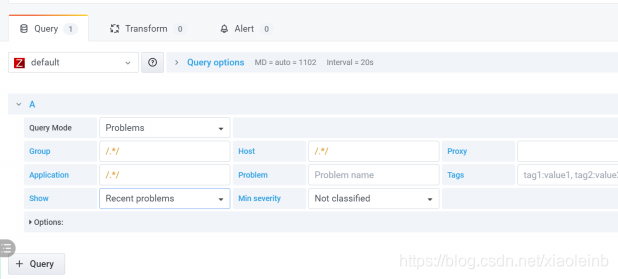
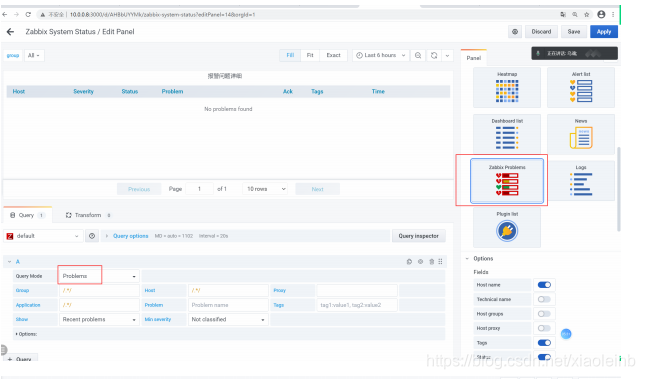
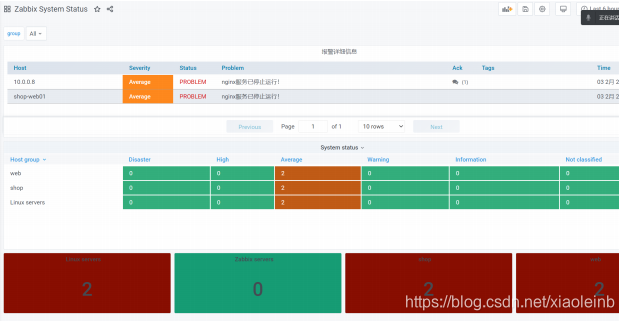
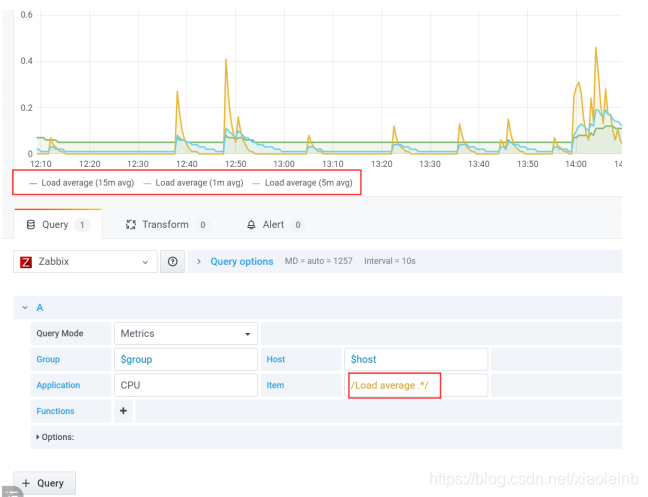
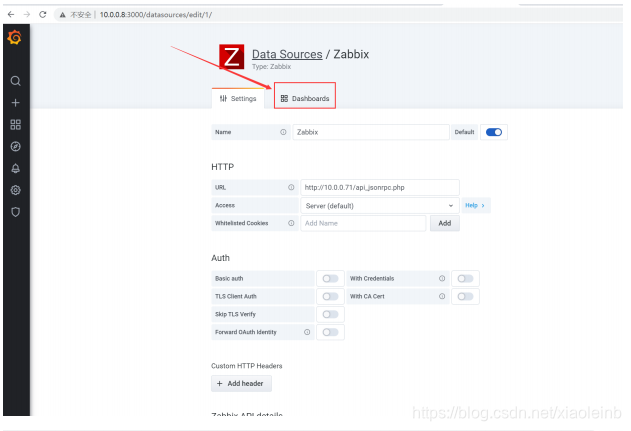
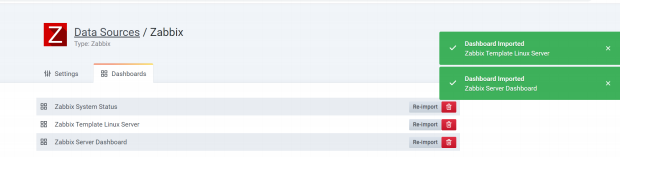
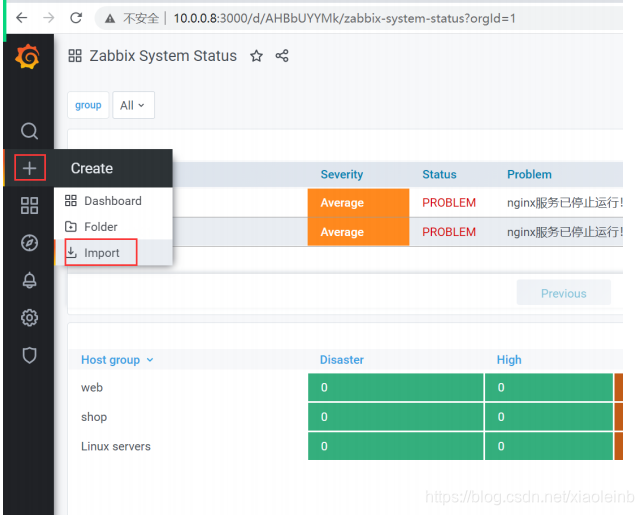
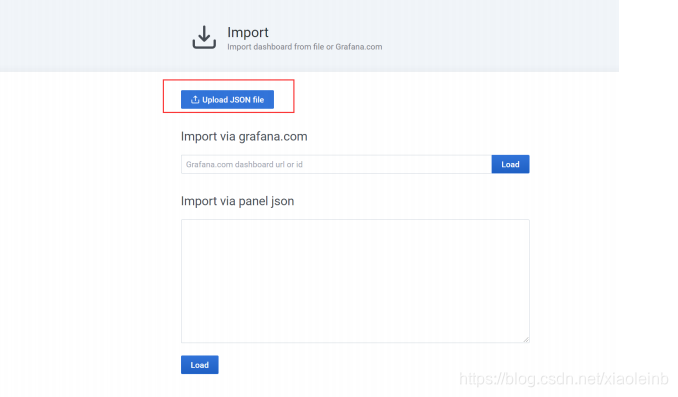
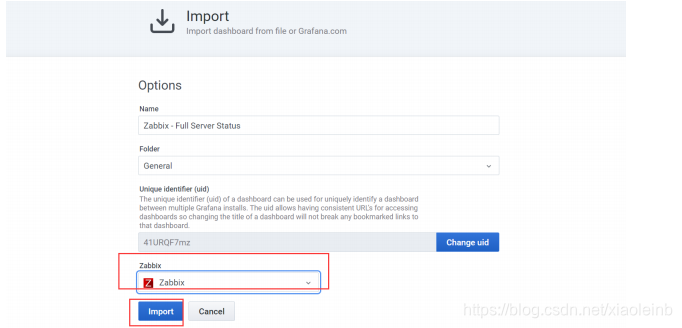
导入dashboard
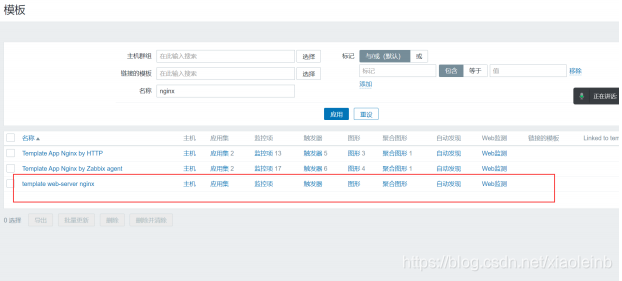
11∶自定义监控模板
模板:定义好了,一些监控项,应用集,触发器,图形等资源
模板可以包含子模板
模板,可以导入导出,可以分享
自定义模板
#开启nginx监控页面
location = /nginx_status {
stub_status;
access_log off;
}
#测试
[root@web01 ~]# curl http://127.0.0.1/nginx_status
Active connections: 1
server accepts handled requests
7 7 7
Reading: 0 Writing: 1 Waiting: 0
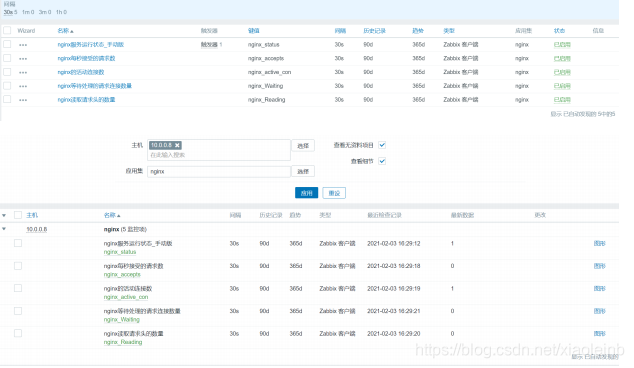
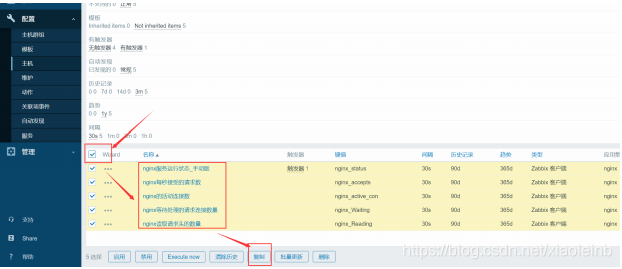
#自定义监控项
[root@web01 zabbix_agent2.d]# cat zbx_nginx.conf
UserParameter=nginx_status,netstat -lntp|grep -c nginx
UserParameter=nginx_accepts,curl http://127.0.0.1/nginx_status 2>/dev/null|awk
'NR==3{print $1}'
UserParameter=nginx_active_con,curl http://127.0.0.1/nginx_status 2>/dev/null|awk
'NR==1{print $NF}'
UserParameter=nginx_Reading,curl http://127.0.0.1/nginx_status 2>/dev/null|awk
'NR==4{print $2}'
UserParameter=nginx_Writing,curl http://127.0.0.1/nginx_status 2>/dev/null|awk
'NR==4{print $4}'
UserParameter=nginx_Waiting,curl http://127.0.0.1/nginx_status 2>/dev/null|awk
'NR==4{print $NF}'
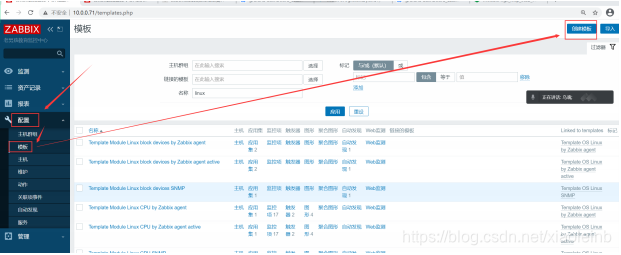
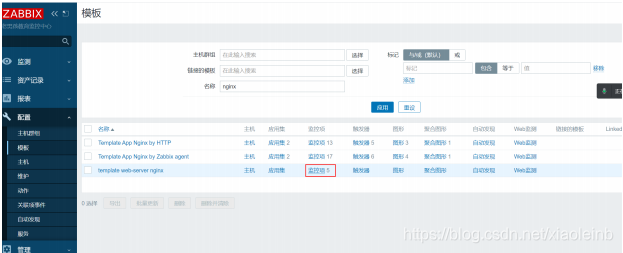
制作模板

添加监控项
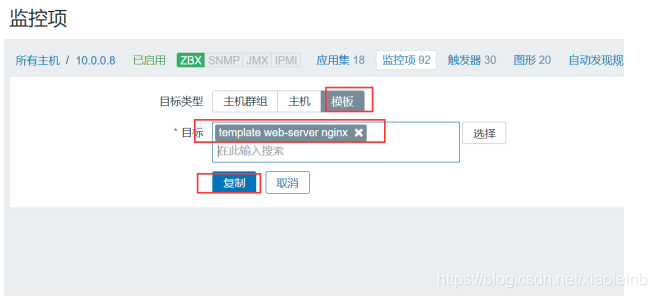
同样的方法,复制触发器,复制图形等资源
使用模板注意事项:
#开启监控页面
#导入模板(兼容性)
#把zabbix的取值配置文件,放入到指定目
录/etc/zabbix/zabbix_agentd.d/
#如果有取值脚本,需要把取值也放在对应的目录
#zabbix-get调试取值
#在目标主机链接刚导入的模板
#验证,查看最新数据