Bottom-Up and Top-Down Attention for Image Captioning and Visual Question Answering-阅读总结
笔记不能简单的抄写文中的内容,得有自己的思考和理解。
一、基本信息
\1.标题:Bottom-Up and Top-Down Attention for Image Captioning and Visual Question Answering
\2.作者:Peter Anderson,Xiaodong He,Chris Buehler,Damien Teney,Mark Johnson,Stephen Gould,Lei Zhang
\3.作者单位:Australian National University,JD AI Research,Microsoft Research,University of Adelaide,Macquarie University,Australian National University,Microsoft Research
\4.发表期刊/会议:CVPR 2018 full oral(winner of the 2017 Visual Question Answering challenge)
\5.发表时间:2018
二、看本篇论文的目的
to study the new mechanism: Bottom-Up and Top-Down Attention, and to find the inspiration for my undergraduate thesis project.
三、场景和问题
scene: image caption,visual question answering (VQA)
problem: It's often necessary to perform some fine-grained visual processing, or even multiple steps of reasoning to generate high quality outputs.
四、研究目标
deeper image understanding through fine-grained analysis, enable attention to be calculated at the level of objects and other salient image regions.
五、主要思路/创新
Main inspiration:
\1.In the human visual system, attention can be focused volitionally by top-down signals determined by the current task (e.g., looking for something), and automatically by bottom-up signals associated with unexpected, novel or salient stimuli.
\2.Most attention mechanisms are typically trained to selectively attend to the output of one or more layers of a CNN. However, this approach gives little consideration to how the image regions that are subject to attention are determined.
Main innovation:
\1.a mechanism combined bottom-up and top-down visual attention:
the bottom-up attention (implemented by Faster R-CNN) proposes a set of salient image regions, with each region represented by a pooled convolutional feature vector.
the top-down mechanism uses task-specific context to predict an attention distribution over the image regions. The attended feature vector is then computed as a weighted average of image features over all regions.
六、算法概述
\1.Bottom-Up Attention Model
①.bottom-up attention implemented by Faster R-CNN:
a.Faster R-CNN detects objects in two stages:
First stage, Region Proposal Network (RPN) predicts object proposals. A small network is slid overfeatures at an intermediate level of a CNN. At each spatial location the network predicts a class-agnostic objectness score and a bounding box refinement for anchor boxes of multiple scales and aspect ratios. Using greedy non-maximum suppression with an intersection-over-union (IoU) threshold, the top box proposals are selected as input to the second stage.
Second stage, region of interest (RoI) pooling is used to extract a small feature map (e.g. 14×14) for each box proposal. These feature maps are then batched together as input to the final layers of the CNN. The final output of the model consists of a softmax distribution over class labels and class-specific bounding box reginements for each box proposal.
b.Faster R-CNN effectively functions as a "hard" attention mechanism, as only a relatively small number of image bounding box features are selected from a large number of possible configurations.
To generate the image features V, a possibly variably-sized set of \(k\) image features \(V={\{v_1,\dots,v_k\}},v_i\in\mathbb{R}^D\), each object class ( the final output of the model) is non-maximum suppressed by an IoU threshold. Then all the regions where any class detection probability exceeds a confidence threshold are selected as \(i,v_i\) and defined as the mean-pooled convolutional feature from this region, such that the dimension \(D\) of the image feature vectors is 2048.
c.learning process of the bottom-up attention model: Faster R-CNN is initialized by ResNet-101 pretrained for classification on ImageNet. Then it is trained on Visual Genome data. An additional training output is added for predicting attribute classes. A softmax distribution overeach attribute class plus a 'no attributes' class is defined in the additional output layer. The mean pooled convolutional feature \(v_i\) and a learned embedding of the ground-truth object class are concatenated and fed into the output layer to predict attributes for region \(i\).
In addition to the four original Faster R-CNN loss function components, defined over the classification and bounding box regression outputs for both the RPN and the final object class proposals respectively, they add an additional multi-class loss component to train the attribute predictor.
\2.Captioning Model:
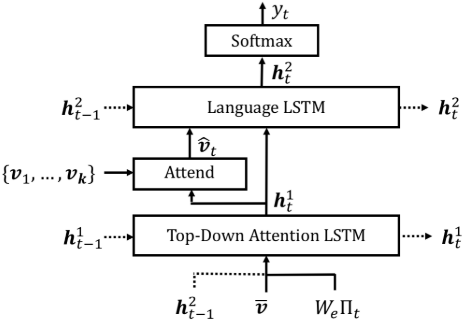
①.top-down visual attention LSTM:
a. The input vector to the attention LSTM at each time step consists of the previous output of the language LSTM, concatenated with the mean-pooled image feature \(\bar{v}=\frac{1}{k}\sum_iv_i\) and an encoding of the previously generated word, given by: \(x^1_t=[h^2_{t-1},\bar{v},W_e\Pi_t]\), \(W_e\in\mathbb{R^{E\times\vert\sum\vert}}\) is a word embedding matrix for a vocabulary \(\sum\), and \(\Pi_t\) is one-hot encoding of the input word at timestep \(t\). The word embedding is learned from random initialization without pretraining.
At each time step \(t\), given the output \(h_t^1\) of the attention LSTM, it generate a normalized attention weight \(\alpha_{i,t}\) for each of the \(k\) image features \(v_i\) as follows:
\(W_{va}\in\mathbb{R}^{H\times V},W_{ha}\in\mathbb{R}^{H\times M}\) and \(w_a\in\mathbb{R}^H\) are learned parameters. The attended image feature used as input to the language LSTM is calculated as a convex combination of all input features:
②.Language LSTM:
Input: the attended image feature concatenated with the output of the attention LSTM: \(x_t^2=[\hat{v}_t,h_t^1]\).
\(y_{1:T}\) refer to a sequence of words (\(y_1,\dots,y_T\)), at each time step \(t\) the conditional distribution over possible output words is given by: \(p(y_t|y_{1:t-1})=softmax(W_ph_t^2+b_p)\), \(W_p\in\mathbb{R}^{|∑|\times M}\) and \(b_p \in \mathbb{R}^{|\sum|}\) are learned weights and biases.
The distribution over complete output sequences is calculated as the product of conditional distribution: \(p(y_{1:T})=\prod\limits^T_{t=1}p(y_t|y_{1:t-1})\)
③.Objective:
Loss: \(y^*_{1:T}\) a target ground truth sequence, \(\theta\) parameters of a captioning model, minimize the cross entropy loss: \(L_{XE}(\theta)=-\sum\limits^T_{t=1}log(p_{\theta}(y^*_t|y^*_{1:t-1}))\).
Comparison with other work, initialized from the cross-entropy trained model and seek to minimize the negative expected score: \(L_R(\theta)=-\mathbf{E}_{y_{1:T}\sim p_{\theta}}[r(y_{1:T})]\), \(r\) is the score function (e.g., CIDEr).
Self-Critical Sequence Training (SCST), the gradient of the loss can be approximated: \(\bigtriangledown_{\theta}L_R(\theta)\approx -(r(y^s_{1:T})-r(\hat{y}_{1:T}))\bigtriangledown_{\theta}logp_{\theta}(y^s_{1:T})\), \(y^s_{1:T}\) is a sampled caption, \(r(\hat{y}_{1:T})\) defines the baseline score obtained by greedily decoding the current model. SCST explores the space of captions by sampling from the policy during training. This gradient tends to increase the probability of sampled captions that score higher than the score from the current model.
CIDEr optimization (completed in a single spoch): It follows SCST and speed up the training process by restricting the sampling distribution. Using beam search decoding: sample only from the captions in the decoded beam.
\3.VQA Model:
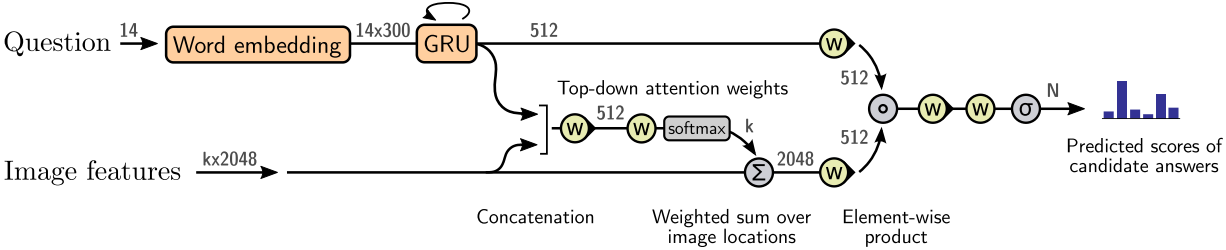
①.Given a set of spatial image features V, VQA model uses a 'soft' top-down attention mechanism to weight each feature, using the question representation as context and followed by a prediction of regression of scores over a set of candidate answers.
②.The learned non-linear transformations within the network are implemented with gated hyperbolic tangent activations and it shows a strong empirical advantage over traditional ReLU or tanh layers. Each 'gated tanh' layers implements function \(f_a:x\in\mathbb{R}^m\rightarrow y\in\mathbb{R}^n\) with parameters \(a=\{W,W',b,b'\}\) defined as follows:
\(\sigma\) is the sigmoid activation function, \(W,W'\in \mathbb{R}^{n\times m}\) are learned weights, \(b,b'\in \mathbb{R}^n\) are learned biases, \(\circ\) is the Hadamard (element-wise) product. \(g\) acts multiplicatively as a gate on the intermediate activation \(\tilde{y}\).
③.This approach first encodes each question as the hidden state \(q\) of a gated recurrent unit (GRU), with each input word represented using a learned word embedding. Given the output \(q\) of the GRU, it generates an unnormalized attention weight \(a_i\) for each of the \(k\) image features \(v_i\) as: \(a_i=w_a^Tf_a([v_i,q])\), \(w_a^T\) is a learned parameter vector. the normalized attention weight and the attended image feature \(\hat{v}\) are calculated by Equations in \2.①.
④.The distribution over possible output reponses \(y\) is given by:
\(h\) is a joint representation of the question and the image, \(W_o\in \mathbb{R}^{|\sum|\times M}\) are learned weights.
七、采用的数据集&评价指标
Datasets:
①.Visual Genome Dataset (contains 108K images densely annotated with scene graphs containing objects, attributes and relationships, as well as 1.7M visual question answers): used to pretrain the bottom-up attention model, and for data augmentation when training VQA model.
②.Pretraining the bottom-up attention model: using only the object and attribute data, reserving 5K images for validation and 5K images for future testing, the remaining 98K images as training data. As approximately 51K Visual Genome images are also found in the MSCOCO captions dataset, it must avoid contamination of the MSCOCO validation and test sets. The images in both datasets are contained in the same split in both datasets.
③.Extensive cleaning and filtering of the training data (as the object and attribute annotations consist of freely annotated strings, rather than classes): the final training set contains 1600 object classes and 400 attribute classes, removing the abstract classes that exhibit poor detection performance in initial experiments. No merging or removing overlapping classes (e.g. 'person', 'man','guy'), classes with both singular and plural versions (e.g. 'tree', 'trees') and classes that are difficult to precisely localize (e.g. 'sky', 'grass', 'buildings').
④.MS COCO 2014 Dataset: 'Karpathy' splits is used for validation of model hyperparameters and offline testing --- 113,287 training images with five captions each, 5K images respectively for validation and testing. Performing only minimal text pre-processing: converting all sentences to lower case, tokenizing on white space, and filtering words that do not occur at least five times, getting a model vocabulary of 10,010 words.
⑤.Standard automatic evaluation matrics: SPICE, CIDEr, METEOR, ROUGE-L and BLEU.
⑥.VQA v2.0 Dataset: used to evaluate the VQA model, minize the effectiveness of learning dataset priors by balancing the answers to each question, contains 1.1M questions with 11.1M answers relating to MSCOCO images.
Standard question text preprocessing and tokenization: questions are trimmed to a maximum of 14 words for computational efficiency, the set of candidate answers if restricted to correct answers in the training set that appear more than 8 times and output a vocabulary size of 3,129, using the standard VQA metric to evaluate answer quality, which takes into account the occasional disagreement between annotators for the ground truth answers.
八、实验细节
Training Details:
\1.full model (Up-Down) is evaluated against prior work as well as an ablated baseline. In each case, the baseline (ResNet), uses a ResNet CNN pretrained on ImageNet to encode each image in place of the bottom-up attention mechanism.
\2.In image captioning experiments, the full-sized input image is encoded with the final convolutional layer of ResNet-101, and using bilinear interpolation to resize the output to a fixed size spatial representation of 10 ×10.
\3.In VQA experiments, the input image is encoded with ResNet-200. In separate experiments, the effect of varying the size of the spatial output is evaluated from its original size of 14×14, to 7×7 and 1×1.
九、验证的问题&效果
Question 1:
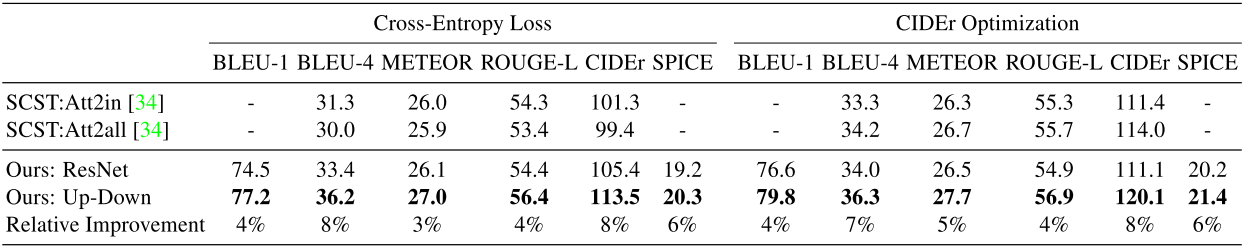
①.Performace of the full model and the ResNet baseline in comparison to the existing state-of-the-art Self-critical Sequence Training (SCST) approach on the test portion of the Karpathy splits.
Models are trained with both standard cross-entropy loss and CISEr score optimization. All results are from a single model with no fine-tuning of the input ResNet / R-CNN model. The SCST results are selected from the best of four randon initializations, and other results are outcomes from a single initialization.
Incorporating bottom-up attention, full Up-Down model shows significant improvements across all metrics regardless of whether cross-entropy loss or CIDEr optimization is used.
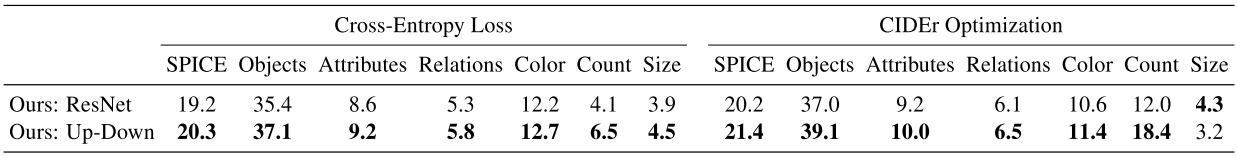
②.The improved performance in terms of identifying objects, object attributes and also the relationships between objects.
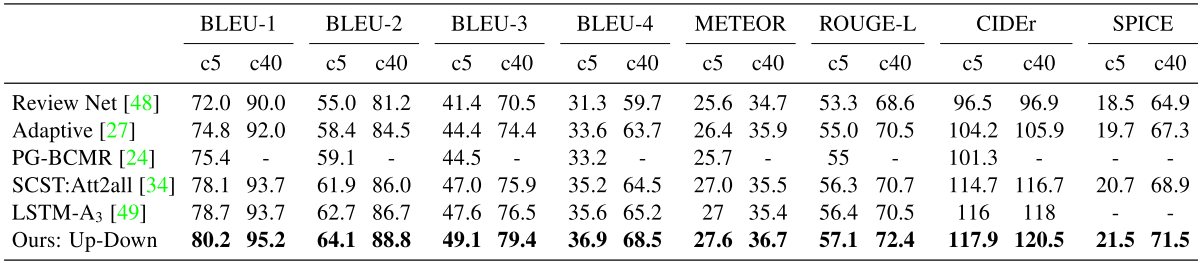
③.At the time of submission the model outperform all other test server submissions on all reported evaluation metrics on the official MSCOCO evaluation server.
Question 2:
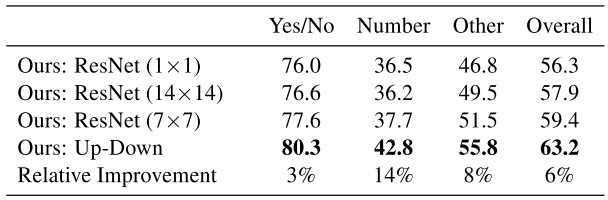
①.the single model performance of the full Up-Down VQA model relative to several ResNet baselines on the VQA v2.0 validation set.

②.At the time of submission, the model outperform all other test server submissions.
Question 3:
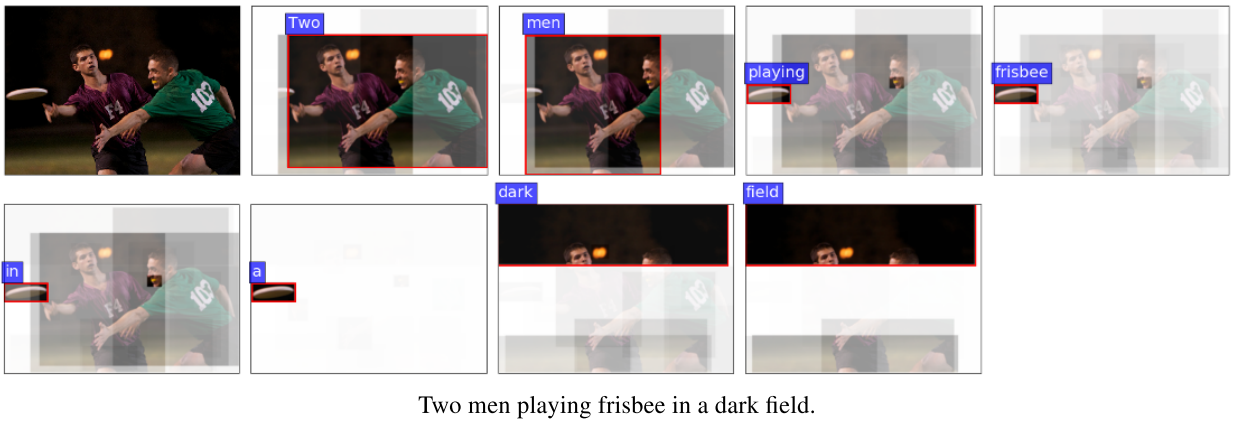
①.As indicated by the example, the approach is equally capable of focusing on fine details or large image regions. This capability arises because the attention candidates in the model consist of many overlapping regions with varying scales and aspect ratios - each aligned to an object, several related objects, or an otherwise salient image patch.
In other words, the approach is able to consider all of the information pertaining to an object at once, which is also a natural way for attention to be implemented, rather than all the visual concepts associated with those objects appear to be spatially co-located - and are processed together.
In the human visual system, the problem of integrating the separate features of objects in the correct combinations is known as the feature binding problem, and experiments suggest that attention plays a central role in the solution.