目次
序章
Simpleperf は、Android プラットフォーム上の CPU プロファイリング ツールです。アプリ プロセスとネイティブ プロセスの分析、Java および C++ コードの分析に使用できます。simpleperf 実行可能プログラムは、少なくとも L バージョンで実行され、Python スクリプト ツールは最低バージョンで実行されます。 Nバージョン。– googlesourceから翻訳
コンテンツ
Simpleperf ディレクトリには、simpleperf 実行可能ファイルと Python スクリプトの 2 つの部分が含まれています。Python スクリプトは、simpleperf のカプセル化と呼び出しです。基本的な操作は、スクリプトを介して簡単に実行できます。この記事では、Python スクリプトの入門的な使用方法のみに焦点を当てています。(simpleperf 実行可能プログラムを直接使用することもできますが、手動でデバイスにプッシュしてから構文をマスターする必要があります)
インストール
方法 1、simpleperf は ndk に含まれています。Android Studio がインストールされている場合は、AS から ndk コンポーネントを直接ダウンロードしてインストールできます。sdk の下に ndk-bundle という名前を付けます。または、ndk を個別にダウンロードすることもできます。
方法 2、simpleperf 圧縮パッケージを個別にダウンロードします(ndk バージョンに応じて選択できます)
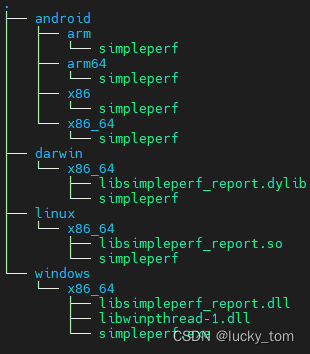
simpleperf のルートディレクトリを確認します。
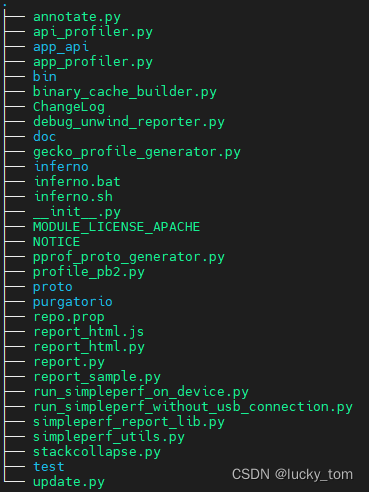
このうち、bin ディレクトリに Simpleperf の実行プログラムがあります。さまざまなプラットフォームが提供されています。Windows 上だけであれば、Android と
Windows だけで十分です。
取得スクリプト
スクリプトを振り返ってみましょう。スクリプトは、その機能に応じて 3 つのカテゴリに分類できます。
| 関数 | 脚本 |
|---|---|
| レコードする | app_profiler.py、run_simpleperf_without_usb_connection.py、inferno、run_simpleperf_on_device.py |
| レポートを生成する | レポート.py、レポート_サンプル.py |
| 分析データ | simpleperf_report_lib.py |
では、どうやって使うのでしょうか?公式の方法を参考にしてみてください。後で自分たちでやります。
app_profiler.py
Android アプリまたはネイティブ プログラムの CPU プロファイリング データを記録します。
simpleperf をデバイスにダウンロードし、それを使用して選択したアプリのプロファイリング データを収集し、
ホスト上のプロファイリング データと関連バイナリを取得します。
クリックして公式 Web サイトのルーチン - app_profiler.py を表示します。
ユーザーマニュアルを確認してください
$ python .\app_profiler.py --help

usage: app_profiler.py [-h]
                       (-p APP | -np NATIVE_PROGRAM | -cmd CMD | --pid PID [PID ...] | --tid TID [TID ...] | --system_wide)
                       [--compile_java_code] [-a ACTIVITY | -t TEST]
                       [-r RECORD_OPTIONS] [-lib NATIVE_LIB_DIR]
                       [-o PERF_DATA_PATH] [-nb] [--ndk_path NDK_PATH]
                       [--disable_adb_root] [--log {

    debug,info,warning}]

app_profiler.py: Record cpu profiling data of an android app or native program.

    It downloads simpleperf on device, uses it to collect profiling data on the selected app,
    and pulls profiling data and related binaries on host.

optional arguments:
  -h, --help            show this help message and exit

Select profiling target:
  -p APP, --app APP     Profile an Android app, given the package name. Like
                        `-p com.example.android.myapp`.
  -np NATIVE_PROGRAM, --native_program NATIVE_PROGRAM
                        Profile a native program running on the Android
                        device. Like `-np surfaceflinger`.
  -cmd CMD              Profile running a command on the Android device. Like
                        `-cmd "pm -l"`.
  --pid PID [PID ...]   Profile native processes running on device given their
                        process ids.
  --tid TID [TID ...]   Profile native threads running on device given their
                        thread ids.
  --system_wide         Profile system wide.

Extra options for profiling an app:
  --compile_java_code   Used with -p. On Android N and Android O, we need to
                        compile Java code into native instructions to profile
                        Java code. Android O also needs wrap.sh in the apk to
                        use the native instructions.
  -a ACTIVITY, --activity ACTIVITY
                        Used with -p. Profile the launch time of an activity
                        in an Android app. The app will be started or
                        restarted to run the activity. Like `-a
                        .MainActivity`.
  -t TEST, --test TEST  Used with -p. Profile the launch time of an
                        instrumentation test in an Android app. The app will
                        be started or restarted to run the instrumentation
                        test. Like `-t test_class_name`.

Select recording options:
  -r RECORD_OPTIONS, --record_options RECORD_OPTIONS
                        Set recording options for `simpleperf record` command.
                        Use `run_simpleperf_on_device.py record -h` to see all
                        accepted options. Default is "-e task-clock:u -f 1000
                        -g --duration 10".
  -lib NATIVE_LIB_DIR, --native_lib_dir NATIVE_LIB_DIR
                        When profiling an Android app containing native
                        libraries, the native libraries are usually stripped
                        and lake of symbols and debug information to provide
                        good profiling result. By using -lib, you tell
                        app_profiler.py the path storing unstripped native
                        libraries, and app_profiler.py will search all shared
                        libraries with suffix .so in the directory. Then the
                        native libraries will be downloaded on device and
                        collected in build_cache.
  -o PERF_DATA_PATH, --perf_data_path PERF_DATA_PATH
                        The path to store profiling data. Default is
                        perf.data.
  -nb, --skip_collect_binaries
                        By default we collect binaries used in profiling data
                        from device to binary_cache directory. It can be used
                        to annotate source code and disassembly. This option
                        skips it.

Other options:
  --ndk_path NDK_PATH   Set the path of a ndk release. app_profiler.py needs
                        some tools in ndk, like readelf.
  --disable_adb_root    Force adb to run in non root mode. By default,
                        app_profiler.py will try to switch to root mode to be
                        able to profile released Android apps.
  --log {

    debug,info,warning}
                        set log level
run_simpleperf_on_device.py
このスクリプトは、デバイス上で simpleperf 実行可能ファイルをプッシュし、デバイス上で simpleperf コマンドを実行します。adb コマンドを手動で実行するよりも便利です。adb
クリックして公式 Web サイトの例を表示します - アプリケーション起動時のプロファイル
マニュアルを確認してください。実際、そのサブコマンドは simpleperf とほぼ同じです。確認したい学生は、simpleperf -h を実行して確認できます。
$ python .\run_simpleperf_on_device.py -h

Usage: simpleperf [common options] subcommand [args_for_subcommand]
common options:
    -h/--help     Print this help information.
    --log <severity> Set the minimum severity of logging. Possible severities
                     include verbose, debug, warning, info, error, fatal.
                     Default is info.
    --log-to-android-buffer  Write log to android log buffer instead of stderr.
    --version     Print version of simpleperf.
subcommands:
    api-collect         Collect recording data generated by app api
    api-prepare         Prepare recording via app api
    debug-unwind        Debug/test offline unwinding.
    dump                dump perf record file
    help                print help information for simpleperf
    inject              parse etm instruction tracing data
    kmem                collect kernel memory allocation information
    list                list available event types
    record              record sampling info in perf.data
    report              report sampling information in perf.data
    report-sample       report raw sample information in perf.data
    stat                gather performance counter information
    trace-sched         Trace system-wide process runtime events.
run_simpleperf_without_usb_connection.py
run_simpleperf_without_usb_connection.py は、USB ケーブルが接続されていないときにプロファイリング データを記録します。おそらく api_profiler.py の方が適しており、記録時に USB ケーブルも必要ありません。以下は例です。
クリックして公式 Web サイトの例を表示します - run_simpleperf_without_usb_connection_py
マニュアルを読む
$ python .\run_simpleperf_without_usb_connection.py -h
usage: run_simpleperf_without_usb_connection.py [-h] {

    start,stop} ...

    Support profiling without usb connection in below steps:
    1. With usb connection, start simpleperf recording.
    2. Unplug the usb cable and play the app you want to profile, while the process of
       simpleperf keeps running and collecting samples.
    3. Replug the usb cable, stop simpleperf recording and pull recording file on host.

    Note that recording is stopped once the app is killed. So if you restart the app
    during profiling time, simpleperf only records the first running.

positional arguments:
  {

    start,stop}
    start       Start recording.
    stop        Stop recording.

optional arguments:
  -h, --help    show this help message and exit
紹介によると、おそらく接続前にstartを実行し、録画が終わったらusbに接続し、stopを実行してから収集したデータを取り出すという意味で、充電のためにusbに接続しないシーンに適していると思われます。なお、途中でアプリが強制終了された場合、データ収集は自動的に終了します。
レポートを見る
前のステップでは、主にスクリプトを実行してデータを収集する方法を学習しましたが、データを取得したら、任意の形式で表示および分析できます。公式ウェブサイトには N 個以上の選択肢があります (クリックして参照)
最初に付属しているものを見てみましょう。他の方法は試していません。目的は、関数の時間消費をグラフ形式で分析するのに役立つことです。
レポート_html.py
report_html.py は、プロファイリング データに基づいて report.html を生成します。これにより、report.html は他のファイルに依存せずにプロファイリング結果を表示できます。したがって、ローカルブラウザで表示したり、他のマシンに渡したりすることができます。使用されるコマンド ライン オプションに応じて、report.html のコンテンツには、チャート統計、サンプル テーブル、フレームグラフ、各関数の注釈付きソース コード、各関数の注釈付き逆アセンブリが含まれます。
prof.data を HTML レポート形式に変換します。フレーム グラフを含めることができます。
マニュアルを読む
$ python .\report_html.py -h
usage: report_html.py [-h] [-i RECORD_FILE [RECORD_FILE ...]] [-o REPORT_PATH]
                      [--min_func_percent MIN_FUNC_PERCENT]
                      [--min_callchain_percent MIN_CALLCHAIN_PERCENT]
                      [--add_source_code]
                      [--source_dirs SOURCE_DIRS [SOURCE_DIRS ...]]
                      [--add_disassembly]
                      [--binary_filter BINARY_FILTER [BINARY_FILTER ...]]
                      [--ndk_path NDK_PATH] [--no_browser] [--show_art_frames]
                      [--aggregate-by-thread-name]

report profiling data

optional arguments:
  -h, --help            show this help message and exit
  -i RECORD_FILE [RECORD_FILE ...], --record_file RECORD_FILE [RECORD_FILE ...]
                        Set profiling data file to report. Default is
                        perf.data.
  -o REPORT_PATH, --report_path REPORT_PATH
                        Set output html file. Default is report.html.
  --min_func_percent MIN_FUNC_PERCENT
                        Set min percentage of functions shown in the report.
                        For example, when set to 0.01, only functions taking
                        >= 0.01% of total event count are collected in the
                        report. Default is 0.01.
  --min_callchain_percent MIN_CALLCHAIN_PERCENT
                        Set min percentage of callchains shown in the report.
                        It is used to limit nodes shown in the function
                        flamegraph. For example, when set to 0.01, only
                        callchains taking >= 0.01% of the event count of the
                        starting function are collected in the report. Default
                        is 0.01.
  --add_source_code     Add source code.
  --source_dirs SOURCE_DIRS [SOURCE_DIRS ...]
                        Source code directories.
  --add_disassembly     Add disassembled code.
  --binary_filter BINARY_FILTER [BINARY_FILTER ...]
                        Annotate source code and disassembly only for selected
                        binaries.
  --ndk_path NDK_PATH   Find tools in the ndk path.
  --no_browser          Don't open report in browser.
  --show_art_frames     Show frames of internal methods in the ART Java
                        interpreter.
  --aggregate-by-thread-name
                        aggregate samples by thread name instead of thread id.
                        This is useful for showing multiple perf.data
                        generated for the same app.
例を使用して APP のコールド スタートを観察します (Douyin を例にします)
- パッケージ名とlancherActivityを決定します。
パッケージ名: com.ss.android.ugc.aweme
LancherActivity: com.ss.android.ugc.aweme/.splash.SplashActivity
事前に実行してください: adb shell amforce-stop com.ss.android.ugc.aweme
- 監視開始コマンドを実行する
python .\app_profiler.py -p com.ss.android.ugc.aweme -a com.ss.android.ugc.aweme.splash.SplashActivity -r “-e タスククロック:u -f 100 -g --duration 10インチ
- 前の手順が完了すると、デフォルトで perf.data という名前のファイルが取得されます (-o パラメーターを追加して名前を変更できます)。実行を続けます:
Python .\report_html.py
- 分析が完了すると、デフォルトで report.html という名前のファイルが取得されます (-o パラメーターを追加して名前を変更できます)。通常、このファイルは自動的に開きます。
フレームグラフ解析
3 番目のタブに切り替えます: Flamegraph (フレーム グラフ)
-
各列は呼び出しスタック (スタック フレーム) を表し、各グリッドは関数を表します。
-
縦軸はコール スタックの深さを表し、コール スタックが高くなるほどコール スタックも深くなり、下の四角は上の四角の複素関数になります。
-
横軸はフレームグラフが収集する複数のコールスタック情報を表しており、アルファベット順にソートすることで大量の情報が集約されています。時間を表すものではないことに注意してください。
-
フレームグラフのグリッドの色はランダムな暖色です。
まずメイン スレッドを決定し、次におなじみの onCreate メソッドを検索すると、一致したメソッドが紫色でマークされます。
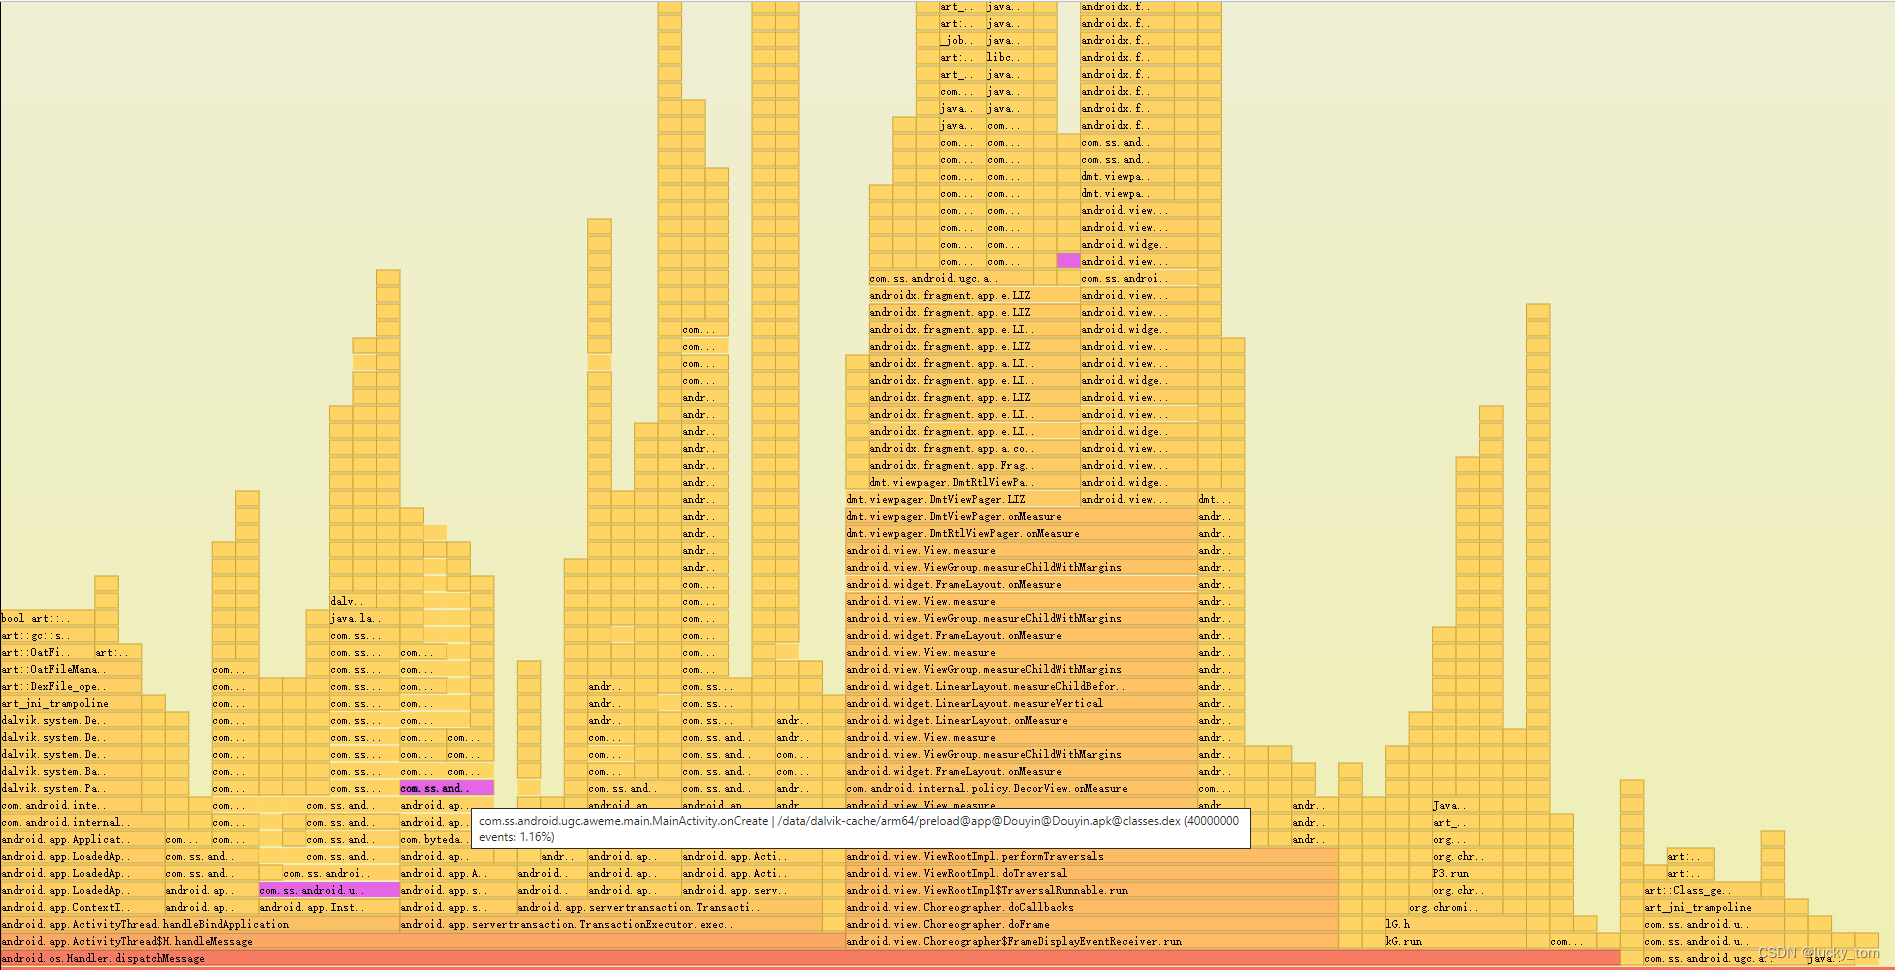
関数をクリックすると、この関数をそのサブ呼び出しを追跡するための新しいベースとして使用できます。(前のレベルに戻るには、ズームアウトをクリックします)
関数の消費時間の分析は主に「フラットトップ」関数に依存し、時間がかかるほどサンプリングされる確率が高くなります。
個人的な理解ですが、この関数はアイデアをさらに分析するのに長い時間がかかります。
- 設計: 関数自体のロジックが合理的に設計されているか、再帰があるかどうかに注目します。
- スケジューリング: スレッドの優先順位は低いですか? また、大きいコアまたは小さいコアでスケジュールされていますか?
- 周波数制限:周波数が制限されているかどうかをトレースとともに解析できます。
- ブロッキング: ブロッキング待機、バインダー呼び出し待機があるかどうか。
- ロック: ロック競合
終了
現在の主な目的は、Simpleperf のクローリングと収集方法を学び、関数の明らかに時間のかかる問題を特定することです。実際、公式 Web サイトの説明が最も包括的です。この記事には、簡単にジャンプできるように各所にハイパーリンクも挿入されています詳細やその他の使用上のニーズが必要な場合は、公式 Web サイトを確認してください。
参考
[翻訳] Android システムの Simpleperf 分析
[公式ウェブサイト - 実行可能なコマンドは、スクリプトを使用しない Simpleperf の本来の使用方法を参照しています]
【公式サイト - Simpleperf#Androidプラットフォームプロファイリング収集システムプロセス】
【公式サイト - Simpleperf#Androidアプリプロファイリング取得アプリ】
【公式サイト - Simpleperf #Scripts リファレンススクリプトの使い方】