データセットはここからダウンロードできます:
https://www.kaggle.com/c/titanic
このプロジェクトでは、次のPythonライブラリを使用します。
- Numpy -Python科学計算ライブラリ(マトリックス操作)
- パンダ -Pythonデータ分析および処理ライブラリ
- Scikit-learn- Python機械学習ライブラリ(機械学習アルゴリズム)
1.最初にデータを確認する
import pandas as pd
titanic = pd.read_csv(r"S:\数据分析\kaggle_Titanic\train.csv")
titanic.head() # 默认前五行
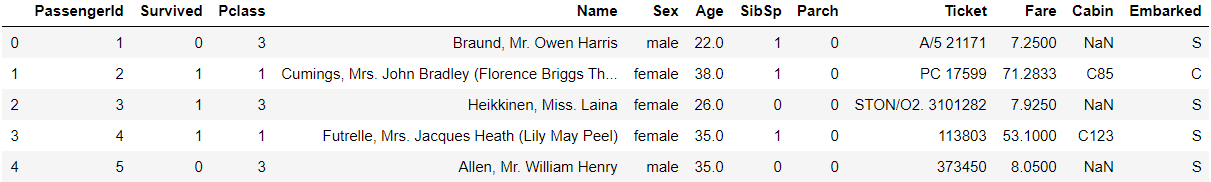
タイタニックのデータにどのような特徴があるかを調べ、どの特徴が生存確率に大きな影響を与えるかを分析できます。
第二に、次のデータ前処理
print(titanic.describe()) # 按列统计特征
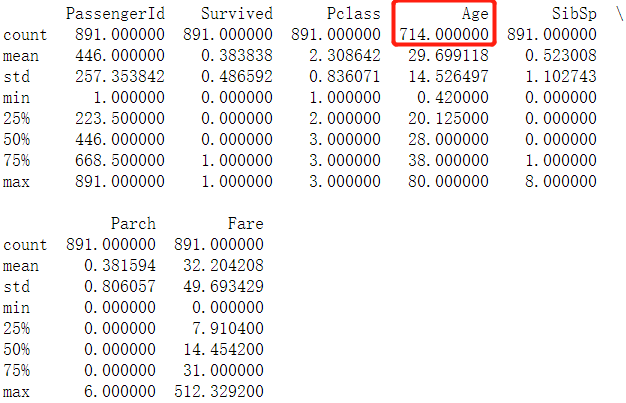
列の特性の統計から、Age値が欠落していることがわかりました。そのため、欠落している値に対処するには、次のようにします。
import pandas as pd
titanic['Age'] = titanic['Age'].fillna(titanic['Age'].mean()) # 使用均值填充缺失值
print(titanic.describe())
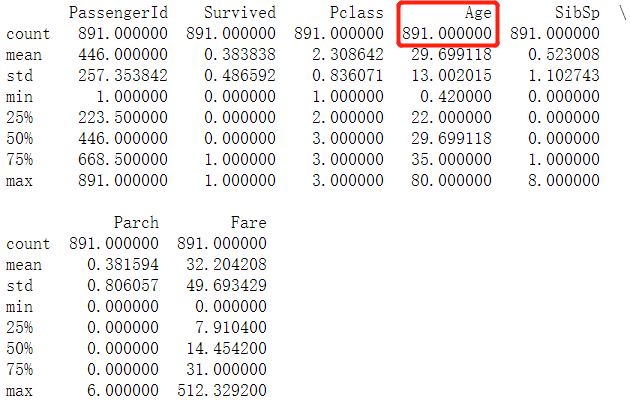
したがって、年齢データが入力されます。
次に、Sex機能のワンホットエンコーディング:
print(titanic['Sex'].unique()) # 查看Sex特征有哪些值
>>> ['male' 'female']

# loc定位到目标行,对Sex特征进行独热编码
titanic.loc[titanic['Sex'] == 'male', 'Sex'] = 0 # 令Sex等于male那行的Sex值为1
titanic.loc[titanic['Sex'] == 'female', 'Sex'] = 1 # 令Sex等于female那行的Sex值为0
次に、エンバークされた機能で欠損値処理とワンホットエンコーディングを実行します。
print(titanic['Embarked'].unique())
>>> ['S' 'C' 'Q' nan] # 存在缺失值

titanic['Embarked'] = titanic['Embarked'].fillna('S') # S数量多,可以用S补充缺失值
titanic.loc[titanic['Embarked'] == 'S', "Embarked"] = 0
titanic.loc[titanic['Embarked'] == 'C', "Embarked"] = 1
titanic.loc[titanic['Embarked'] == 'Q', "Embarked"] = 2
3.線形回帰モデルを使用して生存確率を予測する
from sklearn.linear_model import LinearRegression # 导入线性回归的类,采用二分类进行分类预测
from sklearn.model_selection import KFold # K折交叉验证,取平均,调参

predictors = ["Pclass", "Sex", "Age", "SibSp", "Parch", "Fare", "Embarked"] # 输入机器学习算法的特征

alg = LinearRegression() # 初始化线性回归类
kf = KFold(n_splits=3, random_state=1) # KFold类实例化
# kf.get_n_splits(titanic) # 交叉验证集的拆分迭代次数

predictions = []

# 有3次for循环,每次建立一个回归模型
for train, test in kf.split(titanic):
    train_predictors = (titanic[predictors].iloc[train,:]) # 取出训练数据
    train_target = titanic["Survived"].iloc[train] # 获取到数据集中交叉分类好的标签,即是否活了下来
    alg.fit(train_predictors, train_target) # 训练模型
    test_predictions = alg.predict(titanic[predictors].iloc[test,:]) # 检验模型误差
    predictions.append(test_predictions)
sklearn 0.18以降では、cross_validationパッケージは非推奨になりました。
KFoldドキュメント:https ://scikit-learn.org/stable/modules/generated/sklearn.model_selection.KFold.html?highlight=kfold#sklearn.model_selection.KFold
モデルトレーニングの効果を確認します。
import numpy as np

predictions = np.concatenate(predictions, axis=0) # 转换成数组,才能比较大小

# 使用线性回归得到的结果是在区间[0,1]上的某个值,需要将该值转换成0或1
predictions[predictions > 0.5] = 1
predictions[predictions <= 0.5] = 0

print("测试数据的总数量:", len(predictions))
print("正确的数量:", sum(predictions == titanic["Survived"]))
accuracy = sum(predictions == titanic["Survived"]) / len(predictions)
print("准确率为:", accuracy)

4.ロジスティック回帰モデルを使用して生存確率を予測する
from sklearn import model_selection
from sklearn.linear_model import LogisticRegression

alg = LogisticRegression(random_state=1, solver='liblinear') # 初始化逻辑回归类

# 逻辑回归交叉验证
score = model_selection.cross_val_score(alg, titanic[predictors], titanic["Survived"], cv=3)
print("准确率为:", score.mean())

予測には回帰モデルが使われているようで、効果はあまり良くない...
5、ランダムフォレストモデルを使用して生存確率を予測する
ランダムな意味:
- データサンプルのランダムサンプリング
- 機能のランダムサンプリング
ランダムフォレストは機能を無効にすることができるため、ランダムフォレストは過剰適合を防ぎ、アルゴリズムの精度の信頼性を高めることができます。
from sklearn import model_selection
from sklearn.ensemble import RandomForestClassifier

predictors = ["Pclass", "Sex", "Age", "SibSp", "Parch", "Fare", "Embarked"]

alg = RandomForestClassifier(random_state=1, n_estimators=50, min_samples_split=4, min_samples_leaf=2)

kf = model_selection.KFold(n_splits=3, random_state=1) # 三次交叉验证
# print(kf.get_n_splits(titanic)) # 交叉验证集的拆分迭代次数

score = model_selection.cross_val_score(alg, titanic[predictors], titanic["Survived"], cv=kf.split(titanic))

print("准确率为:", score.mean())

上記の2つの回帰モデルによって得られる精度が高いことがわかります。
ランダムフォレスト分類器のパラメーターを理解します。
-
random_state
は、毎回乱数シードを生成します。 -
n_estimators(int、オプション(デフォルト= 100))
フォレスト内のツリーの数。 -
min_samples_split(int、float、optional(default = 2)
内部ノードを分割するために必要なサンプルの最小数。
如果为int,则认为 min_samples_split 是最小值。
如果为 float,min_samples_split则为分数,是每个拆分的最小样本数。 -
min_samples_leaf(整数、浮動小数点数、オプション(デフォルト= 1))
葉ノードで必要なサンプルの最小数。
min_samples_leafが少なくとも左右のブランチにトレーニングサンプルを持っている場合のみ、分割ポイントの深さが考慮されます。これは、特に回帰において、モデルを平滑化する効果がある場合があります。
如果为int,则认为 min_samples_leaf 是最小值。
如果为float,min_samples_leaf 则为分数,是每个节点的最小样本数。
6、機能プロジェクトを確立する
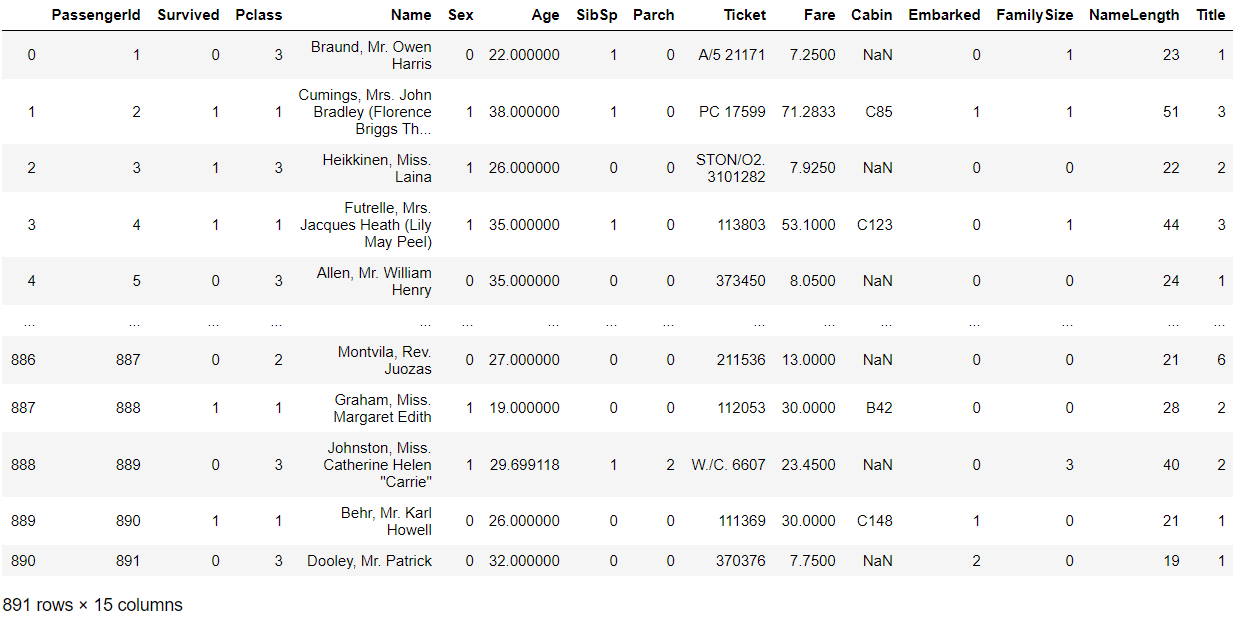
# 第一个特征:亲属数量
titanic["FamilySize"] = titanic["SibSp"] + titanic["Parch"]
# 第二个特征:名字长度
titanic["NameLength"] = titanic["Name"].apply(lambda x:len(x))
titanic
import re
def get_title(name):
title_search = re.search('([A-Za-z]+)\.', name) # \.匹配.(转义)
if title_search:
return title_search.group(1)
return ""
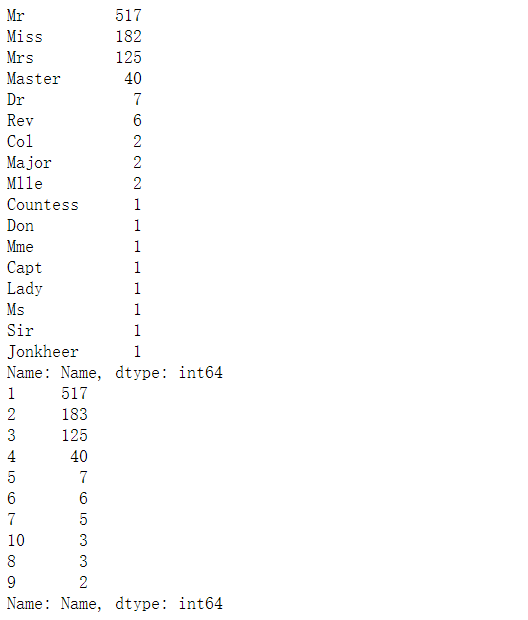
titles = titanic["Name"].apply(get_title)
print(pd.value_counts(titles))
title_mapping = {"Mr": 1, "Miss": 2, "Mrs": 3, "Master": 4, "Dr": 5, "Rev": 6, "Major": 7, "Col": 7, "Mlle": 8,
"Mme": 8, "Don": 9, "Lady": 10, "Countess": 10, "Jonkheer": 10, "Sir": 9, "Capt": 7, "Ms": 2}
for k, v in title_mapping.items():
titles[titles == k] = v
print(pd.value_counts(titles))
titanic["Title"] = titles # 添加新特征:身份
7、特徴選択
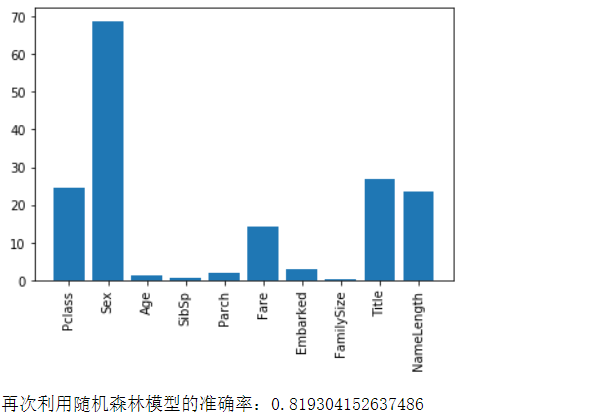
ノイズを追加して、機能の重要性を分析します。
from sklearn.feature_selection import SelectKBest, f_classif # 特征选择库
import matplotlib.pyplot as plt # 画出直方图,分析特征的权重

predictors = ["Pclass", "Sex", "Age", "SibSp", "Parch", "Fare", "Embarked", "FamilySize", "Title", "NameLength"]

selector = SelectKBest(f_classif, k=5) # f_classif:基于方差分析的检验统计f值,根据k个最高分数选择功能
selector.fit(titanic[predictors], titanic["Survived"])

scores = -np.log10(selector.pvalues_)

plt.bar(range(len(predictors)), scores)
plt.xticks(range(len(predictors)), predictors, rotation='vertical')
plt.show()

predictors = ["Pclass", "Sex", "Fare", "Title"]

alg = RandomForestClassifier(random_state=1, n_estimators=50, min_samples_split=8, min_samples_leaf=4)
kf = model_selection.KFold(n_splits=3, random_state=1)
scores = model_selection.cross_val_score(alg, titanic[predictors], titanic["Survived"], cv=kf)
print("再次利用随机森林模型的准确率:" + str(scores.mean()))
8、複数のアルゴリズムを統合
from sklearn.ensemble import GradientBoostingClassifier
import numpy as np

algorithms = [
    [GradientBoostingClassifier(random_state=1, n_estimators=45, max_depth=6), ['Pclass','Sex','Age','SibSp','Parch','Fare','Embarked','FamilySize','NameLength','Title']],
    [LogisticRegression(random_state=1, solver='liblinear'), ['Pclass','Sex','Age','SibSp','Parch','Fare','Embarked','FamilySize','NameLength','Title']]
]

kf = KFold(n_splits=3, random_state=1)

predictions = []

for train, test in kf.split(titanic):
    train_target = titanic["Survived"].iloc[train]
    full_test_predictions = []

    for alg, predictors in algorithms:
        alg.fit(titanic[predictors].iloc[train,:], train_target)
        test_predictions = alg.predict_proba(titanic[predictors].iloc[test,:].astype(float))[:,1]
        full_test_predictions.append(test_predictions)

    test_predictions = (full_test_predictions[0] + full_test_predictions[1]) / 2

    test_predictions[test_predictions <= 0.5] = 0
    test_predictions[test_predictions > 0.5] = 1
    predictions.append(test_predictions)

predictions = np.concatenate(predictions, axis=0)

accuracy = sum(predictions == titanic["Survived"]) / len(predictions)
print("准确率为:", accuracy)

リファレンス:Tianshan Intelligent Cloud Classroom Python Machine Learning Kaggle Case
